HAL Id: hal-00303918
https://hal.archives-ouvertes.fr/hal-00303918
Submitted on 29 Nov 2004HAL is a multi-disciplinary open access
archive for the deposit and dissemination of sci-entific research documents, whether they are pub-lished or not. The documents may come from teaching and research institutions in France or abroad, or from public or private research centers.
L’archive ouverte pluridisciplinaire HAL, est destinée au dépôt et à la diffusion de documents scientifiques de niveau recherche, publiés ou non, émanant des établissements d’enseignement et de recherche français ou étrangers, des laboratoires publics ou privés.
Aerosol particles in the mexican east pacific part I:
processing and vertical redistribution by clouds
J. C. Jiménez, D. Baumgardner, G. B. Raga
To cite this version:
J. C. Jiménez, D. Baumgardner, G. B. Raga. Aerosol particles in the mexican east pacific part I: processing and vertical redistribution by clouds. Atmospheric Chemistry and Physics Discussions, European Geosciences Union, 2004, 4 (6), pp.7795-7818. �hal-00303918�
ACPD
4, 7795–7818, 2004
Aerosol particles in the mexican east
pacific part I J. C. Jim ´enez et al.
Title Page Abstract Introduction Conclusions References Tables Figures J I J I Back Close
Full Screen / Esc
Print Version Interactive Discussion
EGU Atmos. Chem. Phys. Discuss., 4, 7795–7818, 2004
www.atmos-chem-phys.org/acpd/4/7795/ SRef-ID: 1680-7375/acpd/2004-4-7795 European Geosciences Union
Atmospheric Chemistry and Physics Discussions
Aerosol particles in the mexican east
pacific part I: processing and vertical
redistribution by clouds
J. C. Jim ´enez, D. Baumgardner, and G. B. Raga
Universidad Nacional Aut ´onoma de M ´exico, Mexico City, Mexico
Received: 23 September 2004 – Accepted: 5 November 2004 – Published: 29 November 2004
Correspondence to: D. Baumgardner (darrel@servidor.unam.mx)
ACPD
4, 7795–7818, 2004
Aerosol particles in the mexican east
pacific part I J. C. Jim ´enez et al.
Title Page Abstract Introduction Conclusions References Tables Figures J I J I Back Close
Full Screen / Esc
Print Version Interactive Discussion
EGU Abstract
Airborne measurements of aerosol particle size distributions were made in the Mexican Intertropical Convergence Zone. The shape of the spectra at cloud base was compared with those at higher altitudes and near cloud boundaries to identify signatures of cloud processed particles. Of 78 cases analyzed, 71% showed enhancement in volume of 5
super-micron particles, 49% had enhanced volume of sub-micron particles, 28% were homogeneous mixtures with boundary layer air, and 24% had super-micron particles removed by precipitation. Almost 100% of the cases with enhanced volume in sub-micron particles also occurred with enhanced super-sub-micron volume. The enhanced volume in super-micron particles is approximately 10 times larger than the sub-micron 10
enhancement. Cloud processed particles in marine air masses had twice as much en-hancement of super-micron mass than found in particles processed by clouds formed from continental sources, likely a result of a more efficient coalescence process in clean, maritime clouds. These results are in qualitative agreement with previous ob-servational and theoretical studies that relate enhancements in particle mass to the 15
uptake by cloud droplets of SO2and subsequent growth by coalescence.
1. Introduction
Aerosol particles (AP) have a dominant role in the formation of clouds, their optical properties and their lifetimes. The fundamental process by which a cloud droplet forms on an AP, i.e. a cloud condensation nucleus (CCN), is well understood and can be de-20
scribed theoretically and validated with observations if the composition of the particles is known (e.g. Twomey, 1991; Raga and Jonas, 1993a, b). On the other hand, the fate of AP after processing by clouds, i.e. changes in size, concentration and composition, is less well understood. Clouds are a transport mechanism that removes AP from the boundary layer and redistributes them through a variety of dynamical and microphys-25
ACPD
4, 7795–7818, 2004
Aerosol particles in the mexican east
pacific part I J. C. Jim ´enez et al.
Title Page Abstract Introduction Conclusions References Tables Figures J I J I Back Close
Full Screen / Esc
Print Version Interactive Discussion
EGU generally accepted that some fraction of the AP incorporated into cloud particles will
eventually appear again as AP but in a chemically or physically altered form. For ex-ample, aircraft measurements have found that AP sizes can increase in regions of high relative humidity (RH) near clouds (Baumgardner and Clarke, 1998) and other studies (Saxena et al., 1970; DeFelice and Cheng, 1998; Kaneyasu et al., 2001) found that 5
condensation nuclei (CN) concentrations are often higher in the outflow from evaporat-ing clouds than in the environment further away. The AP mass will change as a result of particle sulfate and SO2 scavenging (Hegg and Hobbs, 1981, 1982; Flossmann et al., 1985, 1987; Flossmann and Pruppacher, 1988; O’Dowd et al., 2000).
There have been a number of observational studies of AP interactions with clouds 10
(Hegg and Hobbs, 1981, 1983; O’Dowd et al., 2000), but very few in the Pacific In-tertropical Convergence Zone (ITCZ) and none in the Mexican East Pacific ITCZ. This region is unique as a result of the variation in AP sources. When the wind direc-tion is westerly the AP are of maritime origin and total number concentradirec-tions are less than 500 cm−3. Northerly and easterly winds, however, bring continental, anthro-15
pogenic AP from Mexico or Central America and the average total number concen-trations are greater than 1000 cm−3. These differences in AP origins have significant consequences on cloud formation and the fate of the AP when they are processed by clouds. This paper, part one of two parts, evaluates airborne measurements of AP and cloud particles in the ITCZ of the Mexican East Pacific and shows how AP properties 20
are affected by cloud processing. Part two will discuss the direct and indirect effect of AP in this region of the tropics.
2. Measurement and analysis methodology
2.1. Research area and sampling strategy
The data used in this study were obtained during flights of the US National Science 25
Cli-ACPD
4, 7795–7818, 2004
Aerosol particles in the mexican east
pacific part I J. C. Jim ´enez et al.
Title Page Abstract Introduction Conclusions References Tables Figures J I J I Back Close
Full Screen / Esc
Print Version Interactive Discussion
EGU mate (EPIC) project. The program and scientific objectives are described in the EPIC
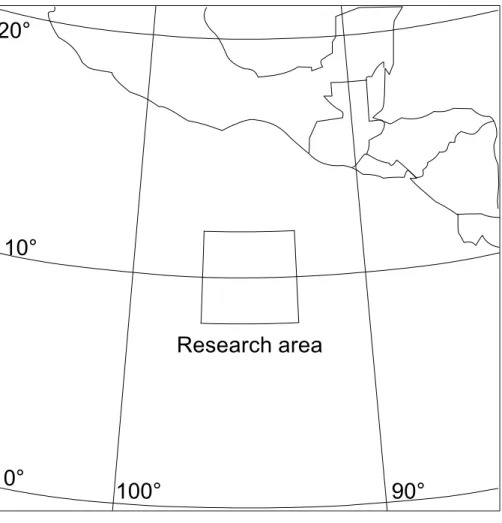
science and implementation plan (Raymond et al., 2004). Nine of the nineteen flights between 1 September and 16 October 2001 were dedicated to AP and cloud studies. These flights were within the region 8◦–12◦N, 93◦–97◦W, approximately 800–1000 km from Mexico and Central America in the ITCZ region (Fig. 1). Measurements in and 5
around clouds were made at constant levels starting at 4200 m and then descending to 2500 m, 1000 m, 300 m (cloud base) and 30 m a.s.l. The clouds in the research area consisted of small fields of shallow cumulus and lines of deep convection. The investi-gation concentrated on these latter clouds that generally developed from the southwest to northeast. The flight trajectories were across and along the cloud lines at each level. 10
The across-the-line patterns normally sampled in the regions of newer growth and the along-the-line flight legs sampled cells in both developing and decaying stages. In the across-the-line flight tracks the aircraft sampled cloud-free air for at least 20 km on each side of the cloud.
2.2. Instrumentation 15
The physical and optical properties of AP are derived directly from the particle size distribution (PSD), a composite synthesized from the measurements by three optical particle spectrometers: PCASP, FSSP-300 and FSSP-100 that measure in the size ranges 0.1–3 µm, 0.3–20 µm and 2–50 µm, respectively. The concentrations in over-lapping size ranges were averaged prior to creating the composite. The concentration 20
of condensation nuclei (CN) was measured with a TSI Model 3760, measurements of Cloud Condensation Nuclei (CCN) were made with a University of Wyoming Static Diffusion Cloud Chamber, and the coefficients of light scattering and absorption were measured with a Radiance Research nephelometer and particle soot absorption pho-tometer (PSAP), respectively. All measurements were averaged into one second inter-25
vals except the CCN that takes a measurement every 60 s. The technical specifications of these instruments are listed in Table 1.
ACPD
4, 7795–7818, 2004
Aerosol particles in the mexican east
pacific part I J. C. Jim ´enez et al.
Title Page Abstract Introduction Conclusions References Tables Figures J I J I Back Close
Full Screen / Esc
Print Version Interactive Discussion
EGU by a number of authors (Kim and Boatman, 1990; Strapp et al., 1992) as have those
of the FSSP-100 and FSSP-300 (Baumgardner et al., 1985, 1992; Baumgardner and Spowart, 1990). The PSAP measurements were corrected using the scattering coe ffi-cient from the nephelometer and an empirical factor (Bond et al., 1999).
The three optical size spectrometers were mounted on the wing pods of the C-130. A 5
heater on the inlet to the PCASP reduces the relative humidity (RH) of the sampled air stream to less than 30% (Strapp et al., 1992); hence, the PCASP measures AP whose water content has been removed. The FSSP-100 and FSSP-300 measure particles at the ambient RH. In order to combine the measurements from the FSSP 100 and 300 with those of the PCASP, the spectra were adjusted to a dry equivalent. This adjust-10
ment assumes that the measured particles are deliquesced NaCl with the amount of water mass on the particle determined by the ambient RH (Tang, 1980). The resulting sizes are calculated by removing the predicted water mass.
The CN, CCN, PSAP and nephelometer were mounted in the cabin and sampled from inlets mounted on the aircraft exterior. The CN inlet was mounted on the bottom 15
of the fuselage with a special housing to minimize spurious counting caused by drop breakup on the inlet lips. Examination of the CN measurements when in rain indicated that this housing was ineffective and CN during these periods are not included in the current analysis. The CCN, PSAP and nephelometer shared a common, backward facing inlet to minimize droplet shattering and to allow measurements of interstitial 20
aerosols in cloud. The largest size that can enter this inlet is approximately one mi-crometer, a threshold that has been established from previous studies (Baumgardner et al., 1991).
2.3. Analysis of cloud processing signatures
Cloud processing of AP changes their size, concentration or composition. These 25
changes are reflected in differences in the shapes of PSDs measured “near cloud” compared with two reference PSDs – those at cloud base and “far from cloud”. The cloud base PSD is used as a reference under the assumption that the majority of cloud
ACPD
4, 7795–7818, 2004
Aerosol particles in the mexican east
pacific part I J. C. Jim ´enez et al.
Title Page Abstract Introduction Conclusions References Tables Figures J I J I Back Close
Full Screen / Esc
Print Version Interactive Discussion
EGU droplets form on CCN that enter through cloud base (Flossmann, 1998). The “far from
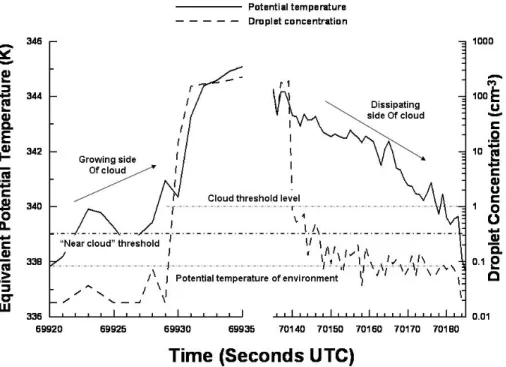
cloud” PSD is measured at the same altitude as “near cloud” but at a distance from cloud where it is assumed the air has not been mixed with “near cloud” air. In the present study, near-cloud is defined as those regions where the equivalent potential temperature, Θe, is at least one degree different than the environmental Θe, deter-5
mined from a vertical profile made in a clear air region far from clouds. The time series in Fig. 2 shows two “near cloud” regions where one side is designated as the “grow-ing” side (69 922–69 929) and the other the “dissipat“grow-ing” side (70 141–70 181). The cloud edge is determined from the droplet concentrations measured by the FSSP-100, whose lower size threshold is approximately 2 µm. When the droplet concentration ex-10
ceeds 1 cm−3 the measurements are defined as “in-cloud”. This criterion is based on an evaluation of measurements at an altitude of 30 m where there are no clouds and only micron sea salt particles will be measured by the FSSP-100. These super-micron particles are the first to be activated at low supersaturations during cloud for-mation, hence their average concentration of <1 cm−3sets the lower limit for the cloud 15
droplet concentration when there has been no entrainment and mixing with droplet-free air.
A growing region is distinguished from a dissipating side by the rate at which theΘe changes as cloud edge is approached and by its variability. In the example shown in Fig. 2,Θeon the growing side increases from the environmental value of 338 to the in 20
cloud value of 344 in ten seconds of flight (approximately 1000 m) but on the other side of the cloud, in the dissipating region, the sameΘechange occurs over 4000 m.
In the following analysis, we assume that the majority of AP at cloud edges is a mix of cloud processed and ambient air. We also assume that the AP in cloud, either nuclei of cloud droplets or interstitial, have originated at cloud base. Finally, we assume that 25
our technique for removing water mass as a function of ambient RH provides a conser-vative estimate of the dry diameter such that size changes by deliquescence will not be a factor in the evaluations. In the following analysis, the PSD are presented as volume concentrations (µm3cm−3) as a function of size. This emphasizes the sizes changes
ACPD
4, 7795–7818, 2004
Aerosol particles in the mexican east
pacific part I J. C. Jim ´enez et al.
Title Page Abstract Introduction Conclusions References Tables Figures J I J I Back Close
Full Screen / Esc
Print Version Interactive Discussion
EGU by cloud processing and underscores the importance of volume changes since particle
mass, fall velocity and heterogeneous chemistry depend on the volume more than on number concentration. Volume changes are also a reflection of mass increases that result from in-cloud aqueous chemistry or droplet coalescence.
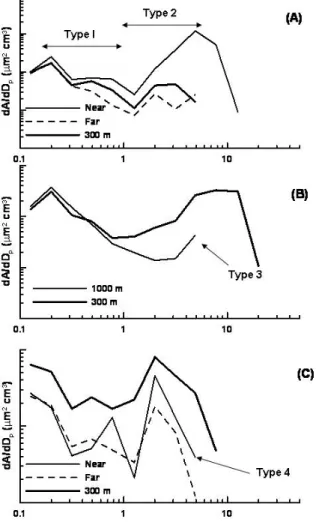
Based upon a visual inspection of the measured PSDs, four patterns have been 5
identified that are associated with cloud processed particles: 1) enhanced concentra-tions of sub-micron AP (≤1 µm), 2) enhanced concentraconcentra-tions of super-micron (>1 µm), 3) removal of super-micron particles and 4) dilution with minimal changes in the shape of the PSD.
Figure 3a illustrates Types 1 and 2, enhancement of sub and super micron particles 10
with respect to the cloud base PSD. The near cloud measurements in this example were made at 1000 m and cloud base is always at 300 m. The concentration of particles less than 0.3 µm in the far cloud measurements are the same as at 300 m but decrease at larger sizes. The near cloud concentrations are greater at all sizes. Concentrations increase with respect to the cloud base AP by four mechanisms: 1) mixing with ambient 15
air whose particle concentration is higher than at cloud base, 2) growth of particles with sizes smaller 0.1 µm, 3) droplet coalescence, or 4) AP scavenging by cloud droplets. Given that the ambient AP concentration shown in Fig. 3a is the same or lower than cloud base, the 1st mechanism does not contribute to enhanced concentration. The minimum size threshold of the PCASP is 0.1 µm; hence, AP with sizes less than 0.1 µm 20
may grow as a result of cloud processing into the range of the PCASP. AP can grow as a result of chemical reactions whereby ambient gases like SO2are dissolved in water droplets and aqueous chemistry increases the mass of the original CCN (Hegg et al., 1982, 1983; Flossmann et al., 1987; Flossmann and Pruppacher, 1988; O’Dowd et al., 2000; Alfonso and Raga, 2002). This mechanism will increase the mass of all CCN 25
within cloud droplets after evaporation, as suggested in the near cloud PSD of Fig. 3a whose peak at 0.8 µm is slightly higher than the peak of the cloud base PSD found at 0.5 µm. The AP in a drop formed by coalescence of droplets is the combined mass of the CCN in the original droplets (Flossmann et al., 1987; Alfonso and Raga, 2002),
ACPD
4, 7795–7818, 2004
Aerosol particles in the mexican east
pacific part I J. C. Jim ´enez et al.
Title Page Abstract Introduction Conclusions References Tables Figures J I J I Back Close
Full Screen / Esc
Print Version Interactive Discussion
EGU transfering mass from the lower to upper size range of the PSD. The increase in volume
at sizes larger than 1 µm in Fig. 3a is likely a result of this mechanism; however, uptake of SO2as well as the scavenging of unactivated AP by cloud droplets will produce AP with larger masses (Hobbs, 1993)
Precipitation is a cloud processing mechanism that removes AP from the atmosphere 5
(Flossman et al., 1985). Super-micron AP will be the first activated as they are trans-ported from cloud base, i.e. at lower supersaturations, and are the first to grow to precipitable sizes. The near cloud PSD shown in Fig. 3b has no particles larger than 5 µm whereas the cloud base PSD contains particles as large as 20 µm. This is evi-dence that precipitation has already removed most of the super-micron particles by the 10
time this region of the cloud boundary was measured.
The fourth type of cloud processing pattern is shown in Fig. 3c where the near cloud PSD has virtually the same shape as that at the cloud base, but the concentration at all sizes is smaller by approximately the same fraction. This condition will occur when the ambient air that mixes with the cloudy air has much lower concentrations than cloud 15
base air and the sizes of the cloud base AP have been changed very little by any of the other cloud processing mechanisms.
3. Results
Cloud systems were selected for analysis based on the size of the clouds, their con-tinuity and an inspection of the visual records made with the forward and side-looking 20
video cameras on the aircraft. The acceptance criterion required that cloud lines were isolated from adjoining clouds by no less than 10 km so that far-cloud samples would represent “ambient” AP, i.e. no recently processed particles by clouds. The flights were also classified by AP origin, i.e. continental or maritime. On the days of Flights 7 and 17 the average CN concentrations were significantly higher than the 25
other three flights selected for the analysis (Table 2). This indicates the influence of northerly or easterly winds that bring anthropogenic particles from southern Mexico
ACPD
4, 7795–7818, 2004
Aerosol particles in the mexican east
pacific part I J. C. Jim ´enez et al.
Title Page Abstract Introduction Conclusions References Tables Figures J I J I Back Close
Full Screen / Esc
Print Version Interactive Discussion
EGU or northern Central America. Flights 9, 12 and 13 were made on days with
mar-itime AP background when winds were from the southwest. Additional confirmation of air mass origin came from back trajectories calculated with the NOAA Hysplit model (http://www.arl.noaa.gov/ready/hysplit4.html). Table 2 summarizes the time of day, lo-cation and origin of the AP. The AP origin was determined from the average CN con-5
centration at cloud base. Cases when CN values were less than 500 were considered maritime.
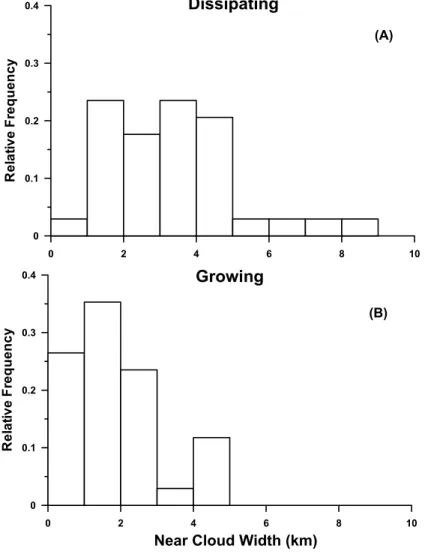
The size of the near cloud region was related to whether these regions were on a growing side of the cloud or the dissipating. Figure 4 shows the relative frequency of the size of near cloud regions. The dissipating regions were on average twice the size 10
of growing regions, with average widths of 4 km and 2 km, respectively.
Each of the near-cloud particle populations were categorized into one or more of the pattern types that were discussed in Sect. 2.4. The 300 m passes were not evaluated for evidence of dilution (Type 4). Multiple classifications are possible, for example the PSD used in the example of Fig. 3a contains both Type 1 and 2 patterns. Forty-eight 15
PSDs were evaluated on clean days and 30 on polluted days. The frequency with which the processing types occurred was evaluated according to altitude, AP origin and whether the near cloud region was on the growing or dissipating side. Table 3 summarizes these results.
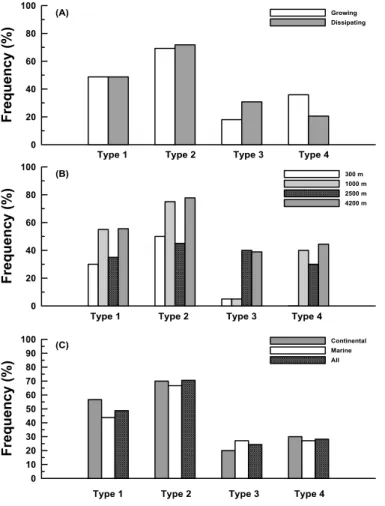
Figure 5 illustrates the frequency with respect to the different categories. The re-20
gion near the growing side of clouds had approximately twice the frequency of dilution processing than the dissipating side (Fig. 5a) whereas the removal of large particle was somewhat more frequent on the dissipating side. The enhanced concentrations of small and large particles (Types 1 and 2) and dilution (Type 4) was most frequently found at 1000 m and 4200 m (Fig. 5b). On the other hand, large particle removal was 25
seldom found at 300 and 1000 m, but was found in 40% of the cases at both 2500 m and 4200 m.
There were very small differences in the frequency of processing types when strat-ified by AP origin (Fig. 5c). The enhanced concentration of small and large particles
ACPD
4, 7795–7818, 2004
Aerosol particles in the mexican east
pacific part I J. C. Jim ´enez et al.
Title Page Abstract Introduction Conclusions References Tables Figures J I J I Back Close
Full Screen / Esc
Print Version Interactive Discussion
EGU was somewhat more likely for those cases involving continental particles. Large
parti-cle removal was more frequent in maritime air masses. In summary, of the 78 cases analyzed, regardless of altitude, AP origin, growth or dissipation, 71% showed en-hancement in volume of super-micron particles, 49% had enhanced volumes of sub-micron particles, 24% had super-sub-micron particles removed by precipitation and 28% of 5
the size distributions were classified as homogeneous mixing with boundary layer air.
4. Discussion
The 78 near cloud PSDs were classified unambiguously with one or more of the cloud processing types. The dissipating side of clouds was generally two or more times wider than the growing side but the frequency of cloud processing type appears to have little 10
sensitivity to this characteristic of the near cloud region.
The observations are in general accordance with results from previous observational (Hegg and Hobbs, 1981, 1982) and theoretical studies showing that cloud processing generally shifts the size distribution of boundary layer AP to larger sizes (Flossmann et al., 1985; Flossmann, 1998) by the combined processes of SO2uptake and sulfate par-15
ticle scavenging. Over 70% of the near cloud PSDs showed enhanced concentrations of super-micron sizes and almost 50% had experienced enhancement of sub-micron sizes. The far cloud environments were always lower in AP concentrations than the cloud base AP, suggesting that the enhancement in mass is only a result of aqueous phase chemistry, coalescence, or scavenging, and not interactions with a layer of AP 20
that was advected from a different source than the cloud base AP.
A further evaluation of the frequency of sub and super-micron volume enhancement showed that the enhancement in sub-micron particle volume almost never occurred without enhancement in the super-micron particle volume. This is in qualitative agree-ment with modeling studies (Flossman et al., 1987; Alfonso and Raga, 2002) that 25
showed that the scavenging of SO2 by small water droplets and subsequent conver-sion to sulfate increases the mass of the AP cloud nuclei. In addition, larger water
ACPD
4, 7795–7818, 2004
Aerosol particles in the mexican east
pacific part I J. C. Jim ´enez et al.
Title Page Abstract Introduction Conclusions References Tables Figures J I J I Back Close
Full Screen / Esc
Print Version Interactive Discussion
EGU droplets have more sulfate in them as a result of the scavenging of SO2and the
coa-lescence by smaller droplets into larger ones. The results of Flossmann et al. (1987) also showed that the size distribution of the aerosol particles that remained after the cloud evaporated had shifted to larger sizes than found in the cloud base PSD. This theoretical result is supported by the observational results from this study, as shown in 5
the example of Type 1 and 2 particles (Fig. 3a).
The composition of the AP was not measured in the EPIC observations, but the enhancement in mass can be estimated from the measured size distributions by con-verting the volume concentrations to mass distributions and assuming that the particles are ammonium sulfate.
10
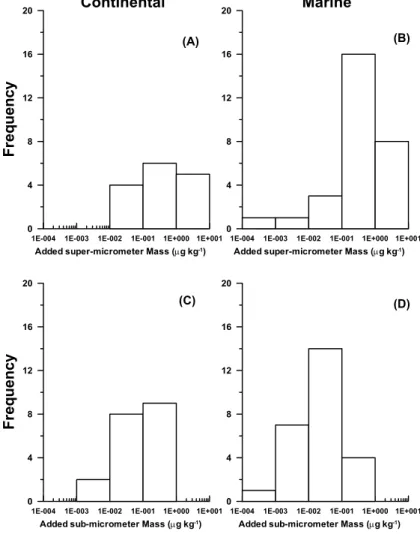
Figures 5a–d show frequency diagrams of the difference in particle mass concen-tration between the near cloud regions and the 300 m environment for sub and super-micron particles, stratified by particle origin. The mass concentration is expressed as a mixing ratio in order to remove the effect of changes in air density with altitude and in order to compare with the modeling results. As observed in Figs. 5a and b, the days 15
with air of marine origin generally had more mass added to the super-micron parti-cles than those of continental origin. The opposite is the case for sub-micron partiparti-cles that show a slightly higher frequency of mass increase for continental particles. The average increase in mass for sub-micron particles is 0.13 µg kg−1for particles with con-tinental origin and 0.05 µg kg−1 for the marine case. The average increases in mass 20
for super-micron particles is 1.8 µg kg−1 and 4 µg kg−1 for the continental and marine cases, respectively.
The total, estimated enhancement in sulfate mass of 2 to 4 µg kg−1is consistent with previous observations and modeling predictions. Measurements of sulfate upwind and downwind of wave clouds over the state of Washington showed enhancements of up to 25
10 µg kg−1(Hegg and Hobbs, 1981). Estimates were made of enhancements from sul-fate measurements of cloud droplets over the Los Angeles Basin and Western Wash-ington State. Sulfate in excess of ambient values ranged from 0.15–29 µg kg−1. The largest excesses were found in the stratiform clouds over Western Washington State.
ACPD
4, 7795–7818, 2004
Aerosol particles in the mexican east
pacific part I J. C. Jim ´enez et al.
Title Page Abstract Introduction Conclusions References Tables Figures J I J I Back Close
Full Screen / Esc
Print Version Interactive Discussion
EGU It was speculated that the long lifetimes of these clouds permitted significant uptake of
SO2 that was subsequently converted to sulfate. The Flossmann et al. model (1987) predicted that sulfate in cloud drops could increase from 0 to 4 µg kg−1, depending upon the assumed scavenging rate of AP by cloud droplets, conversion rates of SO2 to sulfate in the droplets, and the amount of time in cloud. The factor of two differences 5
in mass enhancement of sub-micron particles for the continental and marine cases suggests that the air masses of continental origin probably have higher concentrations of SO2 that lead to more uptake for these AP in clouds. The factor of two differences in the enhancement of super-micron particle mass indicates the possibility that more coalescence is happening in the marine clouds. Higher concentrations of continental 10
AP lead to higher concentrations of cloud droplets with smaller average diameters and lower probability of coalescence (Twomy, 1974).
5. Summary and conclusions
In situ measurements of aerosol particles in regions around convective clouds within the Mexican ITCZ allow the identification of four types of cloud processing. The most 15
frequent processing mechanism was mass enhancement of sub and super-micron par-ticles, presumably by SO2 and sulfate particle scavenging. The average increase in mass, estimated from comparisons of far and near cloud size distributions, is consis-tent with theoretical predictions for marine convective clouds. The comparison of mass enhancements of AP from continental and maritime origins suggest that coalescence 20
in maritime clouds dominates the total enhancement of mass in cloud processed AP. Cloud processed particles, with increased mass after evaporation, will interact with the environment differently than they would have prior to their transformation. Redistri-bution and growth to larger sizes will lead to particles that activate at lower supersatura-tions and grow more quickly to precipitable sizes (Flossmann, 1998). Larger particles 25
scatter light more efficiently and will increase the optical extinction in near-cloud re-gions. Both of these effects have important climatological ramifications and are the
ACPD
4, 7795–7818, 2004
Aerosol particles in the mexican east
pacific part I J. C. Jim ´enez et al.
Title Page Abstract Introduction Conclusions References Tables Figures J I J I Back Close
Full Screen / Esc
Print Version Interactive Discussion
EGU focus of ongoing studies.
Acknowledgements. The authors are grateful to D. Raymond for enabling UNAM’s participation
in EPIC2001. Thanks to the technical staff and crew of the NCAR C-130. The study was funded through CONACYT grant # 33319 and UNAM-DGAPA.
References
5
Alfonso, L. and Raga, G. B.: Estimating the impact of natural and anthropogenic emissions on cloud chemistry Part I. Sulfur cycle, Atmos. Res., 62, 33–55, 2002.
Baumgardner, D. and Clarke, A.: Changes in aerosol properties with relative humidity in the remote southern hemisphere marine boundary layer, J. Geophys. Res., 103, 16 525–16 534, 1998.
10
Baumgardner, D. and Spowart, M.: Evaluation of the forward scattering spectrometer probe: Part III, Time response and laser inhomogeneity limitations, J. Atmos. Oceanic Tech, 7, 666– 672, 1990.
Baumgardner, D., Strapp, J. W., and Dye, J. E.:. Evaluation of the forward scattering spectrom-eter probe: Part II, Corrections for coincidence and dead-time losses, J. Atmos. Oceanic
15
Tech, 2, 626–632, 1985.
Baumgardner, D., Huebert, B., and Wilson, C.: Meeting Review: Airborne aerosol inlet work-shop, NCAR Tech. Note TN-362+1A, 288, 1991.
Baumgardner, D., Dye, J. E., Knollenberg, R. G., and Gandrud, B. W.: Interpretation of mea-surements made by the FSSP-300X during the Airborne Arctic Stratospheric Expedition, J.
20
Geophys. Res., 97, 8035–8046, 1992.
Bond, T. C., Anderson, T. L., and Cambell, D.: Calibration and intercomparison of filter-based measurements of visible light absorption by aerosols, Aerosol Sci. Tech., 30, 582–600, 1999.
DeFelice, T. P. and Cheng, R. J.: On the phenomenon of nuclei enhancement during the
evap-25
orative stage of a cloud, Atmos. Res., 47–48, 15–40, 1998.
Flossmann, A. I.: Interaction of Aerosol Particles and Clouds, J. Atmos. Sci., 55, 879–887, 1998.
Flossmann, A. I. and Pruppacher, H. R.: A theoretical study of the wet removal of atmospheric pollutants. Part III: The uptake, redistribution, and deposition of NH42SO4 particles by a
ACPD
4, 7795–7818, 2004
Aerosol particles in the mexican east
pacific part I J. C. Jim ´enez et al.
Title Page Abstract Introduction Conclusions References Tables Figures J I J I Back Close
Full Screen / Esc
Print Version Interactive Discussion
EGU
convective cloud using a two-dimensional cloud dynamics model, J. Atmos. Sci., 45, 1857– 1871, 1988.
Flossmann, A. I., Hall, W. H., and Pruppacher, H. R.: A theoretical study of the wet removal of atmospheric pollutants, Part I: The redistribution of aerosol particles captured through nucleation and impaction scavenging by growing cloud drops, J. Atmos. Sci., 42, 583–606,
5
1985.
Flossmann, A. I., Pruppacher, H. R., and Topalian, J. H.: A theoretical study of the wet removal of atmospheric pollutants, Part II: The uptake and redistribution of NH42SO4 particles and
SO2gas simultaneously scavenged by growing cloud drops, J. Atmos. Sci., 44, 2912–2923,
1987.
10
Hegg, D. A. and Hobbs, P. V.: Cloud water chemistry and the production of sulfate in clouds, Atmos. Envir., 15, 1597–1604, 1981.
Hegg, D. A. and Hobbs, P. V.: Measurements of sulfate production in atmospheric clouds, Atmos. Envir., 16, 2663–2668, 1982.
Kaneyasu, N., Hobbs, P. V., Isjizaka, Y., and Quian, G. W.: Aerosol properties around marine
15
tropical cumulus clouds, J. Geophys. Res., 106, 14 435–14 445, 2001.
Kim, Y. J. and Boatman, J. F.: The effects that the optical properties of particles have on atmospheric aerosol measurements with optical particle spectrometers, J. Aerosol Sci., 21, Supp. 1, S551–S554, 1990.
O’Dowd, C. D., Lowe, J. A., and Smith, M. H.: The effect of clouds on aerosol growth in the
20
rural atmosphere, Atmos. Res., 54, 201–221, 2000.
Raga, G. B. and Jonas, P. R.: Microphysical and radiative properties of small cumulus clouds over the sea, Quart. J. Royal Meteor. Soc., 119, 1399–1417, 1993a.
Raga, G. B. and Jonas, P. R.: On the link between cloud-top radiative properties and sub-cloud aerosol concentrations, Quart. J. Royal Meteor. Soc., 119, 1419–1425, 1993b.
25
Raymond, D. J., Esbensen, S. K., Paulson, C., Gregg, M., Bretherton, C. S., Petersen, W. A., Cifelli, R., Shay, L. K., Ohlmann, C., and Zuidema, P.: EPIC2001 and the Coupled OceanAt-mosphere System of the Tropical East Pacific, Bulletin of the American Meteorological Soci-ety, 85, 9, 1341–1354, 2004.
Saxena, V. K., Burford, J. N., and Kassner Jr., J. L.: Operation of a Thermal Diffusion Chamber
30
for Measurements on Cloud Condensation Nuclei, J. Atmos. Sci., 27, 73–80, 1970.
Strapp, J. W., Leaitch, W. R., and Liu, P. S. K.: Hydrated and dried aerosol-size distribu-tion measurements from the particle measuringsystems FSSP-300 probe and the deiced
ACPD
4, 7795–7818, 2004
Aerosol particles in the mexican east
pacific part I J. C. Jim ´enez et al.
Title Page Abstract Introduction Conclusions References Tables Figures J I J I Back Close
Full Screen / Esc
Print Version Interactive Discussion
EGU
PSASP-100X probe, J. Atmos. Ocean. Tech., 9, 548–555, 1992.
Tang, I. N.: Chapter 7, Deliquescence Properties and Particle size change of Hygroscopic Aerosols, in Generation of Aerosols, de. Science Publishers, 153–167, 1980.
Twomey, S.: Pollution and the planetary albedo, Atmos. Envir., 8, 1251–1256, 1974. Twomey, S.: Aerosols Clouds and Radiation, Atmos. Envir., 25A, 2435–2442, 1991.
5
Weller, B., Albrecht, B., Esbensen, S., Eriksen, C., Kumar, A., Mechoso, R., Raymond, D., Rogers, D., and Rudnick, D.: A science and implementation plan for EPIC: An eastern Pacific
investigation of climate processes in the coupled ocean-atmosphere system, http://www.
ACPD
4, 7795–7818, 2004
Aerosol particles in the mexican east
pacific part I J. C. Jim ´enez et al.
Title Page Abstract Introduction Conclusions References Tables Figures J I J I Back Close
Full Screen / Esc
Print Version Interactive Discussion
EGU
Table 1. AP and Cloud Particle Instrumentation on the C130 Aircraft.
Instrument type Parameter Range Accuracy
CN counter Number concentration 0.01 to >3 µm Varies with concentration,
TSI Model 3760 of aerosol to 2×104 cm−3 about 6% at 3300 cm−3
PCASP Size spectra 0.12 to 3.0 µm ±20% Diameter
of aerosols 30 channels1 ±16% Concentration
FSSP-300 Size spectra 0.3 to 20 µm ±20% Diameter
of aerosols 30 channels1 ±16% Concentration
FSSP-100 Size spectra of aerosols 2 to 47 µm ±20% Diameter
and cloud droplets 40 channels1 ±16% Concentration
CCN Counter Number concentration 0.2 to 1.0% 10% at 1%
of CCN supersaturation supersaturation
Particle soot/ Light-Absorption 10−7to ±5%
absorption Coefficient 10−2m−1
photometer PSAP
Nephelometer Light-scattering 1.0×10⁻⁷ ±5%
M903 Coefficient to 10×10−3m−1
1
The PCASP, FSSP-100 and FSSP-300 have had their original electronics replace with the sig-nal processing package (SPP) of Droplet Measurement Technologies that improves response time, eliminates dead-time and increases the number of size channels.
ACPD
4, 7795–7818, 2004
Aerosol particles in the mexican east
pacific part I J. C. Jim ´enez et al.
Title Page Abstract Introduction Conclusions References Tables Figures J I J I Back Close
Full Screen / Esc
Print Version Interactive Discussion
EGU
Table 2. Characteristics of cloud systems selected for analysis.
Flight # Date Cloud Time Period Location Particle 300 m 300 m
2001 System UTC Source CN Conc. PCASP Conc.
cm−3 cm−3 7 16 Sept. 1 16:46–17:19 12.3◦N, 93.7◦W Continental 910 345 7 16 Sept. 2 18:42–20:12 11.9◦N, 95.2◦W Continental 830 227 9 20 Sept. 3 18:16–20:11 10.5◦N, 95.9◦W Marine 380 66 9 20 Sept. 4 18:56–20:24 8.2◦N, 95.8◦W Marine 200 40 12 28 Sept. 5 17:03–18:12 9.3◦N, 93.9◦W Marine 460 138 12 28 Sept. 6 19:14–20:20 11.9◦N, 94.1◦W Marine 420 143 13 29 Sept. 7 18:31–19:03 11.4◦N, 94.6◦W Marine 360 98 13 29 Sept. 8 19:36–20:22 12.4◦N, 94.9◦W Marine 390 64 17 6 Oct. 9 18:34–19:49 11.9◦N, 93.9◦W Continental 1900 696 17 6 Oct. 10 20:51–21:36 11.8◦N, 94.1◦W Continental 1600 510
ACPD
4, 7795–7818, 2004
Aerosol particles in the mexican east
pacific part I J. C. Jim ´enez et al.
Title Page Abstract Introduction Conclusions References Tables Figures J I J I Back Close
Full Screen / Esc
Print Version Interactive Discussion
EGU
Table 3. Frequency of cloud processed AP types. G= Growing side of cloud, D = Dissipating
side of cloud.
Case Type Altitude Number Sub-Micron Super-Micron Large Particle Dilution m of Cases Size Increase % Size Increase % Removal % %
G D G D G D G D G D Continental 300 4 4 0 0 75 0 0 25 0 0 1000 5 3 80 100 80 100 0 0 20 67 2500 6 2 50 100 50 100 0 100 33 50 4200 2 4 100 75 100 100 50 50 100 25 All continental 17 13 53 62 71 69 6 38 29 31 Marine 300 3 9 33 56 67 67 33 0 0 0 1000 7 5 57 60 86 100 14 0 43 40 2500 8 4 25 25 38 50 38 75 25 25 4200 4 8 75 25 100 50 25 50 100 13 All marine 22 26 45 42 68 65 27 27 41 15 Combined 300 7 13 14 38 71 46 14 8 0 0 1000 12 8 67 75 83 100 8 0 33 50 2500 14 6 36 50 43 67 21 83 29 33 4200 6 12 83 42 100 67 33 50 100 17 All altitudes 39 39 49 49 69 72 18 31 36 21 All conditions 78 49 71 24 28
ACPD
4, 7795–7818, 2004
Aerosol particles in the mexican east
pacific part I J. C. Jim ´enez et al.
Title Page Abstract Introduction Conclusions References Tables Figures J I J I Back Close
Full Screen / Esc
Print Version Interactive Discussion EGU 17
10°
0°
20°
100°
90°
Research area
Figure 1: EPIC-2001 research area during ITCZ flights.
Fig. 1. EPIC-2001 research area during ITCZ flights.ACPD
4, 7795–7818, 2004
Aerosol particles in the mexican east
pacific part I J. C. Jim ´enez et al.
Title Page Abstract Introduction Conclusions References Tables Figures J I J I Back Close
Full Screen / Esc
Print Version Interactive Discussion
EGU
Figure 2: This time series of equivalent potential temperature solid line and droplet
concentration dashed is an example in air near cloud boundaries defined as the FSSP100 droplet concentration >1cm-3. Air that has mixed with cloud is identified by potential temperature different than the environment 338 K in this example.
Fig. 2. This time series of equivalent potential temperature solid line and droplet concentration
dashed is an example in air near cloud boundaries defined as the FSSP100 droplet concentra-tion >1 cm−3. Air that has mixed with cloud is identified by potential temperature different than the environment 338 K in this example.
ACPD
4, 7795–7818, 2004
Aerosol particles in the mexican east
pacific part I J. C. Jim ´enez et al.
Title Page Abstract Introduction Conclusions References Tables Figures J I J I Back Close
Full Screen / Esc
Print Version Interactive Discussion
EGU
Figure 3: Size distributions illustrating cloud processing signatures: A Types1 and 2,
small particle and large particle enhancement, B Type 3, removal by precipitation, and C Type 4, dilution with minimal shape change.
Fig. 3. Size distributions illustrating cloud processing signatures: (A) Types 1 and 2, small
particle and large particle enhancement,(B) Type 3, removal by precipitation, and (C) Type 4,
dilution with minimal shape change.
ACPD
4, 7795–7818, 2004
Aerosol particles in the mexican east
pacific part I J. C. Jim ´enez et al.
Title Page Abstract Introduction Conclusions References Tables Figures J I J I Back Close
Full Screen / Esc
Print Version Interactive Discussion EGU 0 2 4 6 8 10 0 0.1 0.2 0.3 0.4 R e la ti v e Fr e que nc y 0 2 4 6 8 10 0 0.1 0.2 0.3 0.4 R e la ti v e Fr e que nc y
Near Cloud Width (km)
Growing Dissipating
(A)
(B)
Figure 4: The relative frequency of the width of near-cloud regions is shown for
those sides identified as dissipating A and growing B.
Fig. 4. The relative frequency of the width of near-cloud regions is shown for those sides
identified as dissipating(A) and growing (B).
ACPD
4, 7795–7818, 2004
Aerosol particles in the mexican east
pacific part I J. C. Jim ´enez et al.
Title Page Abstract Introduction Conclusions References Tables Figures J I J I Back Close
Full Screen / Esc
Print Version Interactive Discussion EGU 0 20 40 60 80 100 F requenc y (%) 300 m 1000 m 2500 m 4200 m 0 20 40 60 80 100 F requency (%) Growing Dissipating (B) (A)
Type 1 Type 2 Type 3 Type 4
Type 1 Type 2 Type 3 Type 4
0 10 20 30 40 50 60 70 80 90 100 F requency (%) Continental Marine All (C)
Type 1 Type 2 Type 3 Type 4
Figure 5: The frequency of different types of cloud processed AP are summarized here stratified by A growing or dissipating side of cloud, B altitude and C origin of the AP. The 300 m PSDs were not evaluated for type 4 cloud processing.
Fig. 5. The frequency of different types of cloud processed AP are summarized here stratified
by (A) growing or dissipating side of cloud, (B) altitude and (C) origin of the AP. The 300 m
PSDs were not evaluated for type 4 cloud processing.
ACPD
4, 7795–7818, 2004
Aerosol particles in the mexican east
pacific part I J. C. Jim ´enez et al.
Title Page Abstract Introduction Conclusions References Tables Figures J I J I Back Close
Full Screen / Esc
Print Version Interactive Discussion
EGU
1E-004 1E-003 1E-002 1E-001 1E+000 1E+001
Added sub-micrometer Mass (µg kg-1) 0 4 8 12 16 20 F req uen cy
1E-004 1E-003 1E-002 1E-001 1E+000 1E+001
Added super-micrometer Mass (µg kg-1) 0 4 8 12 16 20 F req uen cy
1E-004 1E-003 1E-002 1E-001 1E+000 1E+001
Added sub-micrometer Mass (µg kg-1) 0 4 8 12 16 20
1E-004 1E-003 1E-002 1E-001 1E+000 1E+001
Added super-micrometer Mass (µg kg-1) 0 4 8 12 16 20 Continental Marine (A) (B) (C) (D)
Figure 6 The frequency of occurrence of differences between near cloud and
cloud base AP mass is shown here stratified by air mass origin and particle size range.
Fig. 6. The frequency of occurrence of differences between near cloud and cloud base AP
mass is shown here stratified by air mass origin and particle size range.