HAL Id: hal-00303829
https://hal.archives-ouvertes.fr/hal-00303829
Submitted on 10 Jan 2006HAL is a multi-disciplinary open access
archive for the deposit and dissemination of sci-entific research documents, whether they are pub-lished or not. The documents may come from teaching and research institutions in France or abroad, or from public or private research centers.
L’archive ouverte pluridisciplinaire HAL, est destinée au dépôt et à la diffusion de documents scientifiques de niveau recherche, publiés ou non, émanant des établissements d’enseignement et de recherche français ou étrangers, des laboratoires publics ou privés.
Chemical composition of boundary layer aerosol over the
Atlantic Ocean and at an Antarctic site
A. Virkkula, K. Teinilä, R. Hillamo, V.-M. Kerminen, S. Saarikoski, M.
Aurela, J. Viidanoja, J. Paatero, I. K. Koponen, M. Kulmala
To cite this version:
A. Virkkula, K. Teinilä, R. Hillamo, V.-M. Kerminen, S. Saarikoski, et al.. Chemical composition of boundary layer aerosol over the Atlantic Ocean and at an Antarctic site. Atmospheric Chemistry and Physics Discussions, European Geosciences Union, 2006, 6 (1), pp.455-491. �hal-00303829�
ACPD
6, 455–491, 2006 Atlantic aerosol chemistry A. Virkkula et al. Title Page Abstract Introduction Conclusions References Tables Figures J I J I Back CloseFull Screen / Esc
Print Version
Interactive Discussion
EGU Atmos. Chem. Phys. Discuss., 6, 455–491, 2006
www.atmos-chem-phys.org/acpd/6/455/ SRef-ID: 1680-7375/acpd/2006-6-455 European Geosciences Union
Atmospheric Chemistry and Physics Discussions
Chemical composition of boundary layer
aerosol over the Atlantic Ocean and at an
Antarctic site
A. Virkkula1, K. Teinil ¨a1, R. Hillamo1, V.-M. Kerminen1, S. Saarikoski1, M. Aurela1, J. Viidanoja2, J. Paatero1, I. K. Koponen3, and M. Kulmala4
1
Finnish Meteorological Institute, Erik Palm ´enin aukio, 00 560, Helsinki, Finland 2
Department Department of Chemistry, Laboratory of Analytical Chemistry, University of Helsinki, 00 014 Helsinki, Finland
3
University of Copenhagen, Department of Chemistry, Universitetsparken 5, 2100 Copenhagen, Denmark
4
Department of Atmospheric Sciences, Aerosol and Environmental Physics Laboratory, University of Helsinki, 00 014 Helsinki, Finland
Received: 5 October 2005 – Accepted: 25 November 2005 – Published: 10 January 2006 Correspondence to: A. Virkkula ([email protected])
ACPD
6, 455–491, 2006 Atlantic aerosol chemistry A. Virkkula et al. Title Page Abstract Introduction Conclusions References Tables Figures J I J I Back CloseFull Screen / Esc
Print Version
Interactive Discussion
EGU
Abstract
Aerosol chemical composition was measured over the Atlantic Ocean in November– December 1999 and at the Finnish Antarctic research station Aboa in January 2000. The concentrations of all anthropogenic aerosol compounds decreased clearly from north to south. An anthropogenic influence was still evident in the middle of the
trop-5
ical South Atlantic, background values were reached south of Cape Town. Chemical mass balance was calculated for high volume filter samples (Dp<3 µm). North of the
equator 70–80% of the aerosol consisted of non-sea-salt species. The contribution of sea salt was ∼25% in the polluted latitudes, >80% in the Southern Ocean, and <10% at Aboa. The contribution of organic carbon was >10% in most samples, also at Aboa.
10
The correlation of biomass-burning-related aerosol components with 210Pb was very high compared with that between nss calcium and210Pb which suggests that210Pb is a better tracer for biomass burning than for Saharan dust. The ratio of the two clear tracers for biomass burning, nss potassium and oxalate, was different in European and in African samples, suggesting that this ratio could be used as an indicator of biomass
15
burning type. The concentrations of continent-related particles decreased exponen-tially with the distance from Africa. The shortest half-value distance, ∼100 km, was for nss calcium. The half-value distance of particles that are mainly in the submicron par-ticles was ∼700±200 km. The MSA to nss sulfate ratio, R, increased faster than MSA concentration with decreasing anthropogenic influence, indicating that the R increase
20
could largely be explained by the decrease of anthropogenic sulfate.
1. Introduction
Large amounts of man-made and natural aerosols are transported every year from the continents over the ocean (Lelieveld et al., 2001; Kaufman et al., 2002; Chiapello and Moulin, 2002). In the marine environment, these continentally-derived aerosols
influ-25
ACPD
6, 455–491, 2006 Atlantic aerosol chemistry A. Virkkula et al. Title Page Abstract Introduction Conclusions References Tables Figures J I J I Back CloseFull Screen / Esc
Print Version
Interactive Discussion
EGU modifying cloud properties (Ramanathan et al., 2001; Sekiguchi et al., 2003). Other
potential effects caused by these aerosols include perturbations in tropospheric chem-istry via different heterogenous pathways (Ravishankara, 1997; Seinfeld, 2000).
Over the Atlantic Ocean, the physical, chemical and optical character of aerosols have been measured in association with several short-term campaigns, e.g., TARFOX
5
(Russell et al., 1999), ACE-2 (Raes et al., 2000), with cruises across the ocean (Van Dingenen et al., 1995; Davison et al., 1996; Bates et al., 2001; Quinn et al., 2001; Leck et al., 2002), with long-term monitoring programs (e.g. Prospero, 1999) and with satellite data (Bergstrom and Russell, 1999; Chiapello and Moulin, 2002). The main features identified by these studies include the continual presence of pollution aerosols
10
associated with fossil-fuel combustion over most of the Northern Atlantic and the trans-port of Saharan dust across the Atlantic. Measurements over the southern parts of the ocean have been fewer and limited mainly to short cruises between the bordering continental areas.
In this work we present aerosol chemical data measured in November–December
15
1999 during a cruise over the Atlantic Ocean between the English Channel and the Antarctic coast, along with a corresponding data measured in January 2000 at the Finnish Antarctic research station Aboa (73◦030S, 13◦250W, 470 m a.s.l). The main purpose of the cruise was to transport cargo to several Antarctic research stations. The instruments that were to be used at Aboa were also used during the transport
20
cruise. The main results of the number size distribution measurements associated with these measurements were presented earlier by Koponen et al. (2002, 2003). The chemical composition of coarse particles was presented earlier by Niemi et al. (2005) who analyzed the high-volume samples taken between Europe and Antarctica using scannning electron microscopy coupled with an energy dispersive X-ray microanalyzer
25
(SEM/EDX). Virkkula et al. (2005) presented a detailed analysis of the chemical mass size distributions of various aerosol components. This paper presents the bulk chem-ical concentrations in one or two size fractions. The data from the Antarctic site are presented only as a last measurement point of the north-south data series. A detailed
ACPD
6, 455–491, 2006 Atlantic aerosol chemistry A. Virkkula et al. Title Page Abstract Introduction Conclusions References Tables Figures J I J I Back CloseFull Screen / Esc
Print Version
Interactive Discussion
EGU analysis of the Antarctic data will be presented in another paper.
2. Methods
2.1. Sampling
Samples for chemical analyses were taken using a high-volume sampler (HV), a virtual impactor (VI) that divides the sample in sub- and supermicron fractions, and a 12-stage
5
small-deposit-area low-pressure impactor (SDI) (Maenhaut et al., 1996). The sampling setup onboard the Akademik Fedorov and at Aboa were described also by Koponen et al. (2002, 2003) and Virkkula et al. (2005). On the ship sample air was taken from 1.5 m above the bridge and the sample air was led through stainless steel and conductive flexible tubing. The total length of the inlet tubes was 10 m. The tube diameter was
10
50 mm for the HV sampler and 25 mm for the VI and the SDI. Above the bridge there were two positions for the inlets. The inlets were attached on the side railing at the uppermost deck of the ship. Depending on the wind relative direction, the sample was taken from the clean side of the ship or switched off in case of wind from the back of the ship. The HV sampling was continued, however, even when the wind came from
15
the back of the ship. This was because the main reason for taking the HV samples was for the analysis of210Pb, a tracer for continental air and it is not released by the ship emissions. However, the HV samples were later analyzed for other chemical species as well. One HV sample was contaminated and it was not used for the statistics of species that could be emitted by the ship, such as sulfate, organic and elemental carbon.
20
The SDI and the VI had a common inlet both on the ship and at Aboa. On the ship the diameter for 50% transmission efficiency (D50) was approximately 10 µm. The size distribution analyses (Virkkula et al., 2005) suggest that during strong winds the cutoff was probably lower, approximately 7–8 µm. At Aboa an inlet with a D50>20 µm was
used. The HV had a separate inlet that was used both on the ship and at Aboa. The
25
ACPD
6, 455–491, 2006 Atlantic aerosol chemistry A. Virkkula et al. Title Page Abstract Introduction Conclusions References Tables Figures J I J I Back CloseFull Screen / Esc
Print Version
Interactive Discussion
EGU given by Brockman (1993). The inlet transmission efficiency depends on wind speed.
The average (± standard deviation) wind speed at the inlet was 11±6 m s−1during the cruise. The respective D50 of the combined inlet and sample line was 3.4±0.5 µm, taking aspiration and inertial losses in the inlet and sample line losses into account. The D50 of the HV sampler was also determined by comparing sodium concentrations
5
measured using both the SDI and the HV. The sodium concentrations analyzed from the multistage impactor were added stage by stage starting from the smallest stage and the average ± standard deviation diameter where the cumulative concentration equaled the sodium concentration on the HV samples was 3.0±1.2 µm. At Aboa the average wind speed was 8±5 m s−1 and the respective D50 of the combined HV inlet
10
and sample line was 3.8±0.4 µm.
On the ship the sample line was two meters inside the laboratory where it got heated due to the temperature difference between the outdoor and laboratory air. Due to the temperature increase relative humidity dropped. There was no heater for the sam-ple line and the heating was not controlled. Temperature and relative humidity of the
15
sample air were monitored at the end of the sample line in the laboratory room. The average relative humidity in the sample line in the laboratory was 40±15%. At Aboa the inlets were placed 2.5 m above the container roof which was about 3 m above the ground. Inside the laboratory container the SDI and VI sample line was 2 m long and the HV sample line 1 m long. Both on the ship and at Aboa the main flow 30 LPM (liters
20
per minute) of the sample line where the VI and the SDI were attached was produced by the flow to a nephelometer at the end of the sampling line. As on the ship rela-tive humidity dropped due to the temperature difference of the outdoor and indoor air. Temperature and relative humidity of the sample air were monitored at the end of the sample line in the laboratory container. At Aboa the average relative humidity in the
25
sample line in the laboratory was 10±3%.
The VI flow rate was 16.7 l min−1(LPM) and the sampling time 24 h and 48 h on the ship and at Aboa, respectively. Teflon (Fluoropore, 47 mm, 3 µm pore size) was used as filter material both for the fine (Dp<1.3 µm) and coarse (Dp>1.3 µm) size ranges. After
ACPD
6, 455–491, 2006 Atlantic aerosol chemistry A. Virkkula et al. Title Page Abstract Introduction Conclusions References Tables Figures J I J I Back CloseFull Screen / Esc
Print Version
Interactive Discussion
EGU sampling the filters were stored in Petri slides and kept in a freezer until the analyses.
The SDI flow rate was 11 LPM. Polycarbonate films (Nuclepore, poreless, 10 µm thick) were used as particle impaction substrates. The films were coated with Apiezon L vacuum grease to reduce the bounce-off of particles. The sampling time of the SDI was changed during the cruise. When the ship was in the more polluted part of the
5
cruise a 24-h sampling time was considered sufficient for collecting samples above the detection limit on all stages. In the cleaner areas the sampling time was doubled to get enough sample material on all stages. The D50 values of the SDI stages are 0.045, 0.086, 0.15, 0.23, 0.34, 0.59, 0.80, 1.06, 1.66, 2.68, 4.08, and 8.5 µm. The upper range of the highest stage is determined by the inlet. After sampling the samples were
10
stored in clean vials and kept in a freezer until the analyses.
The HV flow rate was 120 m3h−1, the sampling time was 24 h, and the air was sam-pled on quartz fibre filters (Munktell MK 360, diameter 240 mm). The main purpose of the HV samples was to be analyzed for 210Pb. However, the quartz filters were pre-heated at 650◦C before the campaign in order to make analyses for elemental and
15
organic carbon possible. The HV filters were kept in clean zip-lock bags before and after sampling. After the sampling the filters were deep frozen. The zip-lock bags were made of plastic that may affect the organic carbon analyses. However, this was taken into account by subtracting the average blank concentration from the analyzed organic carbon in the actual samples.
20
Field blank samples were obtained by loading clean filters in the samplers, keeping them there for 5 min and packing them exactly like the actual samples. This procedure was done both onboard Akademik Fedorov and at Aboa. There were 28, 9, 5 field blanks for the SDI, VI and HV during the cruise, respectively, and 9, 9, and 4 at Aboa, respectively. For the HV samples the concentrations were analyzed from 3 pieces
25
from each filter sample, as will be explained below, so the HV blank averages were calculated from 15 analyses from the cruise, and the Antarctic average blanks were calculated from 12 analyses.
ACPD
6, 455–491, 2006 Atlantic aerosol chemistry A. Virkkula et al. Title Page Abstract Introduction Conclusions References Tables Figures J I J I Back CloseFull Screen / Esc
Print Version
Interactive Discussion
EGU 2.2. Chemical analyses
All samples were analyzed for major inorganic and some organic ions using two Dionex-500 ion chromatography systems. Anions were analyzed using an AG11 guard column and an AS11 analytical column with chemical suppression. The eluent for an-ion analysis was 0.4–30 mM NaOH solutan-ion. Catan-ions were analysed using a CG12A
5
guard column and a CS12A analytical column with electrochemical suppression. The eluent for cation analysis was 25 mM methanesulphonic acid. The analyzed ions were Na+, NH+4, K+, Mg2+, Ca2+, Cl−, NO−3, SO2−4 , MSA− (CH3SO−3), oxalate, acetate, suc-cinate, formate, and malonate. Sea salt concentrations were calculated as Sea salt= Cl−+1.47·Na+ where 1.47 is the mass ratio of (Na++K++Mg2++Ca2++SO2−4 +HCO−3)
10
to Na+ in sea water (Bates et al., 2001; Quinn et al., 2001). The non-sea-salt con-centrations of potassium, magnesium, calcium, and sulfate were calculated from nss K+=K+–0.038·Na+, nss Mg2+=Mg2+–0.12·Na+, nss Ca2+=Ca2+–0.038·Na+ and nss SO2−4 =SO2−4 –0.25·Na+. Sodium was thus used as the sea-salt tracer. Other possible tracers would be Cl− or Mg2+. In atmospheric aerosols chloride is usually depleted
15
due to reactions of sea salt with some acidic compound, such as sulfuric or nitric acid. Therefore chloride is not a suitable tracer. Magnesium would be a good tracer over the ocean but since its concentration in sea salt is about 12% of the sodium concentration, its absolute concentration is low especially in Antarctic aerosols and relative analyti-cal precision would result in higher uncertainties of non-seasalt concentrations. In the
20
Antarctica the use of sodium as the sea-salt tracer has one disadvantage, though. On the surface of sea ice frost flowers are formed and at temperatures below −8◦C sodium sulfate in the frost flowers begins to precipitate out (e.g., Rankin et al., 2002). Wind blowing over the ice may then generate aerosols in which sodium sulfate is depleted compared with sea water. Using sodium as the sea-salt tracer may then result in
neg-25
ative nss sulfate concentrations (e.g., Wagenbach et al., 1998). However, our samples were taken in Antarctic summer and temperatures were mainly above −8◦C. Further, the mechanism is most likely to take place only in the presence of sea ice surfaces
ACPD
6, 455–491, 2006 Atlantic aerosol chemistry A. Virkkula et al. Title Page Abstract Introduction Conclusions References Tables Figures J I J I Back CloseFull Screen / Esc
Print Version
Interactive Discussion
EGU (e.g., Minikin et al., 1998). Therefore this effect is assumed to be negligble in this work.
The radioactive noble gas radon-222 (222Rn) emanating from the Earth’s crust is often used as a tracer for continental air (e.g., Samuelsson et al., 1986 and references therein). Lead-210 (210Pb) is formed in the atmosphere from222Rn and thus also210Pb can be used as a tracer for continental air masses. The exposed HV filters together with
5
field blanks were assayed for210Pb with an automatic alpha/beta analyser (Mattsson et al., 1996). The detection limit for210Pb depends on the counting time and air volume but is usually about 10 µBq m−3.
The HV filters were first analyzed for210Pb activity concentration. After that 1.5 cm2 filter pieces were cut and analyzed for ions using ion chromatography and for
elemen-10
tal and organic carbon (EC and OC) using a thermal-optical analyser (Birch and Cary, 1996). For the analysis of organic carbon the analyzer heats the sample in four con-secutive temperature steps that result in organic carbon peaks OC1, OC2, OC3, and OC4. There were no denuders nor a backup filter that could be used to estimate the well-know positive artifact of the OC sampling. It may be assumed that OC1 consists
15
both of aerosols and adsorbed gaseous organics and that the rest of the OC (OC2-4) is in the aerosol phase (Kirchstetter et al., 2001; Putaud et al., 2000). In order to es-timate the particulate organic mass (POM), including O and H, the OC concentrations obtained from the OC/EC analyzer have to be multiplied by a OC-to-POM conversion factor. In the literature several values have been used for this factor. For instance Hegg
20
et al. (1997) and Putaud et al. (1999) used 1.7 and Turpin and Lim (2001) estimated that the value is 1.6 for urban and 2.1 for nonurban aerosols. Using FTIR spectroscopy Russell (2003) obtained a mean conversion factor just below 1.4 by analyzing samples taken in northeastern Asia and the Caribbean. In this work 1.4 has been used. POM1, POM2, POM3, POM4, and POM2-4 are the POMs that correspond to OC1, OC2, OC3,
25
OC4, and OC2-4.
The field blank filters were analyzed for the same species as the samples. The blank atmospheric concentrations presented in Table 1 were calculated by dividing the HV, VI and SDI blank filter concentrations by the volume drawn through the sampler in 24 h
ACPD
6, 455–491, 2006 Atlantic aerosol chemistry A. Virkkula et al. Title Page Abstract Introduction Conclusions References Tables Figures J I J I Back CloseFull Screen / Esc
Print Version
Interactive Discussion
EGU with the flowrates, 120 m3h−1, 16.7 LPM, and 11 LPM, respectively. For the marine
samples the average cruise field blank concentrations and for the Antarctic samples the average Aboa blank concentrations were subtracted from the analyzed concentrations. Chemical mass balance was calculated for the HV samples because only they were analyzed both for the ionic compounds and OC and EC. The chemical mass
con-5
centration was calculated by summing the concentrations of nss-SO2−4 , NH+4, nss-K+, nss-Mg2+, NO−3, sea salt, crustal mass, the analyzed organic ions, EC and POM. Only POM2-4 is used for the mass balance. The concentration of crustal mass was cal-culated from nss-Ca2+×(1+ΣRcrust
i )≈27.46×nss-Ca 2+
, where Rcrusti =Xi/Ca is the ratio of concentration of element Xi to Ca concentration in the average crustal composition
10
presented by Mason (1966). 2.3. Other instruments
Particle number size distributions were measured using a Twin-DMPS system, as de-scribed in detail by Koponen et al. (2002, 2003). Black carbon (BC) concentration was measured using an Aethalometer (Magee Scientific, AE-10). The Aethalometer
15
measured only submicron aerosol, there was a preimpactor that removed supermicron particles. Aerosol optical depth (AOD) was measured during cloud-free conditions us-ing a portable Microtops II sunphotometer (Solar Light Co. Inc.).
2.4. Weather data and backtrajectories
Data on wind speed and direction, temperature, pressure, and relative humidity were
20
obtained from the ship’s weather sensors. At Aboa weather data were obtained from the wind mast placed on the roof of the laboratory container. To analyze transport routes of air masses, backtrajectories were calculated using the NOAA HYSPLIT4 tra-jectory model (Draxler and Hess, 1997, 1998). The meteorological input data were from the NOAA FNL archives.
ACPD
6, 455–491, 2006 Atlantic aerosol chemistry A. Virkkula et al. Title Page Abstract Introduction Conclusions References Tables Figures J I J I Back CloseFull Screen / Esc
Print Version
Interactive Discussion
EGU
3. Results and discussion
3.1. Overview of the expedition
The cruise route and associated 5-day backtrajectories were presented by Koponen et al. (2003), Niemi et al. (2005), and Virkkula et al. (2005). The cruise started from Bremerhaven, Germany, but air sampling was started in the English Channel on 8
5
November 1999. On 25 November the ship arrived at Cape Town from where the cruise continued on 1 December and arrived at the Antarctic coast on 8 December 1999. The instruments were packed and transported to Aboa, where the laboratory was set up and the measurements were continued with the same set of instruments from 6 to 20 January 2000.
10
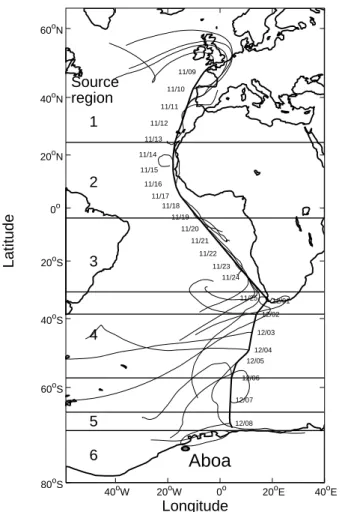
The cruise was divided into five regions according to the location of the ship and back-trajectories calculated using the NOAA HYSPLIT4 model (Draxler and Hess, 1997, 1998) and the meteorological input data from the NOAA FNL archives (Fig. 1). Region 1 (Lat>24.55◦) was influenced by European air and region 2 (24.55◦>Lat>–
3.82◦, with values <0 indicating latitudes in the southern hemisphere) was influenced
15
by Saharan dust and biomass burning (Niemi et al., 2005). In region 3 (−3.82◦>Lat>–
31.04◦) the backtrajectories came from central and southern Africa and from the mid-dle of the Atlantic Ocean. Region 4 (−38.56◦>Lat>−57.52◦) was between Cape Town and the Antarctic pack ice. Region 5 represented pack ice (−66◦>Lat>−70.10◦), even though it consisted only of one sample and thus no statistical conclusions can be
20
drawn. The samples taken at Aboa were classified to region 6. 3.2. Concentrations and comparison with other published data 3.2.1. Ions
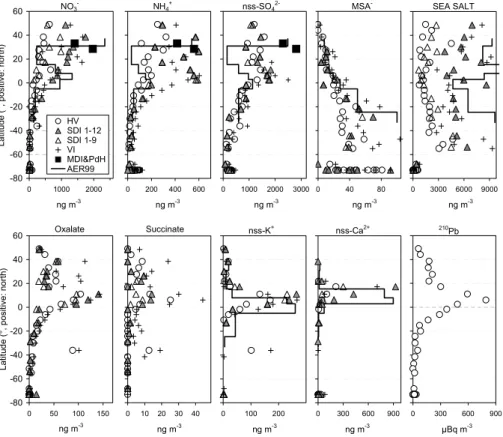
The concentrations of selected ions analyzed from the filter and impactor samples are plotted in Fig. 2. For the SDI the sum of concentrations on each impactor stage and
ACPD
6, 455–491, 2006 Atlantic aerosol chemistry A. Virkkula et al. Title Page Abstract Introduction Conclusions References Tables Figures J I J I Back CloseFull Screen / Esc
Print Version
Interactive Discussion
EGU for the VI the sum of fine and coarse filters are shown. For the SDI also the sum of
concentrations on stages 1–9, i.e., of particles with Dp<2.7 µm are presented for the
comparison with the HV samples. The concentrations of some species are compared with other published data. Ion, elemental and organic carbon concentrations were measured during an oceanographic cruise, Aerosols99, from the US to Cape Town in
5
January–February 1999 (Bates et al., 2001; Quinn et al., 2001). The sub and super-micron data presented by Quinn et al. (2001) were summed for total concentration and plotted as continuous lines in Fig. 2. The latitudes for these data are the limits of the meteorological regimes as presented by Quinn et al. (2001). The other comparison data are the average wintertime polluted aerosol concentrations measured at Punta
10
del Hidalgo, Tenerife (PdH) and at Madeira Island (MDI) as part of the LONGTERM subproject of ACE-2. The LONGTERM data is based on high volume samples taken using an inlet with a 10 µm cutoff diameter from 1995 to 1998 (Nu˜nes, 2002).
The VI and SDI were compared by dividing the sum of the two stages of the VI by the sum of the 12 stages of the SDI. For sea-salt the average ratio was 1.0±0.2, i.e., in
15
general the two instruments agreed within about 20%. For ions that have gaseous pre-cursors in the atmosphere the ratio varied more, in general so that the concentrations were higher in the VI. Explanations may be that gas-phase precursors reacted with the particles collected on the filter or that evaporation from the low-pressure impactor. The agreement between the HV and the SDI was best for compounds that exist mainly in
20
small particles, such as nss sulfate. Ammonium exists mainly in the small particles and therefore it is not quite clear why the concentrations in the HV samples were clearly lower than in the other two samplers.
The concentrations of nitrate, ammonium, and nss sulfate decreased almost mono-tonically from north to south (Fig. 2). In region 1 nitrate and ammonium
concentra-25
tions were close to the average wintertime polluted aerosol concentrations measured at Tenerife (PdH) and at Madeira (MDI) and also comparable with the North American air mass during Aerosols99. The concentation of nss sulfate was lower. There was a peak in nss sulfate and ammonium concentrations in region 2 close to the North
ACPD
6, 455–491, 2006 Atlantic aerosol chemistry A. Virkkula et al. Title Page Abstract Introduction Conclusions References Tables Figures J I J I Back CloseFull Screen / Esc
Print Version
Interactive Discussion
EGU African coast. The maximum concentrations of the ions that contribute less to the total
aerosol mass, namely oxalate, malonate, nss-potassium, and nss-calcium, were also observed in the same region, as were also the highest 210Pb activity concentrations. A small peak of all pollution-related ions was observed in the sample that was started when the ship left Cape Town.
5
The sea-salt concentrations were in general lower than during Aerosols99 (Quinn et al., 2001) and we never observed concentrations >9500 ng m−3 although wind speed occasionally exceeded 15 m s−1and whitecaps were present. During high wind speeds on the ocean there are always significant amounts of sea-salt particles with diameter
>10 µm (e.g., O’Dowd et al., 1997). These were not sampled due to the inlet cutoff.
10
3.2.2. Organic and elemental carbon
There was a clear north-south gradient in organic and elemental carbon concentra-tions (Fig. 3). In region 1 the EC concentraconcentra-tions were comparable with the aver-age wintertime polluted aerosol BC concentrations measured at PdH and MDI, 199 and 122 ng m−3, respectively (Nu ˜nes, 2002). The EC concentrations measured in
15
the polluted North American air masses during Aerosols99 were below detection limit 10 ng m−3 (Quinn et al., 2001), so this is a clear difference between the polluted air massses coming from Europe and North America. During our cruise EC concentration decreased to below 10 ng m−3 only south of 20◦S. The aethalometer data (BC) were averaged over the HV sampling periods for comparison with the EC. The BC
concen-20
trations were higher than the EC concentrations, linear regression for the samples with EC >10 ng m−3yields BC=1.25×EC+29 ng−3, R2=0.89. The difference may to a large extend be attributed to the mass absorption efficiency of 14 m2g−1that was used in the instrument but also to other effects, for instance the response of filter-based absorption methods to scattering aerosols (e.g., Bond et al., 1999). Another important effect is
25
that the Saharan dust particles also absorb light and the aethalometer interprets this as BC.
ACPD
6, 455–491, 2006 Atlantic aerosol chemistry A. Virkkula et al. Title Page Abstract Introduction Conclusions References Tables Figures J I J I Back CloseFull Screen / Esc
Print Version
Interactive Discussion
EGU using an impactor for sampling. For the organic aerosol mass conversion factor Quinn
et al. (2001) used 1.6 for North American air masses and 2.1 for other air mass regions. We have used the factor 1.4 for all samples, as discussed above. The POM concen-trations observed during Aerosols99 were close to those observed in the present work when only POM2–4 is taken into account (Fig. 3). This supports the assumption that
5
the first peak of the evolved gas analysis thermogram represents adsorbed gaseous organics.
3.3. Chemical mass balance of HV samples
The non-sea-salt, non-crustal ions dominated the aerosol chemical mass in region 1 and close to the equator (Fig. 4). In the dust plume the crustal mass contributed the
10
most to the aerosol. This is in agreement with the observations of Niemi et al. (2005), who analyzed the elemental composition of individual supermicron particles in the same samples using SEM/EDX method. South of latitude 8◦S the contribution of sea salt was >50%, with the exception of the sample started in the Cape Town harbor. In the open ocean south of Cape Town the HV samples the mass fraction of sea salt
15
was >80%. Over the pack-ice the contribution of the other ions grew again and at the Antarctic site it was higher than that of sea-salt. The reason for that is that Aboa is far from the open ocean and large sea salt particles do not reach it very easily. POM mass fraction was significant in most areas. Only in one sample in region 4 its mass fraction was ∼1%, and even in the Antarctic samples it was ∼14%. EC mass fraction
20
varied between 1 and 4% in regions 1 to 3. In the samples from other regions EC concentrations were below the detection limit so no mass fraction could be calculated. 3.4. Saharan dust and biomass burning
During the cruise nss calcium and nss magnesium were observed only in region 2. They are indicators of Saharan dust. The maximum nss calcium and nss
magne-25
ACPD
6, 455–491, 2006 Atlantic aerosol chemistry A. Virkkula et al. Title Page Abstract Introduction Conclusions References Tables Figures J I J I Back CloseFull Screen / Esc
Print Version
Interactive Discussion
EGU Nss potassium is also a component of soil dust but it is a also released in biomass
burning. When the maximum nss potassium concentration was measured, AOD was slightly lower, 0.27. The excess-potassium-to-soot ratio is an indicator of the relative contribution of biomass and fossil-fuel burning to soot carbon aerosols, so that ratios larger than about 0.2 can be attributed to biomass burning (Andreae, 1983). Excess
5
potassium is the potassium that is left after subtracting the crustal contribution, i.e., exc K+=nss K+ – crustal K+=K+ – (K+/Na+)seasaltNa+ – (K+/Ca2+)crustalnssCa2+. The above formula is based on the assumptions that all sodium is from seasalt and that all nss calcium is crustal. In samples taken in Region 2 there may be sodium also in the Saharan dust particles, so the first assumption may lead to underestimation of nss
10
potassium in the clearest Saharan dust samples. Nss calcium may also originate from a biological source, skeletal material from coccolithophore phytoplankton (Artaxo et al., 1992.). However, during our cruise nss calcium was observed only in the samples that contained other crustal tracers such as aluminosilicates (Niemi et al., 2005) so the biological contribution to nss calcium may be assumed negligble.
15
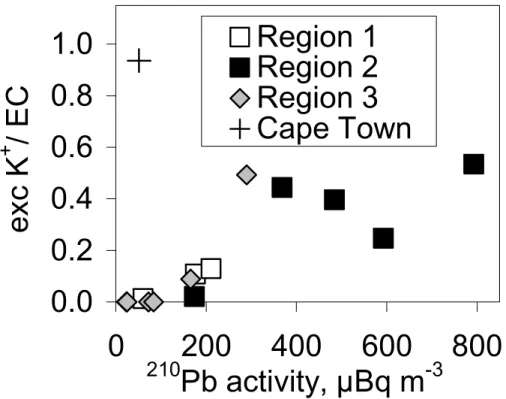
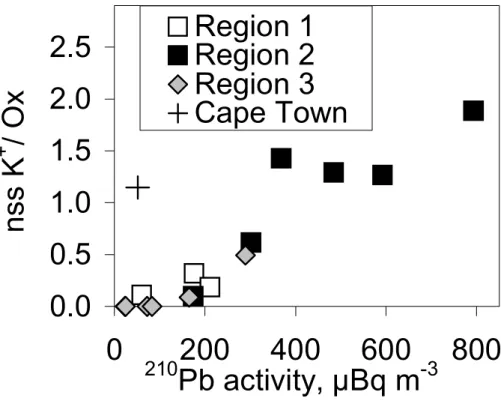
In our samples the average of excess-potassium-to-EC ratio was 0.06, 0.27, and 0.10 in regions 1, 2, and 3, respectively, and 0.00 in the other regions. The high-est ratio 0.94 was observed in the sample started at Cape Town harbor (Fig. 5). In region 2 the highest ratio 0.53 was in the sample that also had the highest EC concen-tration (256 ng m−3), so this sample may be assumed to be from biomass burning. This
20
sample also had the maximum210Pb activity concentration 793 µBq m−3. The plot of excess-potassium-to-soot ratio vs.210Pb activity concentration in regions 1–3 (Fig. 5) suggests that the210Pb activity concentration is a good tracer of biomass burning in the African coast. An exception is the sample started at Cape Town harbor where the ratio was high even though the210Pb activity concentration was low. A probable
expla-25
nation is that in the urban area biomass is burned under control in stoves, for instance, which does not lead to significant convection of soil-related particles and gases such as radon and subsequently210Pb, which takes place when biomass burning is a for-est fire. Another mechanism for increased210Pb activity concentrations in forest fires
ACPD
6, 455–491, 2006 Atlantic aerosol chemistry A. Virkkula et al. Title Page Abstract Introduction Conclusions References Tables Figures J I J I Back CloseFull Screen / Esc
Print Version
Interactive Discussion
EGU is that soil and dust particles deposited on plants get mobilized during forest fires as
suggested by Nho et al. (1996).
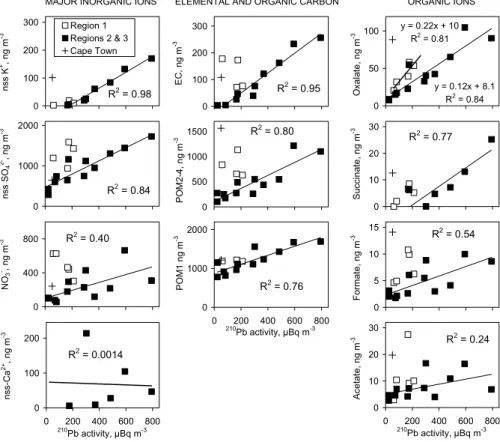
The best tracer for soil dust in our data is nss calcium. The high correlation of nss potassium with 210Pb and the low correlation of nss calcium with 210Pb (Fig. 6) suggests that in our samples the resuspension of soil dust was much less important to
5
210
Pb emissions than biomass burning. Biomass burning aerosols also contain sulfate, organic and elemental carbon, and other organic species (e.g., Gaudichet et al., 1995; Andreae et al., 1998). This is in agreement with our samples. The aerosol constituents that correlate best with210Pb in regions 2 and 3 were nss potassium, EC, POM, oxalate, succinate and formate (Fig. 6).
10
Figure 6 also shows that in most samples the ratio of the concentration of the ana-lyzed species to210Pb activity concentration is higher in region 1 than in regions 2 and 3. For instance, for oxalate the linear regression yields Ox=0.22×210Pb+10 ng m−3 for the samples in region 1 and Ox=0.12×210Pb+8.1 ng m−3 for the samples in regions 2 and 3. Oxalate and nss potassium are both good tracers of biomass burning. However,
15
the ratio of nss potassium to oxalate varies so that it was clearly lower, 0.2±0.1, in the air masses from Europe than in region 2 where the clearest African biomass burning aerosols were observed (Fig. 7). There the average ± standard deviation of the ratio was 1.1±0.5.
3.5. Dilution of continental aerosols over the ocean
20
Many of the measured ions, EC, POM, and210Pb have their principal or only sources in continental areas. The mechanisms that lead to decreasing concentrations of these aerosols are dilution with cleaner air, wet and dry deposition, and chemical reactions. Assuming that their concentrations over the continent are at some continental level and that they decrease only by dilution and dry deposition, their concentrations should
25
decrease exponentially with distance from the continent. The distance of the ship from the coast was calculated for the ship’s locations every 6 h and averaged over each sampling period. Between latitudes 13◦N and 13◦S the concentrations of EC,
ACPD
6, 455–491, 2006 Atlantic aerosol chemistry A. Virkkula et al. Title Page Abstract Introduction Conclusions References Tables Figures J I J I Back CloseFull Screen / Esc
Print Version
Interactive Discussion
EGU
210
Pb, POM1, POM2-4, nss K+, nss Ca2+, nss SO2−4 , and oxalate all did decrease exponentially with the distance from the African coast (Fig. 8). Using the HV samples (Dp<3 µm) their effective half-value distances, L1/2=ln(2)/k (k from the exponential fits
in Fig. 8), were 365 km, 693 km, 1575 km, 578 km, 224 km, 99 km, 950 km, and 578 km, respectively.
5
3.6. Ionic ratios for assessing the contribution of anthropogenic and natural aerosols A qualitative estimate of the acidity of aerosols can be given by calculating the mea-sured cation-to-anion ratio in charge equivalents and assuming that the cation defi-ciency is due to H+ions that cannot be analyzed using ion chromatography. Kerminen et al. (2001) observed that the measured cation-to-anion ratios vary with particle size
10
and sampling site, so that in urban sampling sites the aerosol was either neutral or al-kaline throughout the size spectrum while in background areas the accumulation mode particles were acidic. When using the full chemical mass size distributions our obser-vations were similar (Virkkula et al., 2005). In regions 1 and 2 that are close to the continents with high anthropogenic ion concentrations, the aerosol was close to
neu-15
tral or alkaline on all impactor stages. In the regions away from the polluted areas the accumulation mode was clearly acidic. However, in this work we divided the par-ticles into submicron and supermicron ranges. For supermicron parpar-ticles the average cation-to-anion ratio was 1.0±0.1 at sea excluding the dust and biomass burning re-gion where the average ratio was 1.2±0.1, indicative of alkaline particles (Fig. 9a). At
20
Aboa supermicron aerosols were also alkaline, which is due to the location of the site. Aboa is located on a snow-free nunatak that releases substantial amounts of soil dust during windy conditions. For submicron particles the ion ratio varied more (Fig. 9a). In regions 1 and 2 the ratio was 1.0±0.1 and 1.1±0.1, respectively, and 0.8±0.2 in the other marine regions. At Aboa the ratio was 0.5±0.1.
25
The ammonium to nss sulfate ratio in charge equivalents shows clear differences between the more polluted and less polluted areas (Fig. 9b). In the latter areas the
ACPD
6, 455–491, 2006 Atlantic aerosol chemistry A. Virkkula et al. Title Page Abstract Introduction Conclusions References Tables Figures J I J I Back CloseFull Screen / Esc
Print Version
Interactive Discussion
EGU ratio was clearly below one. This ratio gives a more reliable information on the
neu-tralization of aerosol particles compared to cation-to-anion ratios. Most of ammonium was in submicron particles (Table 2) because the supermicron particles were neutral or alkaline even without ammonium. For ammonia to react with the particles they have to be acidic.
5
Another indication of the decrease of anthropogenic influence is the MSA to nss sulfate ratio, R, that increased southward (Fig. 9c). The two most important factors contributing to the increase of R are a decrease of anthropogenic nss-sulfate concen-trations and an increase of MSA concenconcen-trations. The increase of R toward higher latitudes latitudes as well as its strong seasonal cycle at high latitudes are well-known
10
phenomena (e.g., Saltzman et al., 1986; Bates et al., 1992; Ayers et al., 1996, 1997; Heintzenberg et al., 2000; Savoie et al., 2002). The biogenic R varies from about 0.05– 0.06 in tropical latitudes to values >0.3 in high latitudes (Savoie et al., 2002). Using a box model Kerminen et al. (1998) analyzed potential explanations for the increase of R toward high latitudes during the summer: larger MSA yields from DMS oxidation,
15
larger DMSO yields from DMS oxidation followed by the conversion of DMSO to MSA at high latitudes, or lower ambient H2O2concentrations at high latitudes leading to less efficient sulfate production in clouds. In our samples taken in the northern hemisphere R was <0.01, so according to the criterium above the nss sulfate in the northern hemi-sphere was clearly anthropogenic. South of 15◦S R was >0.05. At Aboa R varied
20
between ∼0.04 and 0.4.
A way of estimating whether the increase of R southwards is more due to the de-crease of anthropogenic sulfate or to the inde-crease of natural MSA is to compare R with a clear indicator of anthropogenic aerosol. The sources of nitrate are mainly anthro-pogenic so it was used for such a purpose. There was a clear inverse relationship
25
between R and nitrate concentrations (Fig. 10) and also between MSA and nitrate con-centrations. The exponent of the fitted power curves was 1.1 for R(NO−3) and −0.47 for MSA−(NO−3) (Fig. 10) which means that R increased clearly faster than MSA with decreasing nitrate concentrations. This suggests that the increase of R can largely be
ACPD
6, 455–491, 2006 Atlantic aerosol chemistry A. Virkkula et al. Title Page Abstract Introduction Conclusions References Tables Figures J I J I Back CloseFull Screen / Esc
Print Version
Interactive Discussion
EGU explained by the decrease of anthropogenic sulfate.
4. Summary and conclusions
The concentrations of all anthropogenic aerosol compounds decreased clearly from north to south. An anthropogenic influence was still evident in the middle of the tropical South Atlantic, background values were reached only south of Cape Town. North of
5
the equator 70–80% of the particles with Dp<3 µm consisted of non-sea-salt species,
whereas south of the equator most of the aerosol mass consisted of sea-salt ions. The contribution of sea salt to the sum of analyzed species of Dp<3 µm particles was
∼25% in the polluted latitudes, >80% in the ocean south of Cape Town, ∼50% over the pack-ice region and <10% at the Antarctic site Aboa. At Aboa the contribution of sea
10
salt was low because of the >130 km distance between the station and the open sea. The contribution of organic carbon was >10% in most samples, also at Aboa.
The highest 210Pb activity concentration coincided with the the highest nss potas-sium and EC concentrations and not with the highest nss calcium and thus of Saharan dust. This suggests that210Pb is a better tracer for biomass burning than for Saharan
15
dust. The most evident explanation is that210Pb is attached to the surface of particles and therefore the particles that have the largest surface area have the highest 210Pb concentrations. This assumption is supported by the fact that there exists an instru-ment, the epiphaniometer, that measures the aerosol surface area by measuring the decay of 211Pb attached to the surface of particles (G ¨aggeler et al., 1989). If 211Pb
20
successfully attaches to aerosol surfaces then it is a reasonable assumption that210Pb will also do so. The size distributions of nss potassium showed that it was predom-inantly in the small particles (Virkkula et al., 2005). Its integrated surface area was larger than that of nss calcium. In our data the ratio of the two clear tracers of biomass burning, nss potassium and oxalate, was different in European and in African samples,
25
suggesting that this ratio could be used as an indicator of biomass burning type. There was a very clear inverse exponential relationship between the continental
ACPD
6, 455–491, 2006 Atlantic aerosol chemistry A. Virkkula et al. Title Page Abstract Introduction Conclusions References Tables Figures J I J I Back CloseFull Screen / Esc
Print Version
Interactive Discussion
EGU aerosols and the distance of the ship from the African continent. The exponential fits
yielded transport distances expressed as half-value distances. The longest half-value distances were for those components that are mainly in the submicron particles and those that have also marine sources. The removal mechanisms are size-dependent. For instance, for dry and wet deposition roughly in the particle size range >0.1 µm
5
the removal rate increases with particle size. This is in agreement with the shortest half-value distance, ∼100 km, for nss calcium that is mainly a constituent of soil dust particles. The half-value distance of 210Pb was higher than that of nss potassium, even though their correlation was very high, suggesting that210Pb was probably asso-ciated with smaller particles than nss potassium.210Pb was only determined using HV
10
samples, so direct comparison of their size distributions cannot be done. For chemical compounds that also have sources in the ocean, for instance nss sulfate, the half-value distances were higher than that of210Pb.
The acidity of aerosols was estimated by calculating the cation-to-anion ratio in charge equivalents. Supermicron particles were neutral or alkaline in all regions. For
15
submicron particles there were larger differences so that in the polluted regions they were neutral and in the less-polluted regions acidic. However, when the sum of all submicron stages was calculated the acidic nature of the submicron particles over the ocean was not as clear as shown in the size distributions by Virkkula et al. (2005). This is due to the high sea-salt concentration in marine areas and because sea-salt
parti-20
cles exist also in the submicron range. The analysis showed that when data on only two size fractions are available the ammonium to nss sulfate ratio gives a more reliable information on the neutralization of aerosol particles than the cation-to-anion ratio.
The MSA to nss sulfate ratio, R, increased southwards. To assess whether the in-crease of R was more due to the dein-crease of anthropogenic sulfate or to the inin-crease of
25
natural MSA, R was compared with nitrate, a clear indicator of anthropogenic aerosol. There was a very clear inverse relationship between R and nitrate concentration in our samples. R increased faster than MSA with decreasing anthropogenic influence which suggests that the R increase can largely be explained by the decrease of anthropogenic
ACPD
6, 455–491, 2006 Atlantic aerosol chemistry A. Virkkula et al. Title Page Abstract Introduction Conclusions References Tables Figures J I J I Back CloseFull Screen / Esc
Print Version
Interactive Discussion
EGU sulfate.
Acknowledgements. The project was funded by the Academy of Finland (Finnish Antarctic
Re-search Program, “Aerosols in Antarctica”, contracts no. 43928 and 53669). The Arctic and Antarctic Research Institute (AARI) of St. Petersburg, Russia, is gratefully acknowledged for allowing the measurements onboard R/V Akademik Fedorov, as well as the crew of the vessel
5
for fruitful cooperation. The excellent logistical support of FINNARP is also gratefully acknowl-edged.
References
Andreae, M. O.: Soot carbon and excess fine potassium: long-range transport of combustion-derived aerosols, Science, 220, 1148–1151, 1983.
10
Andreae, M. O., Andreae, T. W., Annegarn, H., Beer, J., Cachier, H., le Canut, P., Elbert, W., Maenhaut, W., Salma, I., Wienhold, F. G., and Zenker, T.: Airborne studies of aerosol emis-sions from savanna fires in southern Africa: 2. Aerosol chemical composition, J. Geophys. Res., 103, 32 119–32 128, 1998.
Artaxo, P., Rabello, M., Maenhaut, W., and van Grieken, R.: Trace Elements and individual
15
particle analysis of atmospheric aerosols from the Antarctic Peninsula, Tellus, 44B, 318– 334, 1992.
Ayers, G. P., Cainey, J. M., Granek, H., and Leck, C.: Dimethylsulfide oxidation and the ratio of methanesulfonate to non sea-salt sulfate in the marine aerosol, J. Atmos. Chem., 25, 307–325, 1996.
20
Ayers, G. P., Cainey, J. M., Gillett, R. W., Saltzman, E. S., and Hooper, M.: Sulfur dioxide and dimethyl sulfide in marine air at Cape Grim, Tasmania, Tellus, 49B, 292–299, 1997.
Bates, T. S., Calhoun, J. A., and Quinn, P. K.: Variations in the methanesulfonate to sulfate mo-lar ratio in submicrometer marine aerosol particles over the South Pacific Ocean, J. Geophys. Res., 97, 9859–9865, 1992.
25
Bates, T. S., Quinn, P. K., Coffman, D. J., Johnson, J. E., Miller, T. L., Covert, D. S., Wieden-sohler, A., Leinert, S., Nowak, A., and Neus ¨uss, C.: Regional physical and chemical proper-ties of the marine boundary layer aerosol across the Atlantic during Aerosols99: An overview, J. Geophys. Res., 106(D18), 20 767–20 782, 2001.
ACPD
6, 455–491, 2006 Atlantic aerosol chemistry A. Virkkula et al. Title Page Abstract Introduction Conclusions References Tables Figures J I J I Back CloseFull Screen / Esc
Print Version
Interactive Discussion
EGU
Bergstrom, R. W. and Russell, P. B.: Estimation of aerosol direct radiative effects over the mid-latitude North Atlantic from satellite and in situ measurements, Geophys. Res. Lett., 26, 1731–1734, 1999.
Birch, M. E. and Cary, R. A.: Elemental carbon-based method for monitoring occupational exposures to particulate diesel exhaust, Aerosol Sci. Technol., 25, 221–241, 1996.
5
Brockman, J. E.: Sampling and Transport of Aerosols, in: Aerosol measurement: principles, techniques, and applications, edited by: Willeke, K. and Baron P., Van Nostrand Reinhold, New York, 77–111, 1993.
Chiapello, I. and Moulin, C.: TOMS and METEOSAT satellite records of the variability of Sa-haran dust transport over the Atlantic during the last two decades (1979–1997), J. Geophys.
10
Res., 29(8), Geophys. Res. Lett., 29(8), 1176, doi:10.1029/2001GL013767, 2002.
Davison, B., Hewitt, C. N., O’Dowd, C., Lowe, J. A., Smith, M. H., Schwikowski, M., Bal-tensperger, U., and Harrison, R. M.: Dimethyl sulfide, methane sulfonic acid and physico-chemical aerosol properties in Atlantic air from the United Kingdom to Halley Bay, J. Geo-phys. Res., 101, 22 855–22 867, 1996.
15
Draxler, R. R. and Hess, G. D.: Description of the HYSPLIT4 modelling system, NOAA Tech.Memo. ERL ARL-224, 24 p., Environ. Res. Lab., Boulder, Colo., 1997.
Draxler, R. R. and Hess, G. D.: An overview of the HYSPLIT4 modeling system for trajectories, dispersion and deposition, Aust. Meteorol. Mag., 47, 295–308, 1998.
G ¨aggeler, H. W., Baltensperger, U., Emmenegger, M., Jost, D. T., Schmidt-Ott, A., Haller, P.,
20
and Hofmann, M.: The epiphaniometer, a new device for continuous aerosol monitoring, J. Aerosol Sci., 20, 557–564, 1989.
Gaudichet, A., Echalar, F., Chatenet, B., Quisefit, J. P., Malingre, G., Cachier, H., Buat-Menard, P., Artaxo, P., and Maenhaut, W.: Trace elements in tropical African savanna biomass burning aerosols, J. Atmos. Chem., 22, 19–39, 1995.
25
Hegg, D. A., Livingston, J., Hobbs, P. V., Novakov, T., and Russell, P.: Chemical apportionment of aerosol column optical depth off the mid-Atlantic coast of the United States, J. Geophys. Res., 102, 25 293–25 303, 1997.
Heintzenberg, J., Covert, D. S., and Van Dingenen, R.: Size distribution and chemical compo-sition of marine aerosols: A compilation and review, Tellus, 52B, 1104–1122, 2000.
30
Kaufman, Y. J., Tanr ´e, D., and Boucher, O.: A satellite view of aerosols in the climate system, Nature, 419, 215–223, 2002.
ACPD
6, 455–491, 2006 Atlantic aerosol chemistry A. Virkkula et al. Title Page Abstract Introduction Conclusions References Tables Figures J I J I Back CloseFull Screen / Esc
Print Version
Interactive Discussion
EGU
particulate MSA to non-sea-salt sulfate ratio in the marine environment, J. Atmos. Chem., 30, 345–370, 1998.
Kerminen, V.-M., Hillamo, R., Teinil ¨a, K., Pakkanen, T., Allegrini, I., and Sparapani, R.: Ion balances of size-resolved tropospheric aerosol samples: implications for the acidity and at-mospheric processing of aerosols, Atmos. Environ., 35, 5255–5265, 2001.
5
Kirchstetter, T. W., Corrigan, C. E., and Novakov, T.: Laboratory and field investigation of the adsorption of gaseous organic compounds onto quartz filters, Atmos. Environ., 35, 1663– 1671, 2001.
Koponen, I. K., Virkkula, A., Hillamo, R., Kerminen, V.-M., and Kulmala, M.: Number size distributions and concentrations of marine aerosols: Observations during a cruise
be-10
tween the English Channel and the coast of Antarctica, J. Geophys. Res., 107(D24), 4753, doi:10.1029/2002JD002533, 2002.
Koponen, I. K., Virkkula, A., Hillamo, R., Kerminen, V.-M., and Kulmala, M.: Number size distributions and concentrations of the continental summer aerosols in Queen Maud Land, Antarctica, J. Geophys. Res., 108(D18), 4587, doi:10.1029/2003JD003614, 2003.
15
Leck, C., Heintzenberg, J., and Engardt, M.: A meridional profile of the chemical composition of submicrometre particles over the East Atlantic Ocean: regional and hemispheric variabilities, Tellus, 54B, 377–394, 2002.
Lelieveld, J., Crutzen, P. J., Ramanathan, V., Andreae, M. O., Brenninkmeijer, C. A. M., Cam-pos, T., Cass, G. R., Dickerson, R. R., Fischer, H., de Gouw, J. A., Hansel, A., Jefferson, A.,
20
Kley, D., de Laat, A. T. J., Lal, S., Lawrence, M. G., Lobert, J. M., Mayol-Bracero, O. L., Mitra, A. P., Novakov, T., Oltmans, S. J., Prather, K. A., Reiner, T., Rodhe, H., Scheeren, H. A., Sikka, D., and Williams, J.: The Indian Ocean experiment: Widespread air pollution from south and southeast Asia, Science, 291, 1031–1036, doi:10.1126/science.1057103, 2001. Maenhaut, W., Hillamo, R., M ¨akel ¨a, T., Jaffrezo, J.-L., Bergin, M. H., and Davidson, C. I.: A
25
new cascade impactor for aerosol sampling with subsequent PIXE analysis, Nucl. Instrum. Methods Phys. Res. Sect. B, 109/110, 482–487, 1996.
Mason, B.: Principles of Geochemistry, 3rd edn., John Wiley, New York, 1966.
Mattsson, R., Paatero, J., and Hatakka, J.: Automatic alpha/beta analyser for air filter samples – absolute determination of radon progeny by pseudo-coincidence techniques, Radiat. Prot.
30
Dosim., 63(2), 133–139, 1996.
Minikin, A., Legrand, M., Hall, J., Wagenbach, D., Kleefeld, C., Wolff, E., Pasteur, E. C., and Ducroz, F.: Sulfur-containing species (sulfate and methanesulfonate) in coastal Antarctic
ACPD
6, 455–491, 2006 Atlantic aerosol chemistry A. Virkkula et al. Title Page Abstract Introduction Conclusions References Tables Figures J I J I Back CloseFull Screen / Esc
Print Version
Interactive Discussion
EGU
aerosol and precipitation, J. Geophys Res., 103, 10 975–10 990, 1998.
Nho, E.-Y., Ardouin, B., Le Cloarec, M. F., and Ramonet, M.: Origins of210Po in the atmosphere at Lamto, Ivory Coast: Biomass burning and Saharan dust, Atmos. Environ., 30, 3705–3714, 1996.
Niemi, J. V., Tervahattu, H., Virkkula, A., Hillamo, R., Teinil ¨a, K., Koponen, I. K.,
5
and Kulmala, M.: Continental impact on marine boundary layer coarse particles
over the Atlantic Ocean between Europe and Antarctica, Atmos. Res., 75, 301–321, doi:10.1016/j.atmosres.2005.01.005, 2005.
Nu ˜nes, M. J. M.: Establishment of chemical properties of theaerosol in the North East Atlantic Ocean, Ph.D. Thesis, University of Lisbon, 426 p., 2002.
10
O’Dowd, C., Smith, M. H., Consterdine, I. E., and Lowe, J. A.: Marine aerosol, sea-salt, and the marine sulphur cycle: A short review, Atmos. Environ., 31, 73–80, 1997.
Prospero, J. M.: Long-term measurements of the transport of African mineral dust to the south-eastern United States: Implications for regional air quality, J. Geophys. Res., 104, 15 917– 15 927, 1999.
15
Putaud, J. P. , Van Dingenen, R., Mangoni, M., Virkkula, A., Raes, F., Maring, H., Prospero, J. M., Swietlicki, E., Berg, O. H., Hillamo, R., and M ¨akel ¨a, T.: Chemical mass closure and assessment of the origin of the submicron aerosol in the marine boundary layer and the free troposphere at Tenerife during ACE-2, Tellus, 52, 141–168, 2000.
Quinn, P. K., Coffman, D. J., Bates, T. S., Miller, T. L., Johnson, J. E., Voss, K., Welton, E. J.,
20
and Neus ¨uss, C.: Dominant aerosol chemical components and their contribution to extinction during the Aerosols99 cruise across the Atlantic, J. Geophys. Res., 106(D18) 20 783–20 810, 2001.
Raes, F., Bates, T., McGovern, F., and van Liedekerke, M.: The 2nd aerosol characterization experiment (ACE-2): general overview and main results, Tellus, 52B, 111–125, 2000.
25
Ramanathan, V., Crutzen, P. J., Kiehl, J. T., and Rosenfeld, D.: Aerosols, climate and the hydrological Cycle, Science, 294, 2119–2124, 2001.
Rankin, A. M., Wolff, E. W., and Martin, S.: Frost flowers: Implications for
tropo-spheric chemistry and ice core interpretation, J. Geophys. Res., 107(D23), 4683, doi:10.1029/2002JD002492, 2002.
30
Ravishankara, A. R.: Heterogeneous and multiphase chemistry in the troposphere, Science, 276, 1058–1065, 1997.
ACPD
6, 455–491, 2006 Atlantic aerosol chemistry A. Virkkula et al. Title Page Abstract Introduction Conclusions References Tables Figures J I J I Back CloseFull Screen / Esc
Print Version
Interactive Discussion
EGU
United States East Coast haze plume: an overview of the Tropospheric Aerosol Radiative Forcing Observational Experiment (TARFOX), J. Geophys. Res., 104, 2213–2222, 1999. Russell, L. M.: Aerosol organic-mass-to-organic-carbon ratio measurements, Environ. Sci.
Technol., 37, 2982–2987, 2003.
Savoie, D. L., Arimoto, R., Keene, W. C., Prospero, J. M., Duce, R. A., and Galloway,
5
J. N.: Marine biogenic and anthropogenic contributions to non-sea-salt sulfate in the ma-rine boundary layer over the North Atlantic Ocean, J. Geophys. Res., 107, D18, 4356, doi:10.1029/2001JD000970, 2002.
Saltzman, E. S., Savoie, D. L., Prospero, J. M., and Zika, R. G.: Methanesulfonic acid and non-sea-salt sulfate in Pacific air: Regional and seasonal variations, J. Atmos. Chem., 4,
10
227–240, 1986.
Samuelsson, C., Hallstadius, L., Persson, B., Hedvall, R., Holm, E., and Forkman, B.: 222Rn and210Pb in the Arctic summer air, J. Environ. Radioactivity, 3, 35–54, 1986.
Seinfeld, J. H.: Meeting at the interface, Science, 288, 285, 2000.
Sekiguchi, M., Nakajima, T., Suzuki, K., Kawamoto, K., Higurashi, A., Rosenfeld, D, Sano,
15
I., and Mukai, S.: A study of the direct and indirect effects of aerosols using global satellite data sets of aerosol and cloud parameters, J. Geophys. Res., 108(D22) 4699, doi:10.1029/2002JD003359, 2003.
Turpin, B. and Lim, H.-J.: Species contributions to PM2.5 mass concentrations: Revisiting com-mon assumptions for estimating organic mass, Aerosol Sci. Technol., 35, 602–610, 2001.
20
Van Dingenen, R., Raes, F., and Jensen, N. R.: Evidence for anthropogenic impact on num-ber concentration and sulfate content of cloud-processed aerosol particles over the North Atlantic, J. Geophys. Res., 100, 21 057–21 068, 1995.
Virkkula, A., Teinil ¨a, K., Hillamo, R., Kerminen, V.-M., Saarikoski, S., Aurela, M., Koponen, I. K., and Kulmala, M.: Chemical size distributions of boundary layer aerosol over the Atlantic
25
Ocean and at an Antarctic site, J. Geophys. Res., in press, 2005.
Wagenbach, D., Ducroz, F., Mulvaney, R., Keck, L., Minikin, A., Legrand, M., Hall, J. S., and Wolff, E. W.: Sea-salt aerosol in coastal Antarctic regions, J. Geophys Res., 103, 10 961– 10 974, 1998.
ACPD
6, 455–491, 2006 Atlantic aerosol chemistry A. Virkkula et al. Title Page Abstract Introduction Conclusions References Tables Figures J I J I Back CloseFull Screen / Esc
Print Version
Interactive Discussion
EGU
Table 1. Average and standard deviation of concentrations (ng m−3) in the blank filters,
calcu-lated using average volume drawn through each sampling system in 24 h.
Ac For MSA Pyr Cl Br NO3 Glu Suc Mal SO4 Ox Na NH4 K Mg Ca
High Volume Sampler
Cruise ave 8.8 2.5 0.0 0.0 5.6 0.0 0.9 0.0 0.0 0.0 34 0.00 20 3.1 0.0 0.05 10 std 2.3 0.7 0.0 0.0 4.9 0.0 0.9 0.0 0.0 0.0 16 0.00 1.6 1.1 0.0 0.12 4.1 Aboa ave 7.9 2.7 0.0 0.0 7.9 0.0 2.4 0.0 0.0 0.0 9.2 0.00 19 3.2 0.0 0.03 8.1 std 3.0 1.1 0.0 0.0 3.3 0.0 1.6 0.0 0.0 0.0 8.6 0.00 1.3 1.5 0.0 0.14 3.4 Virtual impactor Cruise ave 2.4 1.2 0.2 0.0 3.6 0.0 5.4 0.0 0.0 0.0 1.3 0.03 4.7 0.1 0.3 0.2 3.0 std 2.9 1.5 0.4 0.0 1.5 0.0 2.6 0.0 0.0 0.0 0.8 0.06 1.4 0.1 0.3 0.3 2.9 Aboa ave 0.0 0.0 0.0 0.0 2.3 0.0 3.2 0.0 0.0 0.0 1.7 0.06 3.6 0.0 0.3 0.0 0.8 std 0.0 0.0 0.0 0.0 0.6 0.0 1.1 0.0 0.0 0.0 0.4 0.08 0.2 0.0 0.1 0.0 0.2 SDI Cruise ave 2.0 2.5 1.0 0.0 1.1 0.0 0.1 0.0 0.0 0.0 0.9 0.00 8.7 0.4 0.1 0.3 0.7 std 1.3 1.5 1.2 0.0 0.9 0.0 0.3 0.0 0.0 0.0 0.8 0.00 3.9 0.3 0.3 0.5 0.8 Aboa ave 0.0 0.0 0.5 0.0 0.6 0.0 0.0 0.0 0.0 0.0 0.0 0.00 5.5 0.3 0.0 0.2 0.0 std 0.0 0.0 0.1 0.0 0.1 0.0 0.0 0.0 0.0 0.0 0.0 0.00 0.3 0.1 0.0 0.1 0.0
HV filters, EC/OC blanks, ng m−3
EC OC1 OC2 OC3 OC4
Cruise ave 1.9 248 1.5 66 14
std 5.8 89 4.9 35 13
Aboa ave 0.0 225 0.0 52 22
ACPD
6, 455–491, 2006 Atlantic aerosol chemistry A. Virkkula et al. Title Page Abstract Introduction Conclusions References Tables Figures J I J I Back CloseFull Screen / Esc
Print Version
Interactive Discussion
EGU
Table 2. Average concentrations of ionic species in submicron and supermicron particles
ana-lyzed from the impactor samples in each region. Unit: ng m−3. Major inorganic species
Dp<1 µm Dp>1 µm Dp<1 µm Dp>1 µm
region ave±std ave±std ave±std ave±std
Sea salt nss sulfate
1 275±128 5366±1068 1081±259 60±106 2 733±1405 5585±1292 1233±310 226±288 3 355±106 4623±41 575±256 6±39 4 1131±288 4681±329 151±4 5±4 6 30±16 53±29 236±45 18±6 Nitrate Ammonium 1 53±15 1316±219 420±163 4.3±2.1 2 19±17 953±168 412±139 27±31 3 15±1 213±119 63±39 6.8±6.4 4 6±1.0 14±4 18±2 14±1 6 1.9±0.8 7.0±2 28±14 1.2±1 Organic anions Dp<1 µm Dp>1 µm Dp<1 µm Dp>1 µm Dp<1 µm Dp>1 µm
region ave±std ave±std ave±std ave±std ave±std ave±std
Methanesulfonate Oxalate Acetate
1 7.3 4.0 22±14 16±8 5.9±4.8 26±10
2 8.8±4.4 2.8±3.2 32±22 42±26 2.3±2.3 31±32
3 33±6 20±10 3.1±1.7 7.4±5.1 4.7±1.2 15±5
4 27±1 14±3 0.8±0.2 1.0±0.4 7.1±1.5 11±1.5
6 31±21 7±5 0.0±0.0 2.1±5.1 – –
Succinate Malonate Formate
1 1.6±1.7 1.3±2.3 2.4±2.6 9.5±6.3 10.9±6.7 18±7
2 1.7±1.9 5.6±4.7 4.4±3.7 14.6±10.1 2.6±3.4 22±22
3 – 0.8±0.7 1.7±2.4 4.1±2.9 1.3±0.7 13±5
ACPD
6, 455–491, 2006 Atlantic aerosol chemistry A. Virkkula et al. Title Page Abstract Introduction Conclusions References Tables Figures J I J I Back CloseFull Screen / Esc
Print Version
Interactive Discussion
EGU
Table 3. Average concentrations of particulate organic matter (POM), elemental carbon (EC),
and210Pb activity, analyzed from the HV filters in each region. Units: POM and EC: ng m−3, 210
Pb: µBq m−3.
POM-1 POM-2 POM-3 POM-4 POM2-4 EC Pb-210 activity
region ave±std ave±std ave±std ave±std ave±std ave±std ave±std
1 1176±96 207±51 218±28 390±182 814±248 125±99 154±58
2 1452±218 200±89 211±57 313±169 723±312 149±77 452±202
3 958±138 65±28 93±17 65±23 223±63 12±16 110±93
4 492±191 32±22 47±18 44±35 123±64 4±5 10±9
ACPD
6, 455–491, 2006 Atlantic aerosol chemistry A. Virkkula et al. Title Page Abstract Introduction Conclusions References Tables Figures J I J I Back CloseFull Screen / Esc
Print Version Interactive Discussion EGU Longitude 40oW 20oW 0o 20oE 40oE 80oS 60oS 40oS 20oS 0o 20oN 40oN 60oN
Aboa
11/09 11/10 11/11 11/12 11/13 11/14 11/15 11/16 11/17 11/18 11/19 11/20 11/21 11/22 11/23 11/24 11/25 12/01 12/02 12/03 12/04 12/05 12/06 12/07 12/08 Latitude Source region 1 2 3 4 5 6Fig. 1. Ship route, source region limits, and 5-day backtrajectories arriving at 500 m above sea
ACPD
6, 455–491, 2006 Atlantic aerosol chemistry A. Virkkula et al. Title Page Abstract Introduction Conclusions References Tables Figures J I J I Back CloseFull Screen / Esc
Print Version Interactive Discussion EGU SEA SALT -80 -60 -40 -20 0 20 40 60 0 3000 6000 9000 ng m-3 MSA --80 -60 -40 -20 0 20 40 60 0 40 80 ng m-3 nss-SO4 2--80 -60 -40 -20 0 20 40 60 0 1000 2000 3000 ng m-3 NH4 + -80 -60 -40 -20 0 20 40 60 0 200 400 600 ng m-3 NO3 --80 -60 -40 -20 0 20 40 60 0 1000 2000 ng m-3 Lati tud e ( °, pos it iv e: n o rt h) HV SDI 1-12 SDI 1-9 VI MDI&PdH AER99 210 Pb -80 -60 -40 -20 0 20 40 60 0 300 600 900 µBq m-3 nss-Ca2+ -80 -60 -40 -20 0 20 40 60 0 300 600 900 ng m-3 nss-K+ -80 -60 -40 -20 0 20 40 60 0 100 200 ng m-3 Succinate -80 -60 -40 -20 0 20 40 60 0 10 20 30 40 ng m-3 Oxalate -80 -60 -40 -20 0 20 40 60 0 50 100 150 ng m-3 Lati tu de ( °, pos it iv e: nor th)
Fig. 2. Selected ion and210Pb activity concentrations from north to south during the campaign.
The southernmost samples were taken at the Antarctic site Aboa. For the HV the concentra-tions are for particles with Dp<∼3 µm, for the SDI for particles with Dp<∼10 µm (SDI 1–12) and for particles with Dp<∼2.7 µm (SDI 1–9), and for the VI for particles with Dp<∼10 µm. For comparison wintertime average nitrate, ammonium, and nss-sulfate concentrations in polluted air masses measured at Madeira Island (MDI) and Punta del Hidalgo at Tenerife (PdH) are pre-sented (Nu ˜nes, 2002) as well as concentrations measured during Aerosols-99 cruise (Quinn et al., 2001).
ACPD
6, 455–491, 2006 Atlantic aerosol chemistry A. Virkkula et al. Title Page Abstract Introduction Conclusions References Tables Figures J I J I Back CloseFull Screen / Esc
Print Version
Interactive Discussion
EGU
Fractions of POM and EC of TC
-80 -60 -40 -20 0 20 40 60 0 25 50 75 100 % POM2-4 POM1 EC
Particulate organic matter (POM)
-80 -60 -40 -20 0 20 40 60 0 1000 2000 3000 4000 ng m-3 POM2-4 POM AER99
Elemental and black carbon
-80 -60 -40 -20 0 20 40 60 1 10 100 1000 ng m-3 Lat itude (°, posi tiv e: N o rt h) EC BC MDI&PdH AER99
Fig. 3. Black, elemental and organic carbon concentrations and their fractions of the total
carbon mass. BC is measured using the Aethalometer, EC and OC from the HV filters using the OC/EC analyzer. Particulate organic matter (POM) is the OC concentrations from the OC/EC analyzer multiplied by the factor 1.4. POM is the sum of all organic carbon, POM1 is the carbon that is released during the first heating step and POM2-4 is the sum of carbon released during the heating steps 2 to 4 of the OC/EC analyzer. The POM and EC error bars are calculated from the standard deviation of the concentrations in each piece of the HV filter, the BC error bars are the standard deviations of the measurements during each filter sampling period. Comparison data: wintertime BC concentrations in polluted air masses measured at Madeira (MDI) and Punta del Hidalgo at Tenerife (PdH) (Nu ˜nes, 2002) and EC and POM concentrations measured during Aerosols99 cruise (AER99) (Quinn et al., 2001).
ACPD
6, 455–491, 2006 Atlantic aerosol chemistry A. Virkkula et al. Title Page Abstract Introduction Conclusions References Tables Figures J I J I Back CloseFull Screen / Esc
Print Version Interactive Discussion EGU Crustal particles -80 -60 -40 -20 0 20 40 60 0 25 50 75 100 Contribution (%) Carbonaceous aerosol -80 -60 -40 -20 0 20 40 60 0 10 20 30 40 Contribution (%) POM2-4 EC Sea Salt -80 -60 -40 -20 0 20 40 60 0 25 50 75 100 Contribution (%) Non-ss, non-crustal Ions
-80 -60 -40 -20 0 20 40 60 0 25 50 75 100 Contribution (%) Lat it ude ( º, posi ti v e: nor th )
CAPE TOWN HARBOR
Fig. 4. Contributions of major components to the chemical mass concentration of the HV
sam-ples (Dp<3 µm). Non-sea-salt, noncrustal ions= nss-SO 2− 4 +NH + 4+NO − 3+nss-ncr-K ++MSA− +
other organic anions; EC: elemental carbon, POM2-4: organic carbon released from the sam-ple in the EC/OC analyzer temperature steps 2, 3, and 4, multiplied by the factor 1.4. Crustal mass= 27.46×nss-Ca2+.
ACPD
6, 455–491, 2006 Atlantic aerosol chemistry A. Virkkula et al. Title Page Abstract Introduction Conclusions References Tables Figures J I J I Back CloseFull Screen / Esc
Print Version Interactive Discussion EGU
0.0
0.2
0.4
0.6
0.8
1.0
0
200
400
600
800
210
Pb activity, µBq m
-3
exc K
+
/ EC
Region 1
Region 2
Region 3
Cape Town
Fig. 5. Excess-potassium-to-soot ratio vs.210Pb activity concentration in regions 1–3 and in