HAL Id: hal-00301257
https://hal.archives-ouvertes.fr/hal-00301257
Submitted on 19 May 2004HAL is a multi-disciplinary open access
archive for the deposit and dissemination of sci-entific research documents, whether they are pub-lished or not. The documents may come from teaching and research institutions in France or abroad, or from public or private research centers.
L’archive ouverte pluridisciplinaire HAL, est destinée au dépôt et à la diffusion de documents scientifiques de niveau recherche, publiés ou non, émanant des établissements d’enseignement et de recherche français ou étrangers, des laboratoires publics ou privés.
Global carbon monoxide as retrieved from
SCIAMACHY by WFM-DOAS
M. Buchwitz, R. de Beek, K. Bramstedt, S. Noël, H. Bovensmann, J. P.
Burrows
To cite this version:
M. Buchwitz, R. de Beek, K. Bramstedt, S. Noël, H. Bovensmann, et al.. Global carbon monoxide as retrieved from SCIAMACHY by WFM-DOAS. Atmospheric Chemistry and Physics Discussions, European Geosciences Union, 2004, 4 (3), pp.2805-2837. �hal-00301257�
ACPD
4, 2805–2837, 2004 Carbon monoxide from SCIAMACHY M. Buchwitz et al. Title Page Abstract Introduction Conclusions References Tables Figures J I J I Back CloseFull Screen / Esc
Print Version Interactive Discussion
© EGU 2004 Atmos. Chem. Phys. Discuss., 4, 2805–2837, 2004
www.atmos-chem-phys.org/acpd/4/2805/ SRef-ID: 1680-7375/acpd/2004-4-2805 © European Geosciences Union 2004
Atmospheric Chemistry and Physics Discussions
Global carbon monoxide as retrieved from
SCIAMACHY by WFM-DOAS
M. Buchwitz, R. de Beek, K. Bramstedt, S. No ¨el, H. Bovensmann, and J. P. Burrows
Institute of Environmental Physics (iup), University of Bremen FB1, Bremen, Germany Received: 18 March 2004 – Accepted: 20 April 2004 – Published: 19 May 2004 Correspondence to: M. Buchwitz ([email protected])
ACPD
4, 2805–2837, 2004 Carbon monoxide from SCIAMACHY M. Buchwitz et al. Title Page Abstract Introduction Conclusions References Tables Figures J I J I Back CloseFull Screen / Esc
Print Version Interactive Discussion
© EGU 2004
Abstract
Vertical columns of CO have been retrieved from SCIAMACHY/ENVISAT short wave/near infrared (∼2.3 µm) nadir spectra using the Weighting Function Modified (WFM) DOAS retrieval algorithm. WFM-DOAS has been applied to a small spectral fitting window lo-cated in SCIAMACHY’s channel 8 (∼2365 nm) covering four CO absorption lines. The 5
focus of this paper is to demonstrate that quantitative information on carbon monoxide (CO) on a global scale can be retrieved from SCIAMACHY. It is shown that plumes of CO resulting from, e.g. biomass burning in Africa, are clearly detectable with SCIA-MACHY. The SCIAMACHY CO columns are in good agreement with the CO column data product of MOPITT (V3). For example, the correlation between SCIAMACHY and 10
MOPITT CO columns for cloud free pixels over land is typically in the range r=0.4– 0.7, where r is the correlation coefficient. In order to retrieve good CO columns it was necessary to improve the calibration of the SCIAMACHY nadir spectra. Never-theless, there is still room for significant improvement. The fit residuals, for example, are dominated by stable and systematic spectral artifacts on the order of the weak CO 15
lines. These artifacts are most pronounced in spectral regions of strong overlapping methane and water vapour absorption bands. They might result from spectrometer slit function uncertainties. The CO columns of the WFM-DOAS Version 0.4 CO column data product presented in this paper have been multiplied by a constant and ground scene independent scaling factor of 0.5 to quantitatively adjust the WFM-DOAS re-20
trieved CO columns to the MOPITT CO data. If and how this scaling factor is influenced by SCIAMACHYs much higher sensitivity to the lower troposphere and boundary layer CO and/or by the currently not perfect spectral fitting needs further investigation.
1. Introduction
Knowledge about the global distribution of CO is important for many reasons, e.g., 25
ACPD
4, 2805–2837, 2004 Carbon monoxide from SCIAMACHY M. Buchwitz et al. Title Page Abstract Introduction Conclusions References Tables Figures J I J I Back CloseFull Screen / Esc
Print Version Interactive Discussion
© EGU 2004 (i) CO is the leading sink of the hydroxyl (OH) radical which itself largely determines
the oxidizing capacity of the troposphere and, therefore, its self-cleansing efficiency, (ii) given sufficient NOx, CO has great air quality impact as a precurser to tropospheric ozone, a secondary pollutant associated with respiratory problems and decreased crop yields, and (iii) as an atmospheric tracer with a relatively long lifetime of approximately 5
two month it can be used as an indicator of how transport redistributes pollutants on a global scale. CO also plays an important role in our climate system as CO has a sig-nificant indirect global warming potential, mainly due to its impact on the atmospheric CH4concentration but also due to O3and CO2production (Bergamaschi et al.,2000). A quantification of the CO distribution in the troposphere, including the boundary layer, 10
is therefore of primary importance.
Prior to the launch of SCIAMACHY only a small number of instruments have mea-sured or are currently measuring atmospheric CO on a global scale, e.g. MAPS (Mea-surement of Air Pollution from Satellite) on space shuttles in 1981, 1984, and 1994 (Reichle et al.,1999), IMG (Interferometric Monitor for Greenhouse gases) on ADEOS 15
I from August 1996 to June 1997 (Kobayashi et al., 1999), and MOPITT on EOS-TERRA since 1999 (Deeter et al.,2003). From all these nadir looking instruments CO concentrations have been derived from CO absorption of the Earth’s thermal infrared emission. In general, thermal infrared (IR) nadir measurements of CO lack sensitivity to the boundary layer and have their sensitivity maximum in the free troposphere (Cler-20
baux et al.,2003). For MOPITT CO profile retrieval the lowest retrieval level is 850 hPa and the sensitivity of MOPITT to CO in the lowest part of the troposphere below approx. 3 km is rapidly decreasing to zero (Deeter et al.,2003). MOPITT has also channels in the near infrared (NIR) but due to instrument problems the currently released CO pro-file and column data products are derived from the thermal IR channels. In contrast, 25
the NIR measurements of SCIAMACHY are very sensitive also for the boundary layer, as depicted by the averaging kernels shown in Fig.1 (for details see Sect. 5). SCIA-MACHY, therefore, has the potential to significantly enhance our knowledge of lower tropospheric CO including its (surface) sources and sinks.
ACPD
4, 2805–2837, 2004 Carbon monoxide from SCIAMACHY M. Buchwitz et al. Title Page Abstract Introduction Conclusions References Tables Figures J I J I Back CloseFull Screen / Esc
Print Version Interactive Discussion
© EGU 2004
2. The SCIAMACHY instrument
The SCanning Imaging Absorption spectroMeter for Atmospheric CHartographY (SCIA-MACHY) instrument (Bovensmann et al., 1999) is part of the atmospheric chemistry payload of the European Space Agencies (ESA) environmental satellite ENVISAT launched in March 2002. ENVISAT is in sun-synchronous low Earth orbit crossing the equator 5
at 10:00 local time. SCIAMACHY is a grating spectrometer that measures spectra of scattered, reflected, and transmitted solar radiation in the spectral region 240–2400 nm in nadir, limb, and solar and lunar occultation viewing modes. The SCIAMACHY near-infrared (NIR) nadir spectra contain information on many important atmospheric trace gases such as CO, CH4, CO2, and N2O.
10
For this study mainly channel 8 of SCIAMACHY is relevant. Channel 8 covers the spectral region 2260–2385 nm with one linear detector array (1024 detector pixels). The spectral resolution is ∼0.2 nm. The spatial resolution, i.e. the footprint size of a single nadir measurement, is 30×120 km2 corresponding to an integration time of 0.5 s, except at high solar zenith angles (e.g. polar regions in summer hemisphere), 15
where the pixel size is twice as large (30×240 km2). On the illuminated part of the Earth (dayside) SCIAMACHY mainly performs alternating limb and nadir observations (about one minute each). SCIAMACHY also performs direct (extraterrestrial) sun ob-servations mainly to obtain the solar reference spectra needed for the retrieval. The in-flight optical performance of SCIAMACHY is overall as expected from the on-ground 20
calibration and characterization activities (Bovensmann et al.,2004). One exception is the time dependent optical throughput variation in the SCIAMACHY NIR channels 7 and 8 due to ice build-up. This effect is minimised by regular heating of the instrument (Bovensmann et al.,2004).
ACPD
4, 2805–2837, 2004 Carbon monoxide from SCIAMACHY M. Buchwitz et al. Title Page Abstract Introduction Conclusions References Tables Figures J I J I Back CloseFull Screen / Esc
Print Version Interactive Discussion
© EGU 2004
3. Pre-processing of SCIAMACHY spectra
The SCIAMACHY spectra used for this study are the ENVISAT operational Level 1 data products. Because the calibration is currently not optimal (especially in the NIR) no products have been officially released yet. During the commissioning phase of EN-VISAT (first six month of the mission) it has been identified that the in-orbit dark signal 5
measurement strategy of SCIAMACHY needs to be improved for accurate calibration of the NIR channels. Better dark signal measurements are being performed since end of 2002. They are included in the Level 1 data products but are not used by the current version of the Level 0-1 processor.
For this study we have “patched” the binary Level 1 data files, i.e. essentially replaced 10
the standard dark signals used for calibration by the improved ones, which resulted in significantly better WFM-DOAS fits. This improvement is of critical importance, as the CO absorption lines are weak. The depth of a CO line as observed by SCIAMACHY is typically only slightly above the instrument noise level. In order to further improve the calibration we are using a correction for analog to digital converter (ADC) non-linearities 15
(Kleipool,2003) not yet considered in operational Level 0-1 processing.
The channel 8 detector array is very inhomogeneous with respect to detector pixel physical properties such as quantum efficiency and dark signal which vary strongly from pixel to pixel. Several pixels are not useful at all (“dead pixels”) and have been excluded in the WFM-DOAS fits. We have extended the “dead pixels mask” of the Level 20
1 data product to reject additional pixels which resulted in strong spikes in the solar and/or nadir spectra obviously related to instrument artifacts. In addition, especially over scenes having low surface reflectivity, e.g. over ocean outside sun-glint conditions, the nadir spectra often contain unphysical (negative) radiance values, mainly in spectral regions of strong methane and water vapour absorption bands. They have also been 25
excluded in the WFM-DOAS fits. In order to compensate for an obvious wavelength shift of the SCIAMACHY nadir spectra in the considered spectral range (Bovensmann et al., 2004) we subtract 0.3 nm from the wavelength as given in the Level 1 data
ACPD
4, 2805–2837, 2004 Carbon monoxide from SCIAMACHY M. Buchwitz et al. Title Page Abstract Introduction Conclusions References Tables Figures J I J I Back CloseFull Screen / Esc
Print Version Interactive Discussion
© EGU 2004 product.
The calibration of the solar reference spectra as contained in the Level 1 data prod-ucts is also preliminary. For this study a solar reference spectrum with an improved calibration has been used. This spectrum has been generated and made available by ESA (provided by Johannes Frerick, ESA/ESTEC).
5
4. The WFM-DOAS retrieval algorithm
The Weighting Function Modified Differential Optical Absorption Spectroscopy (WFM-DOAS) retrieval algorithm has been developed mainly for the retrieval of total columns of CO, CH4, CO2, H2O, and N2O, from the SCIAMACHY NIR nadir spectra (Buchwitz et al.,2000a;Buchwitz and Burrows,2004). WFM-DOAS, however, is not limited to 10
this application and has also been successfully applied to ozone total column retrieval using GOME data (Coldewey-Egbers et al.,2004) and to water vapour retrieval using GOME and SCIAMACHY nadir spectra around 700 nm (No ¨el,2004).
WFM-DOAS is based on fitting the logarithm of a linearized radiative transfer model
Imod plus a low-order polynomial P to the logarithm of the ratio of a measured nadir 15
radiance and solar irradiance spectrum, i.e. observed sun-normalized radiance Iobs. The linear least-squares WFM-DOAS equation can be written as follows (fit parameters are underlined): ln I obs i − ln I mod i ( ˆV ) 2 ≡ kRE Sik 2 → mi n., (1)
where the linearized radiative transfer model is given by 20 ln Iimod( ˆV )= ln Iimod( ¯V )+ J X j=1 ∂ ln Iimod ∂Vj V¯ j × ( ˆVj − ¯Vj)+ Pi(am). (2)
Index i refers to the center wavelength λi of detector pixel number i . The components of vectors V , denoted V , are the vertical columns of all trace gases which have
absorp-ACPD
4, 2805–2837, 2004 Carbon monoxide from SCIAMACHY M. Buchwitz et al. Title Page Abstract Introduction Conclusions References Tables Figures J I J I Back CloseFull Screen / Esc
Print Version Interactive Discussion
© EGU 2004 tion lines in the selected spectral fitting window (here: CO, CH4, and H2O). The fit
pa-rameters are the desired trace gas vertical columns ˆVj and the polynomial coefficients
am. An additional fit parameters also used (but omitted in Eqs. 1 and 2) is the shift (in Kelvin) of a pre-selected temperature profile. This fit parameter has been added in order to take the temperature dependence of the trace gas absorption cross-sections 5
into account. The fit parameter values are determined by minimizing (in linear least-squares sense) the difference between observation (ln Iiobs) and WFM-DOAS model (ln Iimod), i.e. fit residuum RE Si, for all spectral points λi simultaneously. A deriva-tive, or weighting function, with respect to a vertical column refers to the change of the top-of-atmosphere radiance caused by a change (here: scaling) of a pre-selected 10
trace gas vertical profile. The WFM-DOAS reference spectra are the logarithm of the sun-normalized radiance and its derivatives. They are computed with a radiative trans-fer model (Buchwitz et al.,2000b) for assumed (e.g. climatological) “mean” columns ¯V .
Multiple scattering is fully taken into account. The least-squares problem (Eqs. 1 and 2) can also be expressed in the following vector/matrix notation: Minimizeky−A xk2with 15
respect to x. The solution is ˆx= CxATy where Cx≡ (ATA)−1 is the covariance matrix of solution ˆx. The errors of the retrieved columns are estimated as follows (Press et al.,1992): σVˆ j= q (Cx)j j×P i RE S 2
i /(m − n), where (Cx)j jis the j -th diagonal element
of the covariance matrix, m is the number of spectral points in the fitting window and n is the number of linear fit parameters (RE Si is the spectral fit residuum, see Eq. 1). 20
In order to avoid time consuming on-line radiative transfer simulations, a look-up table approach has been implemented (see Buchwitz and Burrows, 2004, for details). The WFM-DOAS reference spectra (radiance and derivatives) have been computed for cloud free conditions assuming a US Standard Atmosphere, a tropospheric maritime and stratospheric background aerosol scenario and a surface albedo of 0.1. They de-25
pend on solar zenith angle, surface elevation, and water vapor column. An error analy-sis has been performed by applying WFM-DOAS to simulated nadir spectra (Buchwitz and Burrows, 2004; Buchwitz et al.,2000a). The CO column retrieval random error
ACPD
4, 2805–2837, 2004 Carbon monoxide from SCIAMACHY M. Buchwitz et al. Title Page Abstract Introduction Conclusions References Tables Figures J I J I Back CloseFull Screen / Esc
Print Version Interactive Discussion
© EGU 2004 (precision) due to instrument noise is ∼20% (1-sigma) for the CO spectral fitting
win-dow used for this study (solar zenith angle 50◦, albedo 0.1). The more systematic errors introduced by, e.g. the currently implemented look-up table scheme, are typically below 10% for all cases investigated, covering error sources such as the variability of temper-ature and water vapour profiles, aerosols, sub-visual cirrus clouds, and albedo effects. 5
It is important to point out that no a priori information is used to constrain the retrieved columns. A priori information on the atmosphere is only used to get a reasonable linearization point for the unconstrained linear least-squares WFM-DOAS fit.
5. Sensitivity to boundary layer CO
The advantage of the near-IR spectral region, in contrast to, e.g. the thermal IR region, 10
is that the radiation detected by a nadir viewing satellite instrument is highly sensitive for trace gas concentration changes even in the boundary layer. In order to demon-strate this for SCIAMACHY CO observations, so called CO vertical column averaging kernels have been computed as shown in Fig.1. For this purpose WFM-DOAS has been applied to simulated nadir spectra generated for an unperturbed as well as for 15
perturbed CO profiles. A perturbed CO profile has been generated from the unper-turbed profile by adding a certain (constant) number of CO molecules at a given altitude level. The averaging kernels (AK) are defined as follows: AK (z)≡(Vrp−Vtu)/(Vtp−Vtu), where Vtuis the true CO column for the unperturbed CO profile, and Vtp and Vrp are the true and retrieved CO columns of the perturbed CO profiles (having an enhanced 20
CO concentration at altitude z), respectively. Figure 1indicates that the sensitivity of the SCIAMACHY nadir measurements for solar zenith angles less than ∼70◦ is nearly equally high at all altitudes below ∼100 hPa (∼16 km), including the boundary layer.
ACPD
4, 2805–2837, 2004 Carbon monoxide from SCIAMACHY M. Buchwitz et al. Title Page Abstract Introduction Conclusions References Tables Figures J I J I Back CloseFull Screen / Esc
Print Version Interactive Discussion
© EGU 2004
6. Retrieval results
WFM-DOAS has been applied to several days of SCIAMACHY data covering the time periode January 2003 to October 2003. The days have been selected based on the following criteria: (i) availability of (nearly) all 14 ENVISAT orbits for that day as SCIA-MACHY Level 1 consolidated orbit (i.e. entire orbits) product files, and (ii) good overlap 5
of ENVISAT with TERRA orbits to enable an accurate comparison with MOPITT. The depth of the fitted CO absorption lines as determined by WFM-DOAS seems to be about a factor of two too deep resulting in systematically too high CO columns. This is most probably related to the difficulty of accurately fitting the CO absorption lines (see WFM-DOAS spectral fits in the following subsection). As will be shown, the 10
fit residuals are dominated by systematic spectral artifacts on the order of the weak CO lines. The artifacts are most pronounced in spectral regions of strong overlapping methane and water vapour absorption bands. They might result from spectrometer slit function uncertainties. In order to compensate for this, all WFM-DOAS Version 0.4 CO columns presented in this paper have been multiplied by a constant and scene 15
independent scaling factor of 0.5. 6.1. Spectral WFM-DOAS fits
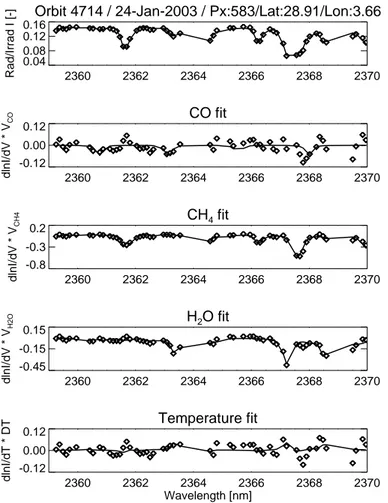
A typical WFM-DOAS CO fit is shown in Fig.2. In addition to CO, methane and water vapour spectral absorption features (i.e. radiance derivatives or weighting functions) have been included in the fit. As can be seen, the methane and water absorption 20
features are much stronger than the weak CO absorption lines, which modulate the upwelling radiance by only a few percent. The top panel shows the measured (symbols) and modelled (line) sun-normalized radiances. The CO absorption lines are difficult to identify in the top panel because they are weak. As already explained, a temperature shift parameter and a low order polynomial (not shown) are also included.
25
Figure3shows WFM-DOAS fit results for the eight consecutive nadir measurements of one east to west scan. As can be seen (most clearly in the middle panel), the fit
ACPD
4, 2805–2837, 2004 Carbon monoxide from SCIAMACHY M. Buchwitz et al. Title Page Abstract Introduction Conclusions References Tables Figures J I J I Back CloseFull Screen / Esc
Print Version Interactive Discussion
© EGU 2004 residuals for the different ground pixels are nearly identical. This means that the fit
residuals are currently not signal-to-noise limited but dominated by systematic spectral artifacts on the order of the weak CO absorption lines. Further investigation is needed in order to find out what the reason for these artifacts is (e.g. by analysing time series). They are clearly related to the strong methane and water vapour absorption features 5
(see Fig.2) and, therefore, might be caused by inaccurate knowledge of the instrument slit function and/or uncertainties of the spectroscopic line parameters (Rothmann et al., 2003). The error bars of the retrieved CO columns of approximately ±30% for single measurements as shown in the bottom panel of Fig.3have been calculated as described in Sect. 4, i.e. they are proportional to the root-sum-square of the spectral fit 10
residuum and, therefore, not only reflect noise but also systematic components. In this sense they are a very conservative estimate of the CO column retrieval precision.
Initial information on the SCIAMACHY slit function has been derived from various studies performed during the on ground calibration of SCIAMACHY. As each absorp-tion line is only sampled by a small number of detector pixels (typically two per full width 15
of half maximum (FWHM)) it is not trivial to accurately determine the slit function (i.e. its type and corresponding parameters). Because of this, the recommendations given by the different studies were not necessarily identical. Furthermore, analysis of the SCIA-MACHY in-flight data by SRON (Hans Schrijver, personal communication) indicates that the slit function in channel 8 is different from the one measured pre-flight. There-20
fore, various slit functions have been investigated using WFM-DOAS retrievals. The slit function that has been used for this study is the one that resulted in best fits, i.e., small-est fit residuals. The one finally selected is: f (λ−λ◦)=(1 + (2 (λ−λ◦)/F W HM)E X P)−1, with parameters F W HM=0.24 nm and EX P =2.7. When using this function for the convolution of the high resolution reference spectra, it is numerically integrated and 25
ACPD
4, 2805–2837, 2004 Carbon monoxide from SCIAMACHY M. Buchwitz et al. Title Page Abstract Introduction Conclusions References Tables Figures J I J I Back CloseFull Screen / Esc
Print Version Interactive Discussion
© EGU 2004 6.2. Cloud identification
The WFM-DOAS algorithm as described in Sect. 4 is strictly speaking only appropriate for cloud free scenes. Despite of this, when processing entire orbits, WFM-DOAS is typically also applied to cloud contaminated pixels. This results in errors on the retrieved columns if interpreted as total columns as for cloudy scenes most probably 5
sub-columns from cloud top upwards are retrieved. Therefore, it is important to at least identify the cloud free pixels. For this purpose a cloud mask is generated (0: pixel probably cloud free, 1: pixel probably cloud contaminated).
Currently, this cloud mask is generated using the sub-pixel information provided by SCIAMACHY’s Polarisation Measurement Device (PMD) number 1 covering approxi-10
mately the spectral region 320–380 nm (Bovensmann et al., 1999). A simple single threshold algorithm is used. The algorithm works as follows: First, each interpolated PMD 1 readout as contained in the Level 1 file (32 values per one second integration time) that corresponds to a given (main channel) ground pixel is divided by the co-sine of the solar zenith angle to obtain a quantity approximately proportional to top-of-15
atmosphere reflectivity. If this “PMD 1 reflectivity” is higher than a pre-defined threshold the corresponding sub-pixel is assumed to be cloud contaminated. A (main channel) ground pixel is flagged cloud contaminated if one or more of its PMD sub-pixels is cloud contaminated.
PMD 1 has been selected for the cloud mask generation because the scattered 20
and reflected solar UV radiation detected by SCIAMACHY’s nadir mode penetrates deep into the atmosphere (that is, the average scattering height is located close to the Earth surface) but the sensitivity to the Earth surface is significantly lower than for the other PMD channels lying in the visible and NIR spectral regions because scattering in the atmosphere decreases with increasing wavelength. This effect can be seen when 25
comparing global maps showing the signal of the various PMDs. For example, a land to sea contrast is (nearly) not visible for PMD 1 but clearly visible for the other PMDs (not shown here). The optimum threshold has been determined empirically by visual
ACPD
4, 2805–2837, 2004 Carbon monoxide from SCIAMACHY M. Buchwitz et al. Title Page Abstract Introduction Conclusions References Tables Figures J I J I Back CloseFull Screen / Esc
Print Version Interactive Discussion
© EGU 2004 inspection of global maps of PMD 1 reflectivities. As an example, Fig.4shows a PMD
1 map for 24 January 2003.
6.3. Global CO column retrieval results
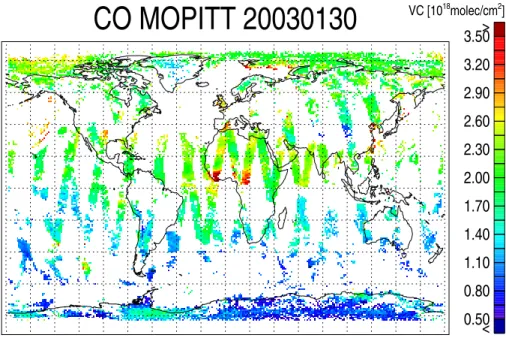
Figure 5 shows the operational CO column data product of MOPITT (Deeter et al., 2003) for 27 October 2003. Figure6shows the same data but focussing on a region in 5
mid-east Africa where a large plume of CO due to biomass burning is visible in the MO-PITT data. Figure7shows the same plume as retrieved by SCIAMACHY/WFM-DOAS. Similar good agreement between MOPITT and SCIAMACHY has also been observed for other days, as shown in this section (Figs.5–18). In order to facilitate a quantitative comparison with MOPITT, all data available for a given day have been mapped onto a 10
0.5◦ by 0.5◦ latitude/longitude grid. The comparison shows good agreement between MOPITT and SCIAMACHY. For cloud free pixels over land the correlation between MOPITT and SCIAMACHY CO columns is typically in the range r=0.4–0.7, where r is Pearsons linear correlation coefficient.
7. Conclusions
15
Global CO columns as retrieved from SCIAMACHY nadir spectra using the WFM-DOAS retrieval algorithm have been presented. To accomplish this, the calibration of the SCIAMACHY operational Level 1 data products (nadir spectra) had to be im-proved mainly with respect to a better dark signal correction. The SCIAMACHY CO columns show good agreement with the CO column data product of MOPITT (V3) on-20
board EOS-TERRA. For example, elevated atmospheric CO concentrations due to, e.g. biomass burning events also seen by MOPITT, are clearly detectable in the SCIA-MACHY CO data. The systematic validation of the data by ground based measure-ments has started. Further investigations are required to clarify the meaning of the constant and ground scene independent scaling factor derived from the MOPITT inter-25
ACPD
4, 2805–2837, 2004 Carbon monoxide from SCIAMACHY M. Buchwitz et al. Title Page Abstract Introduction Conclusions References Tables Figures J I J I Back CloseFull Screen / Esc
Print Version Interactive Discussion
© EGU 2004 comparison taking into account the different sensitivities of the thermal IR and near-IR
(short wave IR) measurements to CO in the lowest troposphere and remaining un-certainties in the spectral fitting due to an imperfect knowledge of the instrument slit function and/or spectroscopic parameters. The SCIAMACHY WFM-DOAS Version 0.4 CO column data products presented and discussed in this paper are available from 5
http://www.iup.physik.uni-bremen.de/sciamachy/NIR NADIR WFM DOAS/.
Acknowledgements. This study would not have been possible without the work of many
peo-ple who dedicated their efforts over many years to the success of the SCIAMACHY/ENVISAT mission. It is impossible to thank all of them by name but we would like to mention at least a few of them. We are grateful to C. Chlebek, DLR-Bonn, R. van Konijnenburg and J.
Car-10
pay, NIVR, and their teams and the ESA/ESTEC team, who succesfully managed the SCIA-MACHY/ENVISAT project. Thanks also to SRON, The Netherlands, especially R. Hoogeveen, who were responsible for the SCIAMACHY near-infrared detectors. We also thank A. von Bargen and his team at DLR-Oberpfaffenhofen, and J. Frerick, ESA/ESTEC, for their efforts related to operational Level 0-1 processing. Thanks also to A. G. Straume, SRON, for
pro-15
viding us with an IDL tool that permitted easy access to the MOPITT data, and H. Schrijver, SRON, who motivated us to focus our intention (again) on CO. The MOPITT data have been obtained via internet from the NASA Langley Research Center Atmospheric Sciences Data Center (http://eosweb.larc.nasa.gov/PRODOCS/mopitt/table mopitt.html). We also thank our formerly colleague M. Eisinger (now ESA/ESTEC) for the source code of the DOAS fitting
soft-20
ware “kvant” which formed the basis of the WFM-DOAS retrieval program. Last but not least we would like to thank our funding agencies: Funding came from the German Ministry for Re-search and Education (BMBF) via DLR-Bonn (Grants 50EE0027 and 50EE9901) and GSF/PT-UKF (Grant 07UFE12/8), the European Commission (5th Framework Programme on Energy, Environment and Sustainable Development, Contract no. EVG1-CT-2002-00079, project
EV-25
ERGREEN), and by the University and the State of Bremen.
References
Bergamaschi, P., Hein, R., Heimann, M., and Crutzen, P. J.: Inverse modeling of the global CO cycle, 1. Inversion of CO mixing ratios, J. Geophys. Res., 105, 1909–1927, 2000. 2807
ACPD
4, 2805–2837, 2004 Carbon monoxide from SCIAMACHY M. Buchwitz et al. Title Page Abstract Introduction Conclusions References Tables Figures J I J I Back CloseFull Screen / Esc
Print Version Interactive Discussion
© EGU 2004 Bovensmann, H., Burrows, J. P., Buchwitz, M., Frerick, J., No ¨el, S., Rozanov, V. V., Chance, K.
V., and Goede, A.: SCIAMACHY – Mission Objectives and Measurement Modes, J. Atmos. Sci., 56, 127–150, 1999. 2808,2815
Bovensmann, H., Buchwitz, M., Frerick, J., Hoogeveen, R., Kleipool, Q., Lichtenberg, G., No ¨el, S., Richter, A., Rozanov, A., Rozanov, V. V., Skupin, J., von Savigny, C., Wuttke, M., and
5
Burrows, J. P.: SCIAMACHY on ENVISAT: In-flight optical performance and first results, in Remote Sensing of Clouds and the Atmosphere VIII, edited by Sch ¨afer, K. P., Com `eron, A., Carleer, M. R., and Picard, R. H., vol. 5235 of Proceedings of SPIE, 160–173, 2004. 2808, 2809
Buchwitz, M. and Burrows, J. P.: Retrieval of CH4, CO, and CO2 total column amounts from
10
SCIA-MACHY nearinfrared nadir spectra: Retrieval algorithm and first results, in Remote Sensing of Clouds and the Atmosphere VIII, edited by Sch ¨afer, K. P., Com `eron, A., Carleer, M. R., and Picard, R. H., vol. 5235 of Proceedings of SPIE, 375–388, 2004. 2810,2811 Buchwitz, M., Rozanov, V. V., and Burrows, J. P.: A near infrared optimized DOAS method
for the fast global retrieval of atmospheric CH4, CO, CO2, H2O, and N2O total column
15
amounts from SCIAMACHY/ENVISAT-1 nadir radiances, J. Geophys. Res., 105, 15 231– 15 246, 2000a. 2810,2811
Buchwitz, M., Rozanov, V. V., and Burrows, J. P.: A correlated-k distribution scheme for overlap-ping gases suitable for retrieval of atmospheric constituents from moderate resolution ra-diance measurements in the visible/near-infrared spectral region, J. Geophys. Res., 105,
20
15 247–15 262, 2000b. 2811
Clerbaux, C., Hadju-Lazaro, J., Turquety, S., Megie, G., and Coheur, P. F.: Trace gas measure-ments from infrared satellite for chemistry and climate applications, Atmos. Chem. Phys., 3, 1495–1508, 2003. 2807
Coldewey-Egbers, M., Weber, M., Buchwitz, M., and Burrows, J. P.: Application of a modified
25
DOAS method for total ozone retrieval from GOME data at high polar latitudes, Adv. Space Res., in press, 2004. 2810
Deeter, M. N., Emmons, L. K., Francis, G. L., Edwards, D. P., Gille, J. C., Warner, J. X., Khat-tatov, B., Ziskin, D., Lamarque, J.-F., Ho, S.-P., Yuding, V., Attie, J.-L., Packman, D., Chen, J., Mao, D., and Drummond, J. R.: Operational carbon monoxide retrieval algorithm and
se-30
lected results for the MOPITT instrument, J. Geophys. Res., 108, 4399–4409, 2003. 2807, 2816
ACPD
4, 2805–2837, 2004 Carbon monoxide from SCIAMACHY M. Buchwitz et al. Title Page Abstract Introduction Conclusions References Tables Figures J I J I Back CloseFull Screen / Esc
Print Version Interactive Discussion
© EGU 2004 Res., 105, 12 123–12 147, 2000. 2806
Kleipool, Q.: SCIAMACHY: Recalculation of OPTEC5 Non-Linearity, Tech. Rep. SRON-SCIA-PhE- RP-013 (available from the author ([email protected]), SRON, Utrecht, The Nether-lands, 2003. 2809
Kobayashi, H., Shimota, A., Kondo, K., Okumura, E., Kameda, Y., Shimoda, H., and Ogawa,
5
T.: Development and evaluation of the Interferometric Monitor for Greenhouse Gases: a high throughput Fourier transform infrared radiometer for nadir Earth observations, Appl. Opt., 38, 6801–6807, 1999. 2807
No ¨el, S., Buchwitz, M., and Burrows, J. P.: First retrieval of global water vapour column amounts from SCIAMACHY measurements, Atmos. Chem. Phys., 4, 111–125, 2004. 2810
10
Press, W., Teukolsky, S., Vetterling, W., and Flannery, B.: Numerical Recipes in Fortran, Cam-bridge University Press, London, 1992. 2811
Reichle Jr., H. G., Anderson, B. E., Connors, V. S., Denkins, T. C., Forbes, D. A., Gormsen, B. B., Langenfels, R. L., Neil, D. O., Nolf, S. R., Novelli, P. C., Pougatchev, N. S., Roell, M. M., and Steele, L. P.: Space shuttle based global CO measurements during April and October
15
1994, MAPS instrument, data reduction, and data validation, J. Geophys. Res., 104, 21 443– 21 454, 1999. 2807
Rothman, L. S., Barbe, A., Benner, D. C., Brown, L. R., Camy-Peyret, C., Carleer, M. R., Chance, K., Clerbaux, C., Dana, V., Devi, V. M., Fayt, A., Flaud, J. M., Gamache, R. R., Goldman, A., Jacquemart, D., Jucks, K. W., Lafferty, W. J., Mandin, J. Y., Massie, S. T.,
20
Nemtchinov, V., Newnham, D. A., Perrin, A., Rinsland, C. P., Schroeder, J., Smith, K. M., Smith, M. A. H., Tang, K., Toth, R. A., Vander Auwera, J., Varanasi, P., and Yoshino, K.: The HITRAN molecular spectroscopic database: edition of 2000 including updates through 2001, J. Quant. Spectrosc. Radiat. Transfer, 82, 5–44, 2003. 2814
ACPD
4, 2805–2837, 2004 Carbon monoxide from SCIAMACHY M. Buchwitz et al. Title Page Abstract Introduction Conclusions References Tables Figures J I J I Back CloseFull Screen / Esc
Print Version Interactive Discussion
© EGU 2004
Fig. 1. SCIAMACHY CO column averaging kernels computed by applying WFM-DOAS to
ACPD
4, 2805–2837, 2004 Carbon monoxide from SCIAMACHY M. Buchwitz et al. Title Page Abstract Introduction Conclusions References Tables Figures J I J I Back CloseFull Screen / Esc
Print Version Interactive Discussion
© EGU 2004
Orbit 4714 / 24-Jan-2003 / Px:583/Lat:28.91/Lon:3.66
2360 2362 2364 2366 2368 2370 0.04 0.08 0.12 0.16 Rad/Irrad I [-] CO fit 2360 2362 2364 2366 2368 2370 -0.12 0.00 0.12 dlnI/dV * V CO CH4 fit 2360 2362 2364 2366 2368 2370 -0.8 -0.3 0.2 dlnI/dV * V CH4 H2O fit 2360 2362 2364 2366 2368 2370 -0.45 -0.15 0.15 dlnI/dV * V H2O Temperature fit 2360 2362 2364 2366 2368 2370 Wavelength [nm] -0.12 0.00 0.12 dlnI/dT * DT
Fig. 2. Typical WFM-DOAS CO fit for a cloud free scene over North Africa (Sahara) measured
on 24 January 2003. The retrieved CO column is 2.19·1018molecules/cm2 ±30%. The root mean square relative difference between measurement (square symbols in top panel) and WFM-DOAS model (solid line in top panel) is 0.028.
ACPD
4, 2805–2837, 2004 Carbon monoxide from SCIAMACHY M. Buchwitz et al. Title Page Abstract Introduction Conclusions References Tables Figures J I J I Back CloseFull Screen / Esc
Print Version Interactive Discussion
© EGU 2004
Fig. 3. Similar WFM-DOAS fit results as shown in Fig.2but for the eight consecutive ground pixels of one east to west scan. The top panel shows (individual and average) fitted CO ab-sorption lines and the CO fit residuals, defined as the fitted CO abab-sorption plus fit residuum, i.e. difference between model and measurement after the fit. The eight fit residuals are shown in the middle panel. The bottom panel shows the retrieved CO columns including error bars.
ACPD
4, 2805–2837, 2004 Carbon monoxide from SCIAMACHY M. Buchwitz et al. Title Page Abstract Introduction Conclusions References Tables Figures J I J I Back CloseFull Screen / Esc
Print Version Interactive Discussion
© EGU 2004
Fig. 4. SCIAMACHY PMD 1 nadir reflectivity for 24 January 2003 (color code: white= high
ACPD
4, 2805–2837, 2004 Carbon monoxide from SCIAMACHY M. Buchwitz et al. Title Page Abstract Introduction Conclusions References Tables Figures J I J I Back CloseFull Screen / Esc
Print Version Interactive Discussion
© EGU 2004
Fig. 5. CO columns as measured by MOPITT on 27 October 2003 (Figure downloaded from:
ACPD
4, 2805–2837, 2004 Carbon monoxide from SCIAMACHY M. Buchwitz et al. Title Page Abstract Introduction Conclusions References Tables Figures J I J I Back CloseFull Screen / Esc
Print Version Interactive Discussion © EGU 2004
CO MOPITT 20031027
< 1.00 1.20 1.40 1.60 1.80 2.00 2.20 2.40 2.60 2.80 3.00 > < 1.00 1.20 1.40 1.60 1.80 2.00 2.20 2.40 2.60 2.80 3.00 > VC [1018molec./cm2]MOP02−20031027−L2V5.9.2.prov.hdf gridded/plotted by [email protected]−bremen.de
Fig. 6. The same MOPITT data as shown in Fig.5but mapped on a 0.5◦×0.5◦latitude/longitude grid. Shown is a region in Africa where a large plume of CO due to biomass burning has been detected by MOPITT.
ACPD
4, 2805–2837, 2004 Carbon monoxide from SCIAMACHY M. Buchwitz et al. Title Page Abstract Introduction Conclusions References Tables Figures J I J I Back CloseFull Screen / Esc
Print Version Interactive Discussion © EGU 2004
CO SCIA/WFMD 20031027
< 1.00 1.20 1.40 1.60 1.80 2.00 2.20 2.40 2.60 2.80 3.00 > < 1.00 1.20 1.40 1.60 1.80 2.00 2.20 2.40 2.60 2.80 3.00 > VC [1018molec./cm2] [email protected]−bremen.de (WFMDv0.4)ACPD
4, 2805–2837, 2004 Carbon monoxide from SCIAMACHY M. Buchwitz et al. Title Page Abstract Introduction Conclusions References Tables Figures J I J I Back CloseFull Screen / Esc
Print Version Interactive Discussion © EGU 2004
CO MOPITT 20030130
< 0.50 0.80 1.10 1.40 1.70 2.00 2.30 2.60 2.90 3.20 3.50 > < 0.50 0.80 1.10 1.40 1.70 2.00 2.30 2.60 2.90 3.20 3.50 > VC [1018molec/cm2]MOP02−20030130−L2V5.9.2.prov.hdf gridded/plotted by [email protected]−bremen.de
ACPD
4, 2805–2837, 2004 Carbon monoxide from SCIAMACHY M. Buchwitz et al. Title Page Abstract Introduction Conclusions References Tables Figures J I J I Back CloseFull Screen / Esc
Print Version Interactive Discussion © EGU 2004
CO SCIA/WFMD 20030130
< 0.50 0.80 1.10 1.40 1.70 2.00 2.30 2.60 2.90 3.20 3.50 > < 0.50 0.80 1.10 1.40 1.70 2.00 2.30 2.60 2.90 3.20 3.50 > VC [1018molec./cm2] [email protected]−bremen.de (WFMDv0.4, gridded 0.5x0.5)Fig. 10. CO columns as measured by SCIAMACHY/WFM-DOAS on 30 January 2003. Shown
ACPD
4, 2805–2837, 2004 Carbon monoxide from SCIAMACHY M. Buchwitz et al. Title Page Abstract Introduction Conclusions References Tables Figures J I J I Back CloseFull Screen / Esc
Print Version Interactive Discussion © EGU 2004
CO SCIA/WFMD/cf 20030130
< 0.50 0.80 1.10 1.40 1.70 2.00 2.30 2.60 2.90 3.20 3.50 > < 0.50 0.80 1.10 1.40 1.70 2.00 2.30 2.60 2.90 3.20 3.50 > VC [1018molec./cm2] [email protected]−bremen.de (WFMDv0.4, gridded 0.5x0.5)ACPD
4, 2805–2837, 2004 Carbon monoxide from SCIAMACHY M. Buchwitz et al. Title Page Abstract Introduction Conclusions References Tables Figures J I J I Back CloseFull Screen / Esc
Print Version Interactive Discussion
© EGU 2004
ACPD
4, 2805–2837, 2004 Carbon monoxide from SCIAMACHY M. Buchwitz et al. Title Page Abstract Introduction Conclusions References Tables Figures J I J I Back CloseFull Screen / Esc
Print Version Interactive Discussion
© EGU 2004
ACPD
4, 2805–2837, 2004 Carbon monoxide from SCIAMACHY M. Buchwitz et al. Title Page Abstract Introduction Conclusions References Tables Figures J I J I Back CloseFull Screen / Esc
Print Version Interactive Discussion © EGU 2004
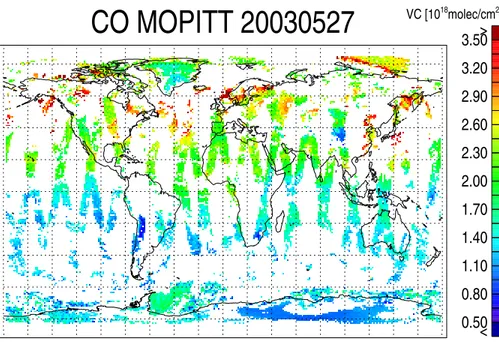
CO MOPITT 20030527
< 0.50 0.80 1.10 1.40 1.70 2.00 2.30 2.60 2.90 3.20 3.50 > < 0.50 0.80 1.10 1.40 1.70 2.00 2.30 2.60 2.90 3.20 3.50 > VC [1018molec/cm2]MOP02−20030527−L2V5.7.2.prov.hdf gridded/plotted by [email protected]−bremen.de
ACPD
4, 2805–2837, 2004 Carbon monoxide from SCIAMACHY M. Buchwitz et al. Title Page Abstract Introduction Conclusions References Tables Figures J I J I Back CloseFull Screen / Esc
Print Version Interactive Discussion © EGU 2004
CO SCIA/WFMD 20030527
< 0.50 0.80 1.10 1.40 1.70 2.00 2.30 2.60 2.90 3.20 3.50 > < 0.50 0.80 1.10 1.40 1.70 2.00 2.30 2.60 2.90 3.20 3.50 > VC [1018molec./cm2] [email protected]−bremen.de (WFMDv0.4, gridded 0.5x0.5)Fig. 15. CO columns as measured by SCIAMACHY/WFM-DOAS on 27 May 2003. Shown are
ACPD
4, 2805–2837, 2004 Carbon monoxide from SCIAMACHY M. Buchwitz et al. Title Page Abstract Introduction Conclusions References Tables Figures J I J I Back CloseFull Screen / Esc
Print Version Interactive Discussion © EGU 2004
CO SCIA/WFMD/cf 20030527
< 0.50 0.80 1.10 1.40 1.70 2.00 2.30 2.60 2.90 3.20 3.50 > < 0.50 0.80 1.10 1.40 1.70 2.00 2.30 2.60 2.90 3.20 3.50 > VC [1018molec./cm2] [email protected]−bremen.de (WFMDv0.4, gridded 0.5x0.5)ACPD
4, 2805–2837, 2004 Carbon monoxide from SCIAMACHY M. Buchwitz et al. Title Page Abstract Introduction Conclusions References Tables Figures J I J I Back CloseFull Screen / Esc
Print Version Interactive Discussion
© EGU 2004
Fig. 17. Correlation between SCIAMACHY and MOPITT CO columns over land for 27 May
ACPD
4, 2805–2837, 2004 Carbon monoxide from SCIAMACHY M. Buchwitz et al. Title Page Abstract Introduction Conclusions References Tables Figures J I J I Back CloseFull Screen / Esc
Print Version Interactive Discussion
© EGU 2004