HAL Id: hal-00295534
https://hal.archives-ouvertes.fr/hal-00295534
Submitted on 30 Sep 2004
HAL is a multi-disciplinary open access
archive for the deposit and dissemination of
sci-entific research documents, whether they are
pub-lished or not. The documents may come from
teaching and research institutions in France or
abroad, or from public or private research centers.
L’archive ouverte pluridisciplinaire HAL, est
destinée au dépôt et à la diffusion de documents
scientifiques de niveau recherche, publiés ou non,
émanant des établissements d’enseignement et de
recherche français ou étrangers, des laboratoires
publics ou privés.
SCIAMACHY by WFM-DOAS
M. Buchwitz, R. de Beek, K. Bramstedt, S. Noël, H. Bovensmann, J. P.
Burrows
To cite this version:
M. Buchwitz, R. de Beek, K. Bramstedt, S. Noël, H. Bovensmann, et al.. Global carbon monoxide
as retrieved from SCIAMACHY by WFM-DOAS. Atmospheric Chemistry and Physics, European
Geosciences Union, 2004, 4 (7), pp.1945-1960. �hal-00295534�
www.atmos-chem-phys.org/acp/4/1945/
SRef-ID: 1680-7324/acp/2004-4-1945
Chemistry
and Physics
Global carbon monoxide as retrieved from SCIAMACHY by
WFM-DOAS
M. Buchwitz, R. de Beek, K. Bramstedt, S. No¨el, H. Bovensmann, and J. P. Burrows Institute of Environmental Physics (iup), University of Bremen FB1, Bremen, Germany Received: 18 March 2004 – Published in Atmos. Chem. Phys. Discuss.: 19 May 2004
Revised: 24 September 2004 – Accepted: 27 September 2004 – Published: 30 September 2004
Abstract. First results concerning the retrieval of tropo-spheric carbon monoxide (CO) from satellite solar backscat-ter radiance measurements in the near-infrared spectral
region (∼2.3 µm) are presented. The Weighting
Func-tion Modified (WFM) DOAS retrieval algorithm has been used to retrieve vertical columns of CO from SCIA-MACHY/ENVISAT nadir spectra. We present detailed re-sults for three days from the time periode January to Oc-tober 2003 selected to have good overlap with the daytime CO measurements of MOPITT onboard EOS Terra. Because the WFM-DOAS Version 0.4 CO columns presented in this paper are scaled by a constant factor of 0.5 to compensate for an obvious overestimation we focus on the variability of the retrieved columns rather than on their absolute values. It is shown that plumes of CO resulting from, e.g. biomass burning in Africa, are detectable with single overpass SCIA-MACHY data. Globally, the SCIASCIA-MACHY CO columns are in reasonable agreement with the Version 3 CO column data product of MOPITT. For example, for measurements over land, where the quality of the data is typically better than over ocean due to higher surface reflectivity, the standard devia-tion of the difference with respect to MOPITT is in the range
0.4–0.6×10¹⁸ molecules/cm2 and the linear correlation
co-efficient is between 0.4 and 0.7. The level of agreement be-tween the data of both sensors depends on time and location but is typically within 30% for most latitudes. In the southern hemisphere outside Antarctica SCIAMACHY tends to give systematically higher values than MOPITT. More studies are needed to find out what the reasons for the observed differ-ences with respect to MOPITT are and how the algorithm can be modified to improve the quality of the CO columns as retrieved from SCIAMACHY.
Correspondence to: M. Buchwitz
1 Introduction
Knowledge about the global distribution of CO is important for many reasons, e.g., because of its central role in tropo-spheric chemistry (Holloway et al., 2000): (i) CO is the lead-ing sink of the hydroxyl (OH) radical which itself largely determines the oxidizing capacity of the troposphere and, therefore, its self-cleansing efficiency, (ii) given sufficient
NOx, CO has great air quality impact as a precurser to
tro-pospheric ozone, a secondary pollutant associated with res-piratory problems and decreased crop yields, and (iii) as an atmospheric tracer with a relatively long lifetime of approx-imately two months it can be used as an indicator of how transport redistributes pollutants on a global scale. CO also plays an important role in our climate system as CO has a sig-nificant indirect global warming potential, mainly due to its
impact on the atmospheric CH4concentration but also due to
O3and CO2production (Bergamaschi et al., 2000). A
quan-tification of the CO distribution in the troposphere, including the boundary layer, is therefore of primary importance.
Here we present first results from the near-infrared (NIR) nadir measurements of SCIAMACHY onboard the European Space Agencies (ESA) environmental satellite ENVISAT ob-tained using the Weighting Function Modified Differential Optical Absorption Spectroscopy (WFM-DOAS) retrieval
al-gorithm. WFM-DOAS is a scientific retrieval algorithm
which is independent of the official operational algorithm of ESA. We show that reasonable CO columns can be retrieved from SCIAMACHY despite a number of issues that need fur-ther study and improvement.
Prior to the launch of SCIAMACHY only a small number of instruments have measured or are currently measuring at-mospheric CO on a global scale, e.g. MAPS (Measurement of Air Pollution from Satellite) on space shuttles in 1981, 1984, and 1994 (Reichle et al., 1999), IMG (Interferometric Monitor for Greenhouse gases) on ADEOS I from August 1996 to June 1997 (Kobayashi et al., 1999), and MOPITT
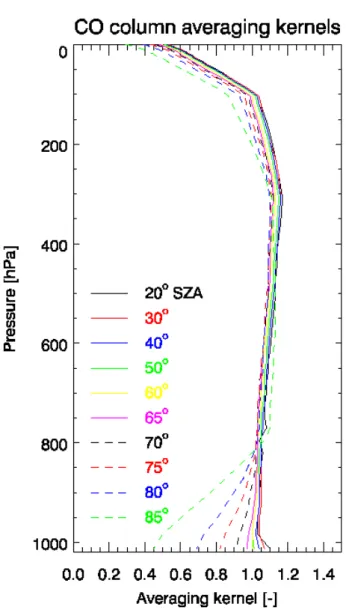
Fig. 1. SCIAMACHY CO column averaging kernels for various
solar zenith angles.
on EOS Terra since 1999 (Deeter et al., 2003). From all these nadir looking instruments CO concentrations have been derived from CO absorption of the Earth’s thermal infrared emission. These measurements can be performed during day and night and also enable the retrieval of vertical profiles (at low resolution). In general, thermal infrared (IR) nadir measurements of CO have their sensitivity maximum in the free troposphere. These measurements are very sensitive to the middle atmosphere but have only low sensitivity to the boundary layer (Deeter et al., 2003; Clerbaux et al., 2003; Emmons et al., 2004). Comparisons of MOPITT CO profiles (V3) with in situ measurements show biases up to about 40% (for the medians) in the lower troposphere below approxi-mately 700 hPa (Emmons et al., 2004). MOPITT has also channels in the near-infrared but due low observed signal-to-noise levels the currently released CO profile and column data products are derived from the thermal IR channels only.
In contrast, the NIR measurements of SCIAMACHY are nearly equally sensitive to all layers including the boundary layer. This is depicted by the averaging kernels shown in Fig. 1 (for details see Sect. 5). SCIAMACHY, therefore, has the potential to enhance our knowledge of lower tropospheric CO including its (surface) sources and sinks. Reaching this goal is not trivial because the CO line intensities in the NIR are much smaller then in the thermal IR (by about two orders of magnitude). This study presents first results obtained to achieve the goal of accurately measuring CO columns using NIR nadir satellite observations.
The paper is organized as follows: In Sect. 2 a short de-scription of the SCIAMACHY instrument is given. Section 3 summarizes how the SCIAMACHY spectra have been pprocessed before they are inverted by the WFM-DOAS re-trieval algorithm, which is described in Sect. 4. In Sect. 5 the vertical sensitivity of the SCIAMACHY measurements is discussed. The main part of this paper is Sect. 6 where the SCIAMACHY CO columns are presented and discussed. This includes a comparison with CO from MOPITT. Sec-tion 7 summarizes the initial results from the comparison with ground based measurements. The conclusions are given in Sect. 8.
2 The SCIAMACHY instrument
The SCanning Imaging Absorption spectroMeter for At-mospheric CHartographY (SCIAMACHY) instrument (Bur-rows et al., 1995; Bovensmann et al., 1999) is part of the atmospheric chemistry payload of the European Space Agen-cies (ESA) environmental satellite ENVISAT launched in March 2002. ENVISAT is in sun-synchronous low Earth orbit crossing the equator at 10:00 a.m. local time. SCIA-MACHY is a grating spectrometer that measures spectra of scattered, reflected, and transmitted solar radiation in the spectral region 240–2400 nm in nadir, limb, and solar and lunar occultation viewing modes. The SCIAMACHY NIR spectra contain information on many important atmospheric trace gases such as CO, CH4, CO2, and N2O.
For this study mainly channel 8 of SCIAMACHY is rel-evant. Channel 8 covers the spectral region 2260–2385 nm with one linear detector array (1024 detector pixels). The spectral resolution is ∼0.2 nm. The spatial resolution, i.e. the
footprint size of a single nadir measurement, is 30×120 km2
corresponding to an integration time of 0.5 s, except at high solar zenith angles (e.g. polar regions in summer hemi-sphere), where the pixel size is twice as large (30×240 km2). On the illuminated part of the Earth (dayside) SCIAMACHY mainly performs alternating limb and nadir observations (about one minute each). SCIAMACHY also performs di-rect (extraterrestrial) sun observations mainly to obtain the solar reference spectra needed for the retrieval.
The in-flight optical performance of SCIAMACHY is overall as expected from the on-ground calibration and
characterization activities (Bovensmann et al., 2004). One exception is the time dependent optical throughput variation in the SCIAMACHY NIR channels 7 and 8 due to ice build-up. This effect is minimised by regular heating of the in-strument (Bovensmann et al., 2004). For CO retrieval this effect is expected to result in time dependent precision varia-tions (for example, lower transmission result in lower signal and signal-to-noise ratios and, therefore, lower retrieval pre-cision) and might also introduce systematic errors, e.g., due to variations of the instrument slit function (more details are given in Sect. 6.1). Time series are currently being analysed to investigate how the ice-issue affects the CO retrieval.
3 Pre-processing of SCIAMACHY spectra
The SCIAMACHY spectra used for this study are the EN-VISAT operational Level 1 data products. Because the cal-ibration is currently not optimal (especially in the NIR) no products have been officially released yet. During the com-missioning phase of ENVISAT (the first six months of the mission) it has been identified that the in-orbit dark sig-nal measurement strategy of SCIAMACHY needs to be im-proved for accurate calibration of the NIR channels. Better dark signal measurements are being performed since end of 2002. They are included in the Level 1 data products but are not used by the current version of the Level 0-1 processor.
For this study we have “patched” the binary Level 1 data files, i.e. essentially replaced the standard dark signals used for calibration by the improved ones, which resulted in sig-nificantly better WFM-DOAS fits. This improvement is of critical importance, as the CO absorption lines are weak. The depth of a CO line as observed by SCIAMACHY is typically only slightly above the instrument noise level. In order to further improve the calibration we are using a correction for analog to digital converter (ADC) non-linearities (Kleipool, 2003) not yet considered in operational Level 0-1 processing. The channel 8 detector array is very inhomogeneous with respect to detector pixel properties such as quantum effi-ciency and dark signal which vary strongly from pixel to pixel. Several pixels are not useful at all (“dead pixels”) and have been excluded in the WFM-DOAS fits. We have ex-tended the “dead pixel mask” of the Level 1 data product to reject additional pixels which resulted in strong spikes in the solar and/or nadir spectra obviously related to instrument ar-tifacts. In addition, mainly over scenes having low surface reflectivity, e.g. over ocean outside sun-glint conditions, the nadir spectra may contain unphysical (negative) radiance val-ues, especially in spectral regions of strong methane and wa-ter vapour absorption bands. They have also been excluded in the WFM-DOAS fits. In order to compensate for an ob-vious wavelength shift of the SCIAMACHY nadir spectra in the considered spectral range (Bovensmann et al., 2004) we subtract 0.3 nm from the wavelength as given in the Level 1 data product.
The calibration of the solar reference spectra as contained in the Level 1 data products is also preliminary. For this study a solar reference spectrum with an improved calibration has been used. This spectrum has been generated and made avail-able by ESA (provided by Johannes Frerick, ESA/ESTEC).
4 The WFM-DOAS retrieval algorithm
The Weighting Function Modified Differential Optical Ab-sorption Spectroscopy (WFM-DOAS) retrieval algorithm has been developed mainly for the retrieval of total columns of
CO, CH4, CO2, H2O, and N2O, from the SCIAMACHY NIR
nadir spectra (Buchwitz et al., 2000a; Buchwitz and Bur-rows, 2004; Buchwitz et al., 2004). WFM-DOAS, however, is not limited to this application and has also been success-fully applied to ozone total column retrieval using GOME data (Coldewey-Egbers et al., 2004) and to water vapour re-trieval using GOME and SCIAMACHY nadir spectra around 700 nm (No¨el, 2004).
WFM-DOAS is based on fitting the logarithm of a
lin-earized radiative transfer model Imod plus a low-order
poly-nomial P to the logarithm of the ratio of a measured nadir radiance and solar irradiance spectrum, i.e. observed
sun-normalized radiance Iobs. The linear least-squares
WFM-DOAS equation can be written as follows (fit parameters are underlined): ln I obs i −ln I mod i ( ˆV ) 2 ≡ kRESik2 → min., (1)
where the linearized radiative transfer model is given by ln Iimod( ˆV ) = ln Iimod( ¯V ) (2) + + J X j =1 ∂ln Iimod ∂Vj ¯ Vj ×( ˆVj− ¯Vj) + Pi(am).
Index i refers to the center wavelength λi of detector pixel
number i. The components of vectors V , denoted Vj, are
the vertical columns of all trace gases which have absorption lines in the selected spectral fitting window (here: CO, CH4,
and H2O). The fit parameters are the desired trace gas
ver-tical columns ˆVj and the polynomial coefficients am. An
additional fit parameters also used (but omitted in Eqs. 1 and 2) is the shift (in Kelvin) of a pre-selected tempera-ture profile. This fit parameter has been added in order to take the temperature dependence of the trace gas absorption cross-sections into account. The fit parameter values are de-termined by minimizing (in linear least-squares sense) the
difference between observation (ln Iiobs) and WFM-DOAS
model (ln Iimod), i.e. fit residuum RESi, for all spectral
points λi simultaneously. A derivative, or weighting
func-tion, with respect to a vertical column refers to the change of the top-of-atmosphere radiance caused by a change (here:
WFM-DOAS reference spectra are the logarithm of the sun-normalized radiance and its derivatives. They are computed with a radiative transfer model (Buchwitz et al., 2000b) for
assumed (e.g. climatological) “mean” columns ¯V . Multiple
scattering is fully taken into account. The least-squares prob-lem (Eqs. 1 and 2) can also be expressed in the following
vector/matrix notation: Minimize ky−A xk2 with respect
to x. The solution is ˆx = CxATy where Cx≡(ATA)−1is
the covariance matrix of solution ˆx. The errors of the
re-trieved columns are estimated as follows (Press et al., 1992):
σVˆ
j=
q
(Cx)jj×Pi RES2i/(m − n), where (Cx)jjis the j
-th diagonal element of -the covariance matrix, m is -the ber of spectral points in the fitting window and n is the num-ber of linear fit parameters (RESiis the spectral fit residuum,
see Eq. 1).
In order to avoid time consuming on-line radiative transfer simulations, a look-up table approach has been implemented (see Buchwitz and Burrows, 2004, for details). The WFM-DOAS reference spectra (radiance and derivatives) have been computed for cloud free conditions assuming a US Standard Atmosphere, a tropospheric maritime and stratospheric back-ground aerosol scenario and a surface albedo of 0.1. They depend on solar zenith angle, surface elevation, and water vapour column. For each trace gas including CO all refer-ence spectra have been computed using a single profile (the profile of the US Standard Atmosphere) in order to make sure that any retrieved variability only results from the mea-surement and not from a-priori information used in the re-trieval process (this approach is also used for MOPITT V3 retrievals for the same reason (Deeter et al., 2003; Emmons et al., 2004)). The only exception is water vapour. The look-up table has been generated for different water vapour columns (more precisely: for differently scaled US Standard Atmo-sphere profiles) to better consider non-linearities introduced by the high variability of water vapour in combination with its strong absorption lines covering most of the NIR spectral region.
An error analysis has been performed by applying WFM-DOAS to simulated nadir spectra (Buchwitz and Burrows, 2004; Buchwitz et al., 2000a). The CO column retrieval ran-dom error (precision) due to instrument noise is ∼20% (1-sigma) for the CO spectral fitting window used for this study
(solar zenith angle 50◦, albedo 0.1). The more systematic
errors introduced by, e.g. the currently implemented look-up table scheme, are typically below 10% for all cases in-vestigated, covering error sources such as the variability of temperature and water vapour profiles, aerosols, sub-visual cirrus clouds, and albedo effects (Buchwitz and Burrows, 2004).
It is important to point out that no a priori information is used to constrain the retrieved columns. A priori information on the atmosphere is only used to get a reasonable lineariza-tion point for the unconstrained linear least-squares WFM-DOAS fit.
5 Sensitivity to boundary layer CO
The advantage of the near-IR spectral region, in contrast to, e.g. the thermal IR region, is that the radiation detected by a nadir viewing satellite instrument is sensitive also to trace gas concentration changes in the boundary layer. In order to verify this and to characterize the altitude sensitivity of SCIAMACHY WFM-DOAS retrievals, so called CO ver-tical column averaging kernels (AK) have been computed. As described in e.g. Rodgers and Connor (2003), averaging kernels are defined as AK=∂ ˆ∂xx, i.e. characterize the sensi-tivity of the retrieved state ˆx (here: the retrieved CO col-umn) with respect to the true state x. The averaging
ker-nels for SCIAMACHY are shown in Fig. 1. They have
been computed by applying WFM-DOAS to simulated nadir spectra generated for an unperturbed profile as well as for perturbed CO profiles. A perturbed CO profile has been generated from the unperturbed profile by adding a certain (constant) number of CO molecules at given altitude lev-els. They have been computed numerically using the formula
AK(z)=(Vrp−Vt u)/(Vtp−Vt u), where Vt u is the true CO
column for the unperturbed (standard) CO profile, and Vtp
and Vrp are the true and retrieved CO columns of the
per-turbed CO profiles (having an enhanced CO concentration at altitude z), respectively.
To illustrate the interpretation of the column averaging kernels: A values of the averaging kernel of 1.1 at 1 km (∼900 hPa) means that if, for example, 100 molecules (per volume element) are added at 1 km to the standard profile, 110 additional molecules are retrieved, which is an overesti-mation of 10% (not of the total column but) of the column difference between the two profiles. This does not imply, however, that there is an intrinsic overestimation of the re-trieval. If the observed profile has lower values than the standard profile (which defines the linearization point for the retrieval) the retrieved column will be underestimated
(for example, if Vtp−Vt u equals −100 and AK is 1.1 than
Vrp−Vt u is −110). An overestimation resulting from
cer-tain layers might be compensated by underestimations re-sulting from other layers. The error introduced by “imper-fect” averaging kernels, i.e. averaging kernels that deviate from unity, is called “smoothing error” (see, e.g. Rodgers and Connor (2003)).
In order not to introduce any errors when calculating the averaging kernels, WFM-DOAS has also been applied to spectra computed for the standard (i.e. unperturbed) model atmosphere and it has been verified that the retrieved column agrees (within better than 0.05%) with the true column of the unperturbed model atmosphere, i.e. Vt u.
Figure 1 indicates that the altitude sensitivity of the SCIA-MACHY nadir measurements for solar zenith angles less
than ∼70◦ is nearly equally high at all altitudes below
6 Retrieval results
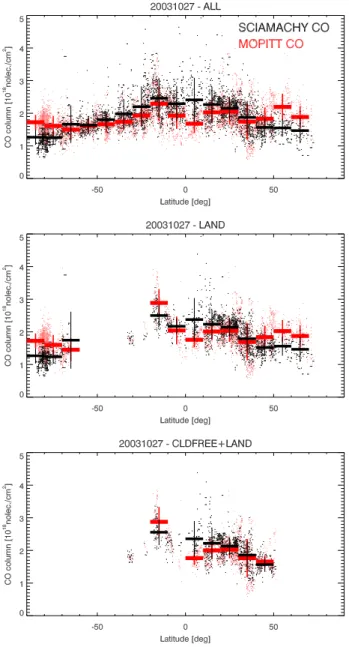
WFM-DOAS has been applied to several days of SCIA-MACHY data covering the time periode January 2003 to October 2003. The days have been selected based on the following criteria: (i) availability of nearly all 14 daily EN-VISAT orbits as SCIAMACHY Level 1 consolidated orbit product files (i.e. full operational products which cover entire orbits and include all auxillary data) and (ii) good overlap of ENVISAT with Terra orbits to enable an accurate compari-son with MOPITT. The CO columns derived from MOPITT have been extensively validated. For example, Emmons et al. (2004) show that the agreement with independently mea-sured columns is typically better than about 20%. In the fol-lowing results for three days are discussed in detail, one at the beginning of the analysed time periode (30 January), one in the middle (27 May), and one at the end (27 October).
Our initial analysis revealed that the depth of the fitted CO absorption lines as determined by WFM-DOAS is about a factor of two deeper than expected resulting in systemati-cally too high CO columns. This is most probably related to the difficulty of accurately fitting the weak CO absorp-tion lines. As will be shown, the fit residuals are dominated by systematic spectral artifacts on the order of the weak CO lines. The artifacts are most pronounced in spectral regions of strong overlapping methane and water vapour absorption bands. This indicates that they might result from uncertain-ties related to the spectrometer slit function (more details are given below) or spectroscopic line parameters used for the ra-diative transfer simulations (i.e. HITRAN (Rothmann et al., 2003)).
In order to roughly compensate for this, all WFM-DOAS Version 0.4 CO columns presented in this paper have been multiplied by a constant (scene independent) scaling factor of 0.5. This factor has been chosen to roughly scale the SCIA-MACHY data to MOPITT. A single constant scaling factor has been used rather than a single constant (additive) offset because a scaling factor results in better agreement with MO-PITT than an offset (for example an offset selected to match
the high columns (e.g. −2×10¹⁸molecules/cm2) would
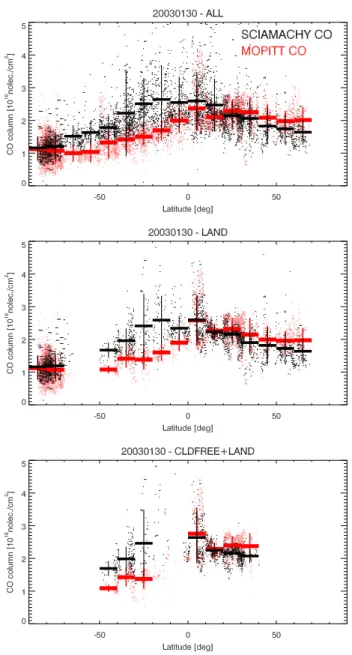
re-sult in low column being close to zero or even negative). To illustrate how the SCIAMACHY data compare with MOPITT after the scaling factor has been applied to the SCIAMACHY data Figures 2–4 show a comparison between the SCIAMACHY (WFM-DOAS Version 0.4) and the MO-PITT (Version 3) CO columns for three days.
As can be concluded from Figs. 2–4, the scaling factor re-moves a large bias (without scaling factor the SCIAMACHY columns would be a factor of two larger) but cannot account for all differences with respect to MOPITT. On the other hand, perfect agreement cannot be expected as the sensors do not observe the same ground pixels (the horizontal res-olution of the SCIAMACHY CO measurements is typically
30×120 km2, the MOPITT resolution is 22×22 km2) at
iden-tical times (the local time of the equator overpass on the
Fig. 2. Comparison of CO columns retrieved from SCIAMACHY
(black) by WFM-DOAS Version 0.4 and MOPITT (red) using Ver-sion 3. Compared are the daily data products of both sensors for 30 January 2003, for three conditions: top: all co-located data points (i.e. including cloud contaminated SCIAMACHY pixels), middle: only data over land, bottom: only cloud free data over land. The dots correspond to the individual data points and the horizontal lines indicate their average values within 10 degree latitude bands (the vertical lines denote their standard deviation). To eliminate differ-ences resulting from the different spatial sampling of both sensors the data have been mapped onto a common latitude/longitude grid and only values for those grid boxes are shown which contain data of both sensors. SCIAMACHY pixels with a CO fiterror larger than 60% have been excluded from the comparison.
dayside is 10:00 a.m. for SCIAMACHY and 10:30 a.m. for MOPITT) and because of the differences with respect to the altitude sensitivity.
Fig. 3. As Figure 2 but for 27 May 2003.
Despite the differences between the SCIAMACHY and the MOPITT data Figs. 2–4 suggest a significant correlation between the two data sets (this will be quantified in Sect. 6.3). The magnitude and the sign of the difference between the latitudinal averages computed for both sensors (horizontal lines) differs from latitude band to latitude band but agree-ment is typically within 30%. For certain latitude bands, most notably over the southern hemisphere outside Antarc-tica (where SCIAMACHY tends to systemaAntarc-tically overesti-mate MOPITT), the differences might be larger than 50%. The data shown in Figs. 2–4 will be discussed in more detail in the following sections.
Fig. 4. As Figure 2 but for 27 October 2003.
6.1 Spectral WFM-DOAS fits
A typical WFM-DOAS CO fit is shown in Fig. 5. In addition to CO, methane and water vapour spectral absorption fea-tures (i.e. radiance derivatives or weighting functions) have been included in the fit. As can be seen, the methane and wa-ter absorption features are much stronger than the weak CO absorption lines, which modulate the upwelling radiance by only a few percent in certain spectral intervals. The top panel shows the measured (square symbols) and modelled (solid line) sun-normalized radiances. The CO absorption lines are difficult to identify in the top panel because they are weak compared to the overlapping methane and water vapour ab-sorption structures. The spectral positions and the strength of
Orbit 4714 / 24-Jan-2003 / Px:583/Lat:28.91/Lon:3.66 2360 2362 2364 2366 2368 2370 0.04 0.08 0.12 0.16 Ra d /I rr ad I [-] CO fit 2360 2362 2364 2366 2368 2370 -0.12 0.00 0.12 d ln I/ d V * VC O CH4 fit 2360 2362 2364 2366 2368 2370 -0.8 -0.3 0.2 d ln I/ d V * VC H 4 H2O fit 2360 2362 2364 2366 2368 2370 -0.45 -0.15 0.15 d ln I/ d V * VH 2O Temperature fit 2360 2362 2364 2366 2368 2370 Wavelength [nm] -0.12 0.00 0.12 d ln I/ d T * D T
Fig. 5. Typical WFM-DOAS CO fit for a cloud free scene over
North Africa (Sahara) measured on 24 January 2003. The retrieved CO column is 2.19×10¹⁸molecules/cm2±30%. The root mean square relative difference between measurement (square symbols in top panel) and WFM-DOAS model (solid line in top panel) is 0.028.
the fitted CO lines are shown separately in the second panel (solid line) along with the “CO fit residuum” (symbols). The CO fit residuum is the sum of the (overall) residuum, which is the difference between the WFM-DOAS model and the measurement after the fit, and the fitted CO absorption struc-tures (i.e. the term in Eq. (2) with the derivative with respect to CO). As already explained, a temperature shift parameter and a low order polynomial (not shown) are also included in the WFM-DOAS fit.
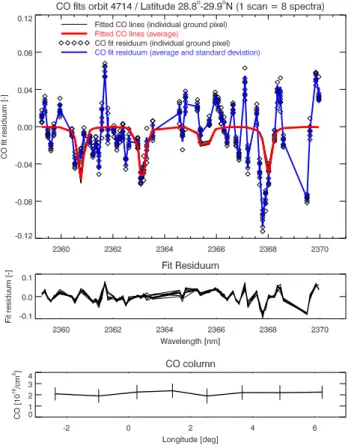
Figure 6 shows WFM-DOAS fit results for the eight con-secutive nadir measurements of one east to west scan. As can be seen (most clearly in the middle panel), the fit resid-uals for the different ground pixels are nearly identical. This means that the fit residuals are currently not signal-to-noise limited but dominated by systematic spectral artifacts on the order of the weak CO absorption lines. Further investiga-tion is needed in order to find out what the reason for these artifacts is (e.g. by analysing time series). They are clearly related to the strong methane and water vapour absorption
Fig. 6. Similar WFM-DOAS fit results as shown in Fig. 5 but for
the eight consecutive ground pixels of one east to west scan. The top panel shows (individual and average) fitted CO absorption lines and the CO fit residuals, defined as the fitted CO absorption plus fit residuum which is the difference between measurement and model after the fit. The eight fit residuals are shown in the middle panel. The bottom panel shows the retrieved CO columns including error bars.
features (see Fig. 5) and, therefore, might be caused by inac-curate knowledge of the instrument slit function and/or un-certainties of the spectroscopic line parameters (Rothmann et al., 2003). The error bars of the retrieved CO columns of approximately ±30% for single measurements as shown in the bottom panel of Fig. 6 have been calculated as described in Sect. 4, i.e. they are proportional to the root-sum-square of the spectral fit residuum and, therefore, not only reflect noise but also systematic components. In this sense they are a rather conservative estimate of the CO column retrieval pre-cision.
Initial information on the SCIAMACHY slit function has been derived from various studies performed during the on ground calibration of SCIAMACHY. As each absorp-tion line is only sampled by a small number of detec-tor pixels (typically two per full width of half maximum (FWHM)) it is not trivial to accurately determine the slit function (i.e. its type and corresponding parameters). Be-cause of this, the recommendations given by the different
SCIAMACHY/PMD1 2003−10−27
Fig. 7. SCIAMACHY Polarization Measurement Device (PMD)
number 1 (320–380 nm) nadir reflectivity for 27 October 2003 (color code: white=high signal (mainly clouds but also ice and snow covered surfaces), blue=low signal (cloudfree)). For this day only 9 of the 14 daily orbits were available. Each nearly rectangular block of measurements corresponds to one nadir state which is a sequence of individual nadir measurements with identical instrument param-eters (e.g. horizontal resolution). Each nadir state lasts about one minute. The gaps in between the nadir nadir states are due to the limb measurements.
studies were not necessarily identical. Furthermore, anal-ysis of the SCIAMACHY in-flight data by SRON (Hans Schrijver, personal communication) indicates that the slit function in channel 8 is different from the one measured pre-flight (most probably due to the ice issue mentioned in
Sect. 2). Therefore, various slit functions have been
in-vestigated using WFM-DOAS retrievals. The slit function that has been used for this study is the one that resulted in best fits, i.e. smallest fit residuals. The one finally selected
is: f (λ−λ◦)=(1 + (2 (λ−λ◦)/F W H M)EXP)−1, with
pa-rameters F W H M=0.24 nm and EXP =2.7. When using this function for the convolution of the high resolution reference spectra, it is numerically integrated and normalized to an area equal to 1.
6.2 Cloud identification
An error is introduced for the retrieved columns if DOAS is applied to cloud contaminated pixels as the WFM-DOAS algorithm as described in Sect. 4 is strictly speaking only appropriate for cloud free scenes. A cloud mask is gen-erated to flag the cloud contaminated pixels.
Currently, this cloud mask is generated using the sub-pixel information provided by SCIAMACHY’s Polarisation Mea-surement Device (PMD) number 1 covering approximately the spectral region 320–380 nm (Bovensmann et al., 1999). A simple single threshold algorithm is used. The algorithm works as follows: First, each interpolated PMD 1 readout as
Fig. 8. MODIS/Terra daily reflectance data product for 27 October
2003, with daily active fire detection data product overlayed (red dots) (Source: http://landqa2.nascom.nasa.gov/).
contained in the Level 1 file (32 values per one second in-tegration time) that corresponds to a given (main channel) ground pixel is divided by the cosine of the solar zenith an-gle to obtain a quantity approximately proportional to top-of-atmosphere reflectivity. If this “PMD 1 reflectivity” is higher than a pre-defined threshold the corresponding sub-pixel is assumed to be cloud contaminated. A (main channel) ground pixel is flagged cloud contaminated if one or more of its PMD sub-pixels is cloud contaminated.
PMD 1 has been selected for the cloud mask generation because the scattered and reflected solar ultra violet (UV) ra-diation detected by SCIAMACHY’s nadir mode penetrates deep into the atmosphere but the fraction that is reflected at the Earth surface (i.e. the sensitivity to the Earth surface) is significantly lower than for the other PMD channels cover-ing parts of the visible and NIR spectral regions (because scattering in the atmosphere decreases with increasing wave-length resulting in relatively more photons being reflected at the Earth surface). This effect can be visualized by com-paring global maps showing the signal of the various PMDs. For example, a land to sea contrast is (nearly) not visible for PMD 1 but clearly visible for the other PMDs (not shown here).
The optimum threshold has been determined empirically by visual inspection of global maps of PMD 1 reflectiv-ities with overlayed cloud masks generated using various thresholds. Fine tuning of the threshold has been performed by analysing the retrieved columns of the well-mixed gases methane and carbon dioxide (Buchwitz et al., 2004). Cur-rently the same threshold, i.e., cloud mask, is used for all trace gas retrievals, i.e. for CO and for the well-mixed gases. Because of the low variability of the (mixing ratios of the) well-mixed gases the accuracy and precision requirements for these gases are much higher than for CO. Therefore, a very strict cloud identification is needed for methane and car-bon dioxide to avoid even small cloud contamination. For CO it should be possible to relax this requirement and to se-lect a threshold optimized for CO in order to increase the number of useful (i.e. “sufficiently” cloud free) pixels. This
however requires further study. In this study we show the results for the two extreme cases, namely “all data” and “strictly cloud free data”.
As an example, Fig. 7 shows a PMD 1 map for 27 Oc-tober 2003. For comparison, the MODIS/Terra reflectance data product for the same day is shown in Fig. 8 which shows cloud structures at much higher spatial resolution. The agree-ment between both data sets is good. They show, for exam-ple, extended regions with nearly no clouds over northern Africa and central and southern Asia and large cloud cover-age over Europe, northern Asia and along the east coast of North America.
Enhanced UV backscatter results from clouds but might also result from high aerosol load, e.g. heavy smoke result-ing from strong biomass burnresult-ing events. Also highly reflect-ing surfaces result in higher than average UV backscatter. Therefore, pixels over ice or snow covered surfaces might be wrongly classified as cloud contaminated. We aim at im-proving this in the near future, e.g. by using a combination of the various PMDs including the PMDs that cover the NIR region.
6.3 Global CO column retrieval results
In the following results for three days will be presented. We start with 27 October 2003. As already shown in Fig. 7 for this day only 9 of the 14 daily orbits of ENVISAT were avail-able for this study with nearly no coverage of America and no coverage of Australia. For this day we focus on eastern Africa where a large plume of CO due to biomass burning has been detected by SCIAMACHY. For the two other days (30 January and 27 May 2003) better coverage has been achieved including North and South America and Australia (only for 27 May 2003). For these two days we focus on a discussion of the global results.
Figure 8 shows the positions of heavy fires (red dots) on 27 October 2003, for nearly the entire Earth. An extended region of fires due to biomass burning is indicated near the east coast of southern Africa around Mozambique. Biomass burning typically results in enhanced concentrations of CO. Figure 9 shows the MOPITT CO (Version 3) column data product for the same day. The MOPITT data product con-tains only measurements for those pixels that have been clas-sified cloud free by the MOPITT cloud detection algorithm (Deeter et al., 2003; Emmons et al., 2004). MOPITT shows an extended region of enhanced CO in the Mozambique area where the fires are. Figure 10 shows the same MOPITT data as in Figure 9 but focussing on the Mozambique area.
Figures 11 and 12 show the same region displaying the CO columns as retrieved from SCIAMACHY by WFM-DOAS. Figure 11 shows the retrieved columns for all pixels. Fig-ure 12 shows the same data but here cloud contaminated pix-els, as determined by the SCIAMACHY PMD threshold al-gorithm, are plotted in grey.
Fig. 9. CO columns as measured by MOPITT on 27 October 2003
(Source: http://www.eos.ucar.edu/mopitt/data/plots/mapsv3.html). The MOPITT Version 3 daily data product shown here includes measurements from the dayside (orbital track from “top right to bottom left”) and from the nightside (orbital track from “bottom right to top left”). Measurements from cloud contaminated pixels as identified with the MOPITT cloud detection algorithm are not included in the Version 3 data product.
As can be seen, the CO columns as retrieved from MO-PITT and SCIAMACHY agree reasonably well. For ex-ample, both sensors show the large plume of enhanced CO concentrations in the area of Mozambique with CO columns being approximately 50% higher (shown in red) than local background concentrations (green). Both sensors also show relatively low columns (blue) north of this region around Ethiopia where the columns are approximately 30% lower than the background concentrations.
However, there are also differences. To a certain extent, differences are to be expected for reasons already mentioned (e.g. differences in ground pixel size, overpass time, and altitude sensitivity). When comparing Fig. 10 with Fig. 11 one sees that the plume as observed by MOPITT is larger than the plume detected by SCIAMACHY. This is partially because the area observed by MOPITT is larger (because of the gaps of the SCIAMACHY measurements and because the MOPITT nightside measurements are included in Fig. 10 whereas SCIAMACHY only measures on the dayside) but also because of clouds. This can be concluded from the com-parison of Figs. 11 and 12. One can see from Fig. 12 that there are a number of cloud contaminated pixels in the area of the CO plume. This is consistent with the white and grey areas shown in Fig. 13 which is a zoom into Fig. 8. The comparison of Figs. 11 and 12 shows that the columns of the cloud contaminated pixels in the area of the plume are typ-ically lower (green) than the columns of the cloud free pix-els (red). This is as expected for cloudy pixpix-els as for these pixels only the column above the clouds is visible for SCIA-MACHY.
CO MOPITT 20031027
< 1.00 1.20 1.40 1.60 1.80 2.00 2.20 2.40 2.60 2.80 3.00 > < 1.00 1.20 1.40 1.60 1.80 2.00 2.20 2.40 2.60 2.80 3.00 > VC [1018molec./cm2]MOP02−20031027−L2V5.9.2.prov.hdf gridded/plotted by [email protected]−bremen.de
Fig. 10. The same MOPITT data as shown in Fig. 9 but mapped
on a 0.5◦×0.5◦latitude/longitude grid. Shown is a region in Africa where a large plume of CO due to biomass burning has been de-tected by MOPITT near Mozambique. Shown is the latitude range
−30◦to +30◦and the longitude range +20◦to +50◦.
CO SCIA/WFMD 20031027
< 1.00 1.20 1.40 1.60 1.80 2.00 2.20 2.40 2.60 2.80 3.00 > < 1.00 1.20 1.40 1.60 1.80 2.00 2.20 2.40 2.60 2.80 3.00 > VC [1018molec./cm2] [email protected]−bremen.de (WFMDv0.4)Fig. 11. The same CO plume as shown in Fig. 10 as seen by
SCIAMACHY/WFM-DOAS.
CO SCIA/WFMD 20031027
< 1.00 1.20 1.40 1.60 1.80 2.00 2.20 2.40 2.60 2.80 3.00 > < 1.00 1.20 1.40 1.60 1.80 2.00 2.20 2.40 2.60 2.80 3.00 > VC [1018 molec./cm2 ] [email protected]−bremen.de (WFMDv0.4)Fig. 12. As Fig. 11 but with cloud contaminated pixels shown in
grey.
Fig. 13. Zoom into Figure 8, i.e. MODIS image from 27 October
2003, with fires shown as red dots, but restricted to the region also shown in Figs. 10–12. The image is not at full MODIS resolution.
Apart from the area around Mozambique Fig. 8 indicates a number of other locations where heavy fires are, for exam-ple in southern California, where extended regions have been burning in the time periode end of October to beginning of November 2003. As can be seen from Fig. 7 no consolidated orbits covering California were available for this study for 27 October 2003. Enhanced CO concentration (of up to about 100% higher columns compared to the local background) due to these fires, however, are visible in the SCIAMACHY measurements from 26 October and 29 October 2003 (not shown here). Similar results have also been found by another group (at SRON, The Netherland) using an independently de-veloped scientific retrieval algorithm (H. Schrijver, personal communication; see also Gloudemans et al. (2004)).
In the following results from two other days of SCIA-MACHY data are compared with MOPITT, namely 30 Jan-uary 2003 and 27 May 2003. In order to facilitate a quan-titative comparison with MOPITT, all data available for a
given day have been mapped onto a common 0.5◦ by 0.5◦
latitude/longitude grid.
Figure 14 shows the MOPITT V3 column data product for 30 January 2003. Figure 15 shows the SCIAMACHY CO columns for the same day (10 of the 14 daily orbits were available for this day). Shown are “all” pixels, i.e. also pixels which are cloud contaminated. It can be seen that especially over the oceans many data are missing. This is related to the low signals and corresponding low signal-to-noise ratios for measurements over the ocean caused by the low ocean reflectivity outside sun-glint conditions: (i) only those mea-surements have been included in Fig. 15 where a relatively good WFM-DOAS fit has been achieved (criterion: CO col-umn fit error less than 60%; especially over water the fit error can be larger than 60% due to low signal-to-noise ratios) and (ii) because some spectra contain unphysical (negative) ra-diances for certain detector pixels and these spectra are not
CO MOPITT 20030130
< 0.50 0.80 1.10 1.40 1.70 2.00 2.30 2.60 2.90 3.20 3.50 > < 0.50 0.80 1.10 1.40 1.70 2.00 2.30 2.60 2.90 3.20 3.50 > VC [1018molec/cm2]MOP02−20030130−L2V5.9.2.prov.hdf gridded/plotted by [email protected]−bremen.de
Fig. 14. CO columns as measured by MOPITT on 30 January 2003.
CO SCIA/WFMD 20030130
< 0.50 0.80 1.10 1.40 1.70 2.00 2.30 2.60 2.90 3.20 3.50 > < 0.50 0.80 1.10 1.40 1.70 2.00 2.30 2.60 2.90 3.20 3.50 > VC [1018 molec./cm2 ] [email protected]−bremen.de (WFMDv0.4, gridded 0.5x0.5)Fig. 15. CO columns as measured by SCIAMACHY/WFM-DOAS
on 30 January 2003. Shown are all pixels where the CO fit error is less than 60%. For this day only 10 of the 14 daily orbits were available.
CO SCIA/WFMD/cf 20030130
< 0.50 0.80 1.10 1.40 1.70 2.00 2.30 2.60 2.90 3.20 3.50 > < 0.50 0.80 1.10 1.40 1.70 2.00 2.30 2.60 2.90 3.20 3.50 > VC [1018 molec./cm2 ] [email protected]−bremen.de (WFMDv0.4, gridded 0.5x0.5)Fig. 16. As Fig. 15 but only for strictly cloud free pixels.
Fig. 17. Correlation between SCIAMACHY and MOPITT CO
columns for 30 January 2003.
Fig. 18. As Fig. 17 but restricted to pixels over land.
CO MOPITT 20030527
< 0.50 0.80 1.10 1.40 1.70 2.00 2.30 2.60 2.90 3.20 3.50 > < 0.50 0.80 1.10 1.40 1.70 2.00 2.30 2.60 2.90 3.20 3.50 > VC [1018molec/cm2]MOP02−20030527−L2V5.7.2.prov.hdf gridded/plotted by [email protected]−bremen.de
Fig. 20. CO columns as measured by MOPITT on 27 May 2003.
CO SCIA/WFMD 20030527
< 0.50 0.80 1.10 1.40 1.70 2.00 2.30 2.60 2.90 3.20 3.50 > < 0.50 0.80 1.10 1.40 1.70 2.00 2.30 2.60 2.90 3.20 3.50 > VC [1018 molec./cm2 ] [email protected]−bremen.de (WFMDv0.4, gridded 0.5x0.5)Fig. 21. CO columns as measured by SCIAMACHY/WFM-DOAS
on 27 May 2003. Shown are all pixels where the CO fit error is less than 60%. For this day only 13 of the 14 daily orbits were available.
CO SCIA/WFMD/cf 20030527
< 0.50 0.80 1.10 1.40 1.70 2.00 2.30 2.60 2.90 3.20 3.50 > < 0.50 0.80 1.10 1.40 1.70 2.00 2.30 2.60 2.90 3.20 3.50 > VC [1018 molec./cm2 ] [email protected]−bremen.de (WFMDv0.4, gridded 0.5x0.5)Fig. 22. As Fig. 21 but only for strictly cloud free pixels.
Fig. 23. Correlation between SCIAMACHY and MOPITT CO
columns for 27 May 2003.
Fig. 24. As Fig. 23 but restricted to pixels over land.
processed by WFM-DOAS (an average dark signal which is dominate by thermal emission of the instrument is subtracted from the uncalibrated total signal; especially over water the dark signal is on the order of the total signal and might ex-ceed it under certain conditions for certain detector pixels).
Figure 16 shows the same data as Fig. 15 but restricted to cloud free SCIAMACHY pixels. As can be seen when com-paring Fig. 16 with Fig. 14 the fraction of the Earth covered by cloud free MOPITT pixels (as determined by the MO-PITT cloud detection algorithm) is significantly higher for the daily data than for SCIAMACHY (as determined by the SCIAMACHY cloud detection algorithm). There are a num-ber of reasons for this: (i) Not all daily SCIAMACHY or-bits were available, (ii) only those SCIAMACHY data are shown where a good fit has been achieved, (iii) MOPITT also measures during the night, (iv) the ground pixels size of the MOPITT measurements is significantly smaller which increases the number of cloud free pixels, (v) SCIAMACHY uses only half of the time on the dayside for nadir observa-tions (because of the limb measurements) and (vi) (as already explained) the currently used SCIAMACHY cloud detection algorithm is very conservative (probably too conservative for CO) and cannot discriminate between clouds and highly re-flecting surfaces such as ice and snow.
The MOPITT and the SCIAMACHY data show similari-ties but also differences. For example, MOPITT shows high CO mainly in mid Africa in a belt north of the equator and a slightly lower but still elevated CO patch in Texas near the Gulf of Mexico. SCIAMACHY (Fig. 16) also shows enhanced CO columns in mid Africa similar as MOPITT. The enhanced values as seen by MOPITT over Texas are not visible in the SCIAMACHY data, except for a few pixels close to the Gulf of Mexico, because of insufficient overlap of the SCIAMACHY measurements with the CO plume de-tected by MOPITT. Along the west coast of South Amercia both sensors measure similar columns but over Argentina the SCIAMACHY CO columns are in certain regions more than 50% higher than the columns measured by MOPITT.
The columns shown in Figs. 14–16 are displayed in Fig. 2 as a function of latitude. Figure 2 shows that in the northern hemisphere the SCIAMACHY and the MOPITT data are on average in good agreement (within about 20%) but that in the southern hemisphere the SCIAMACHY columns are on av-erage significantly higher than measured by MOPITT. There is one exception, namely the measurements over Antarctica, where the agreement with MOPITT is good. Note that the measurements over Antarctica are classified as cloud con-taminated by the SCIAMACHY PMD1 cloud detection al-gorithm (therefore these measurements do not show up in the bottom panel of Fig. 2 and in Fig. 16). This is most probably not correct for many of the pixels and is due to the simple cloud detection algorithm which cannot distinguish between clouds and highly reflecting surfaces covered by ice or snow. The correlation between the 30 January data of both sen-sors are shown in Fig. 17 for all common data points, in
Fig. 18 only for the data over land, and in Fig. 19 for the cloud free measurements over land. The quantitive results obtained from this comparison (correlation coefficient, stdard deviation of the difference, etc.) are given in the an-notation of each Figure but also in Table 1 which includes the results for the other days. Pearsons linear correlation coefficient r is 0.44 for “all” data, 0.67 for the data over land, and 0.41 for the cloud free data over land. The cor-relation between the cloud free data over land is less than the correlation for all land data which is somewhat unex-pected and not observed for the other two days investigated (see Table 1). Figures 17–19 suggest that SCIAMACHY typically overestimates the low columns (which are mainly over the southern hemisphere) and underestimates the high columns. The standard deviation of the difference with
re-spect to MOPITT is 0.6×10¹⁸ molecules/cm2for the cloud
free measurements over land. For “all” pixels the standard deviation of the difference is 0.8×10¹⁸molecules/cm2. This
improves to 0.5×10¹⁸molecules/cm2if the comparison is
re-stricted to land. A better quality of the SCIAMACHY mea-surements over land is expected due to higher signal-to-noise ratios compared to measurements over the ocean where re-flectivity is low outside sun-glint conditions.
Figure 20 (MOPITT, 27 May 2003) shows widespread elevated CO in the boreal regions and relatively low val-ues in the Sahara. The SCIAMACHY data for the same day are shown in Figs. 21 (all data) and 22 (cloud free data). Figure 22 shows similar values as MOPITT in the
western and eastern Sahara (∼2.0×10¹⁸molecules/cm2) but
somewhat higher values in the central Sahara (∼2.6×10¹⁸
molecules/cm2). SCIAMACHY sees enhanced CO over
southern Finland also seen by MOPITT (the MOPITT columns are somewhat lower). The enhanced CO plumes in the boreal region seen by MOPITT, e.g. the plume in western Russia, are not visible in the SCIAMACHY data.
The correlation between the 27 May 2003, data of both sensors are shown in Fig. 23 for all common data points, in Fig. 24 for the data over land only, and in Fig. 25 for the cloud free measurements over land. The linear correlation coefficient r is 0.25 for all data, 0.40 for the data over land, and 0.64 for the cloud free data over land. The standard
devi-ation of the difference with respect to MOPITT is 0.4×10¹⁸
molecules/cm2for the cloud free measurements over land.
Table 1 summarizes the quantitative results from the com-parison of the three days of SCIAMACHY and MOPITT data. The correlation between MOPITT and SCIAMACHY CO columns for cloud free pixels over land is typically in the range r=0.4–0.7. The standard deviation of the difference
is in the range 0.4–0.6×10¹⁸molecules/cm2(corresponding
to about 20–50%). Table 1 shows that for all three days the agreement with MOPITT (as quantified by a higher correla-tion coefficient and a smaller standard deviacorrela-tion of the differ-ence) improves if the comparison is limited to measurements over land. This is in line with signal-to-noise considerations: over ocean the reflectivity is typically very low resulting in
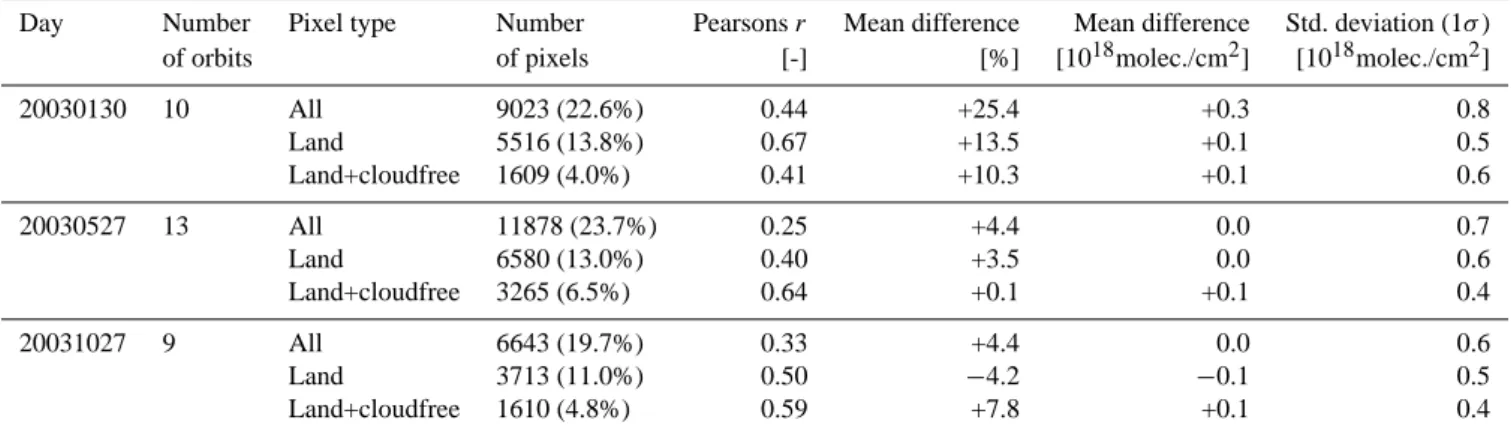
Table 1. Overview about the quantitative results from the comparison of the SCIAMACHY and MOPITT CO columns for the three days
discussed in this paper. “Number of pixel” is the number of (0.5◦×0.5◦latitude/longitude) gridboxes with coincident SCIAMACHY and MOPITT measurements (for the three different selection criteria listed in column “Pixel type”). The percentage values given in brackets denote the fraction of pixels used (100% refers to the total number of gridboxes covered by SCIAMACHY data). The mean difference is defined as SCIAMACHY minus MOPITT, i.e., positive values indicate overestimation of SCIAMACHY relative to MOPITT.
Day Number Pixel type Number Pearsons r Mean difference Mean difference Std. deviation (1σ )
of orbits of pixels [-] [%] [1018molec./cm2] [1018molec./cm2]
20030130 10 All 9023 (22.6%) 0.44 +25.4 +0.3 0.8 Land 5516 (13.8%) 0.67 +13.5 +0.1 0.5 Land+cloudfree 1609 (4.0%) 0.41 +10.3 +0.1 0.6 20030527 13 All 11878 (23.7%) 0.25 +4.4 0.0 0.7 Land 6580 (13.0%) 0.40 +3.5 0.0 0.6 Land+cloudfree 3265 (6.5%) 0.64 +0.1 +0.1 0.4 20031027 9 All 6643 (19.7%) 0.33 +4.4 0.0 0.6 Land 3713 (11.0%) 0.50 −4.2 −0.1 0.5 Land+cloudfree 1610 (4.8%) 0.59 +7.8 +0.1 0.4
low signal and signal-to-noise ratios. The mean difference between the two data sets is also given in Table 1 (although the SCIAMACHY columns are scaled to MOPITT) to given an indication for the variability of the difference as a func-tion of time. The mean difference for the cloud free mea-surements over land is, for example, significantly different for each of the three days but less than 11% for all cases.
7 Initial comparisons with ground based measurements
The systematic validation of the WFM-DOAS Version 0.4 data products by ground based measurements has recently started. First comparisons have been performed with Fourier Transform InfraRed (FTIR) measurements (Warneke et al., 2004; de Maziere et al., 2004; Sussmann and Buchwitz,
20041). The initial findings, which are shortly summarized
in this section, are roughly consistent with what is reported in this study based on the comparison with MOPITT.
Warneke et al. (2004)2 show a comparison of the
SCIA-MACHY CO measurements over Africa and over the At-lantic ocean near Africa with ship-borne solar occultation FTIR CO column measurements obtained during a cruise of the German research vessel Polarstern in January/February 2003. Both data sets show agreement within typically 30%. Enhanced CO concentrations resulting from biomass burning
1Sussmann, R. and Buchwitz, M.: Validation of EN-VISAT/SCIAMACHY columnar CO by FTIR profile retrievals at the ground truthing station Zugspitze, Atmos. Chem. Phys. Dis-cus., submitted, 2004.
2Warneke, T., de Beek, R., Buchwitz, M., Notholt, J., Schulz, A., Velazco, V., and Schrems, O.: Shipborne solar absorption mea-surements of CO2, CH4, N2O, and CO and comparison the SCIA-MACHY WFM-DOAS retrievals, Atmos. Chem. Phys. Discuss., submitted, 2004.
in mid Africa, as detected by SCIAMACHY, are also visible in the FTIR data.
de Maziere et al. (2004) present preliminary results from a comparision with the ground based network of FTIR spec-trometers (all available orbits from 33 days have been
com-pared with 12 stations). In that study agreement within
typically 40% has been reported with SCIAMACHY typi-cally overestimating the ground based measurements. Larger differences have been found at mainly two station, namely Lauder (probably due to a number of SCIAMACHY mea-surements over the sea which are less reliable due to low ocean reflectivity) and Wollongong (probably related to the large natural variability observed by this station). de Maziere et al. (2004) also compare SCIAMACHY CO columns re-trieved by other groups using algorithms different from WFM-DOAS (see, e.g. Gloudemans et al. (2004)) with the ground based measurements. The results obtained from the different groups are similar but not identical. At present it is difficult to draw firm conclusions with respect to the qual-ity of the CO columns retrieved from SCIAMACHY using different approaches. This requires more data to be inter-compared and a detailed characterization and error analysis of the different algorithms.
Sussmann and Buchwitz (2004)1 aimed at finding out
to what extent atmospheric variability has been retrieved
with WFM-DOAS V0.4. They compared 33 days of
SCIAMACHY CO data (January–October 2003) with FTIR measurements at the Permanent Ground Truthing Station Zugspitze in southern Germany and found that it is possi-ble (even with the limited amount of data availapossi-ble for that study) to retrieve statistically significant information on the CO annual cycle (amplitude ∼10%).
8 Conclusions
Global CO columns have been retrieved from SCIAMACHY nadir spectra using the WFM-DOAS retrieval algorithm. To accomplish this, the calibration of the SCIAMACHY oper-ational Level 1 data products (nadir spectra) had to be im-proved mainly with respect to a better dark signal correction. The SCIAMACHY CO columns show reasonable agree-ment with the CO column data product (V3) of the MO-PITT instrument onboard EOS Terra. Elevated atmospheric CO concentrations due to, e.g. biomass burning events, which are observed by MOPITT, are also detectable with SCIAMACHY. The standard deviation of the difference
with respect to MOPITT is in the range 0.4–0.6×10¹⁸
molecules/cm2 and the linear correlation coefficient is
be-tween 0.4 and 0.7. The differences of the columns measured by both sensors depend on time and location. They are typ-ically less than about 30% for most latitudes but might ex-ceed 50% especially over the southern hemisphere outside Antarctica, where SCIAMACHY tends to give systemati-cally higher values than MOPITT.
Validation with correlative ground based measurements has recently started. The initial results from intercompar-isons with ground based Fourier Transform InfraRed (FTIR) measurements are consistent with the results of this study.
Despite the encouraging initial results obtained with WFM-DOAS Version 0.4 further investigations and improve-ments are needed, e.g. to clarify the meaning of the currently used scaling factor for the CO columns. This includes to de-termine if and how this scaling factor is influenced by SCIA-MACHYs relatively high sensitivity to the lower troposphere and boundary layer CO and/or by the currently not perfect spectral fitting. The cloud detection algorithm also needs improvement. Currenly a rather simple and most probably too conservative scheme is used which is not appropriate for all conditions, e.g. for pixels over ice and snow covered sur-faces. In order to improve WFM-DOAS more data need to be processed and carefully analysed using independent satellite data (e.g. MOPITT) and ground based measurements (e.g. FTIR).
The SCIAMACHY WFM-DOAS Version 0.4 CO column data products presented and discussed in this paper are avail-able from http://www.iup.physik.uni-bremen.de/sciamachy/ NIR NADIR WFM DOAS/.
Acknowledgements. We would like to thank our formerly col-league M. Eisinger (now ESA/ESTEC) for the source code of the DOAS fitting software “kvant” which formed the basis of the WFM-DOAS retrieval program and C. Clerbaux for helpful comments. Thanks also to A. G. Straume, SRON, for providing us with an IDL tool that permitted easy access to the MOPITT data. The MOPITT data have been obtained via internet from the NASA Langley Research Center Atmospheric Sciences Data Center (http://eosweb.larc.nasa.gov/PRODOCS/mopitt/table mopitt.html). We acknowledge exchange of information within the European Commission (EC) Network of Excellence ACCENT. This study has
been funded by the German Ministry for Research and Education (BMBF) via DLR-Bonn (Grants 50EE0027 and 50EE9901) and GSF/PT-UKF (Grant 07UFE12/8), the EC (5th Framework Programme on Energy, Environment and Sustainable Development, Contract no. EVG1-CT-2002-00079, project EVERGREEN), and by the University and the State of Bremen.
Edited by: J. Fishman
References
Bergamaschi, P., Hein, R., Heimann, M., and Crutzen, P. J.: Inverse modeling of the global CO cycle, 1. Inversion of CO mixing ra-tios, J. Geophys. Res., 105, 1909–1927, 2000.
Bovensmann, H., Burrows, J. P., Buchwitz, M., Frerick, J., No¨el, S., Rozanov, V. V., Chance, K. V., and Goede, A.: SCIAMACHY – Mission Objectives and Measurement Modes, J. Atmos. Sci., 56, 127–150, 1999.
Bovensmann, H., Buchwitz, M., Frerick, J., Hoogeveen, R., Kleipool, Q., Lichtenberg, G., No¨el, S., Richter, A., Rozanov, A., Rozanov, V. V., Skupin, J., von Savigny, C., Wuttke, M., and Burrows, J. P.: SCIAMACHY on ENVISAT: In-flight op-tical performance and first results, in Remote Sensing of Clouds and the Atmosphere VIII, edited by Sch¨afer, K. P., Com`eron, A., Carleer, M. R., and Picard, R. H., vol. 5235 of Proceedings of SPIE, 160–173, 2004.
Buchwitz, M. and Burrows, J. P.: Retrieval of CH4, CO, and CO2 total column amounts from SCIA-MACHY nearinfrared nadir spectra: Retrieval algorithm and first results, in Remote Sens-ing of Clouds and the Atmosphere VIII, edited by Sch¨afer, K. P., Com`eron, A., Carleer, M. R., and Picard, R. H., vol. 5235 of Proceedings of SPIE, 375–388, 2004.
Buchwitz, M., de Beek, R., Burrows, J. P., Bovensmann, H., Warneke, T., Notholt, J., Meirink, Goede, A. P. H., Bergamaschi, P., K¨orner, S., Heimann, M., Muller, J.-F., and Schulz, A., Atmo-spheric methane and carbon dioxide from SCIAMACHY satel-lite data: Initial comparison with chemistry and transport models, Atmos. Chem. Phys. Discuss., accepted, 2004.
Buchwitz, M., Rozanov, V. V., and Burrows, J. P.: A near infrared optimized DOAS method for the fast global retrieval of atmo-spheric CH4, CO, CO2, H2O, and N2O total column amounts from SCIAMACHY/ENVISAT-1 nadir radiances, J. Geophys. Res., 105, 15 231–15 246, 2000a.
Buchwitz, M., Rozanov, V. V., and Burrows, J. P.: A correlated-k distribution scheme for overlap-ping gases suitable for retrieval of atmospheric constituents from moderate resolution radiance measurements in the visible/near-infrared spectral region, J. Geo-phys. Res., 105, 15 247–15 262, 2000b.
Burrows, J. P., H¨olzle, E., Goede, A. P. H., Visser H., and Fricke, W., SCIAMACHY - Scanning Imaging Absorption Spectrometer for Atmospheric Chartography, Acta Astronautica, 35(7), 445– 451, 1995.
Clerbaux, C., Hadji-Lazaro, J., Turquety, S., Megie, G., and Coheur, P. F.: Trace gas measurements from infrared satellite for chem-istry and climate applications, Atmos. Chem. Phys., 3, 1495– 1508, 2003,
SRef-ID: 1680-7324/acp/2003-3-1495.
Coldewey-Egbers, M., Weber, M., Lamsal, L. N., de Beek, R., Buchwitz, M., and Burrows, J. P.: A total ozone algorithm for
backscatter UV using the weighting function DOAS approach, Atmos. Chem. Phys. Discuss., 4, 4915–4944, 2004,
SRef-ID: 1680-7375/acpd/2004-4-4915.
Deeter, M. N., Emmons, L. K., Francis, G. L., Edwards, D. P., Gille, J. C., Warner, J. X., Khattatov, B., Ziskin, D., Lamarque, J.-F., Ho, S.-P., Yuding, V., Attie, J.-L., Packman, D., Chen, J., Mao, D., and Drummond, J. R.: Operational carbon monoxide retrieval algorithm and selected results for the MOPITT instru-ment, J. Geophys. Res., 108, 4399–4409, 2003.
de Mazi`ere, M., Barret, B., Blumenstock, T., Buchwitz, M., de Beek, R., Demoulin, P., Fast, H., Gloudemans, A., Griesfeller, A., Griffith, D., Ionov, D., Janssens, K., Jones, N., Mahieu, E., Melleqvist, J., Mittermeier, R. L., Notholt, J., Rinsland, C., Schrijver, H., Schultz, A., Smale, D., Strandberg, A., Strong, K., Sussmann, R., Warneke, T., and Wood, S.: Comparison be-tween SCIAMACHY scientific products and ground-based FTIR data for total columns of CO, CH4, and N2O, in Proceedings of Second Workshop on the Atmospheric Chemistry Validation of ENVISAT (ACVE-2; (http://envisat.esa.int/workshops/acve2/), ESA/ESRIN, Frascati, Italy, 3–7 May 2004, 2004.
Emmons, L. K., Deeter, M. N., Gille, J. C., Edwards, D. P., Atti`e, J.-L., Warner, J., Ziskin, D., Francis, G., Khattatov, B., Yudin, V., Lamarque, J.-F., Ho, S.-P., Mao, D., Chen, J. S., Drum-mond, J., Novelli, P., Sachse, G., Coffey, M. T., Hannigan, J. W., Gerbig, C., Kawakami, S., Kondo, Y., Takegawa, N., Schlager, H., Baehr, J., and Ziereis, H.: Validation of Measure-ments of Pollution in the Troposphere (MOPITT) CO retrievals with aircraft in situ profiles, J. Geophys. Res., 109, D03309, doi:10.1029/2003JD004101, 2004.
Gloudemans, A. M. S., Schrijver, H., Straume, A. G., Aben, I., Maurellis, A. N., Buchwitz, M., de Beek, R., Frankenberg, C., Wagner, T., and Meirink, J. F.: CH4 and CO total columns from SCIAMACHY: Comparisons with TM3 and MOPITT, in Proceedings of Second Workshop on the Atmospheric Chem-istry Validation of ENVISAT (ACVE-2; (http://envisat.esa.int/ workshops/acve2/), ESA/ESRIN, Frascati, Italy, 3–7 May 2004, 2004.
Holloway, T., Levy II, H., and Kasibhatla, P.: Global distribution of carbon monoxide, J. Geophys. Res., 105, 12 123–12 147, 2000. Kleipool, Q.: SCIAMACHY: Recalculation of OPTEC5
Non-Linearity, Tech. Rep. SRON-SCIA-PhE- RP-013 (available from the author ([email protected])), SRON, Utrecht, The Netherlands, 2003.
Kobayashi, H., Shimota, A., Kondo, K., Okumura, E., Kameda, Y., Shimoda, H., and Ogawa, T.: Development and evaluation of the Interferometric Monitor for Greenhouse Gases: a high through-put Fourier transform infrared radiometer for nadir Earth obser-vations, Appl. Opt., 38, 6801–6807, 1999.
No¨el, S., Buchwitz, M., and Burrows, J. P.: First retrieval of global water vapour column amounts from SCIAMACHY measure-ments, Atmos. Chem. Phys., 4, 111–125, 2004,
SRef-ID: 1680-7324/acp/2004-4-111.
Press, W., Teukolsky, S., Vetterling, W., and Flannery, B.: Numer-ical Recipes in Fortran, Cambridge University Press, London, 1992.
Reichle Jr., H. G., Anderson, B. E., Connors, V. S., Denkins, T. C., Forbes, D. A., Gormsen, B. B., Langenfels, R. L., Neil, D. O., Nolf, S. R., Novelli, P. C., Pougatchev, N. S., Roell, M. M., and Steele, L. P.: Space shuttle based global CO measurements dur-ing April and October 1994, MAPS instrument, data reduction, and data validation, J. Geophys. Res., 104, 21 443–21 454, 1999. Rodgers, C. D. and Connor, B. J.: Intercomparison of re-mote sounding instruments, J. Geophys. Res., 108(D3), 4116, doi:10.1029/2002JD002299, 2003.
Rothman, L. S., Barbe, A., Benner, D. C., Brown, L. R., Camy-Peyret, C., Carleer, M. R., Chance, K., Clerbaux, C., Dana, V., Devi, V. M., Fayt, A., Flaud, J. M., Gamache, R. R., Goldman, A., Jacquemart, D., Jucks, K. W., Lafferty, W. J., Mandin, J. Y., Massie, S. T., Nemtchinov, V., Newnham, D. A., Perrin, A., Rins-land, C. P., Schroeder, J., Smith, K. M., Smith, M. A. H., Tang, K., Toth, R. A., Vander Auwera, J., Varanasi, P., and Yoshino, K.: The HITRAN molecular spectroscopic database: edition of 2000 including updates through 2001, J. Quant. Spectrosc. Ra-diat. Transfer, 82, 5–44, 2003.