HAL Id: hal-00301150
https://hal.archives-ouvertes.fr/hal-00301150
Submitted on 1 Apr 2005HAL is a multi-disciplinary open access
archive for the deposit and dissemination of sci-entific research documents, whether they are pub-lished or not. The documents may come from teaching and research institutions in France or abroad, or from public or private research centers.
L’archive ouverte pluridisciplinaire HAL, est destinée au dépôt et à la diffusion de documents scientifiques de niveau recherche, publiés ou non, émanant des établissements d’enseignement et de recherche français ou étrangers, des laboratoires publics ou privés.
Validation of SCIAMACHY AMC-DOAS water vapour
columns
S. Noël, M. Buchwitz, H. Bovensmann, J. P. Burrows
To cite this version:
S. Noël, M. Buchwitz, H. Bovensmann, J. P. Burrows. Validation of SCIAMACHY AMC-DOAS water vapour columns. Atmospheric Chemistry and Physics Discussions, European Geosciences Union, 2005, 5 (2), pp.1925-1942. �hal-00301150�
ACPD
5, 1925–1942, 2005 SCIAMACHY water vapour validation S. No ¨el et al. Title Page Abstract Introduction Conclusions References Tables Figures J I J I Back CloseFull Screen / Esc
Print Version Interactive Discussion
EGU Atmos. Chem. Phys. Discuss., 5, 1925–1942, 2005
www.atmos-chem-phys.org/acpd/5/1925/ SRef-ID: 1680-7375/acpd/2005-5-1925 European Geosciences Union
Atmospheric Chemistry and Physics Discussions
Validation of SCIAMACHY AMC-DOAS
water vapour columns
S. No ¨el, M. Buchwitz, H. Bovensmann, and J. P. Burrows
Institute of Environmental Physics/Remote Sensing, University of Bremen, Germany Received: 25 January 2005 – Accepted: 7 March 2005 – Published: 1 April 2005 Correspondence to: S. No ¨el ([email protected])
ACPD
5, 1925–1942, 2005 SCIAMACHY water vapour validation S. No ¨el et al. Title Page Abstract Introduction Conclusions References Tables Figures J I J I Back CloseFull Screen / Esc
Print Version Interactive Discussion
EGU
Abstract
A first validation of water vapour total column amounts derived from measurements of the SCanning Imaging Absorption spectroMeter for Atmospheric CHartographY (MACHY) in the visible spectral region has been performed. For this purpose, SCIA-MACHY water vapour data have been determined for the year 2003 using an
ex-5
tended version of the Differential Optical Absorption Spectroscopy (DOAS) method, called Air Mass Corrected (AMC-DOAS). The SCIAMACHY results are compared with corresponding water vapour measurements by the Special Sensor Microwave Imager (SSM/I) and with model data from the European Centre for Medium-Range Weather Forecasts (ECMWF).
10
In confirmation of previous results it could be shown that SCIAMACHY derived water vapour columns are typically slightly lower than both SSM/I and ECMWF data, espe-cially over ocean areas. However, these deviations are much smaller than the observed scatter of the data which is caused by the different temporal and spatial sampling and resolution of the data sets. For example, the overall difference with ECMWF data is
15
only −0.05 g/cm2whereas the typical scatter is in the order of 0.5 g/cm2. Both values show almost no variation over the year.
In addition, first monthly means of SCIAMACHY water vapour data have been com-puted. The quality of these monthly means is currently limited by the availability of calibrated SCIAMACHY spectra. Nevertheless, first comparisons with ECMWF data
20
show that SCIAMACHY (and similar instruments) are able to provide a new indepen-dent global water vapour data set.
1. Introduction
It is well known that water vapour is one of the most important atmospheric con-stituents. Most of the atmospheric water vapour is located in the troposphere close
25
vari-ACPD
5, 1925–1942, 2005 SCIAMACHY water vapour validation S. No ¨el et al. Title Page Abstract Introduction Conclusions References Tables Figures J I J I Back CloseFull Screen / Esc
Print Version Interactive Discussion
EGU ation of water vapour concentrations. Especially, water vapour is the major greenhouse
gas. Therefore, the global distribution of water vapour is a relevant input quantity for global atmospheric models aiming to predict weather or climate.
However, global water vapour distributions are difficult to be obtained. Currently, there are several sources for global water vapour data, all of them having their specific
5
advantages and limitations. In-situ measurements by radio sondes probably provide data with the highest accuracy and the best vertical resolution; however, these mea-surements only cover a small horizontal area, and the distribution of radio sonde sta-tions over the Earth is rather inhomogeneous. Especially over the oceans and in the southern hemisphere large regions are not covered by radio sonde data.
10
Remote sensing data from satellite based instruments provide the possibility to fill these gaps, but they are typically limited in vertical and temporal resolution. Water vapour can be measured from space by various techniques. Most commonly used are microwave (MW) sensors like the Special Sensor Microwave Imager (SSM/I) which are able to provide total water vapour columns at a high spatial (horizontal) resolution
15
(Bauer and Schluessel, 1993). However, the MW retrieval is usually constrained to ocean areas.
Instruments operating at other spectral regions like in the near infrared (NIR) – such as e.g. the Moderate Resolution Imaging Spectroradiometer (MODIS) on Aqua/Terra (Gao and Kaufman,2003) and the Medium Resolution Imaging Spectrometer (MERIS)
20
on ENVISAT (Li et al.,2003) – can derive total water vapour columns also over land. Unfortunately, NIR sensors can not see through clouds which also limits the retrieval.
Another recently developed method for the retrieval of water vapour distributions is the utilisation of data from the Global Positioning System (GPS) satellites (see e.g.Dai et al.,2002).
25
In addition, several investigations have shown that also measurements performed by the Global Ozone Monitoring Experiment (GOME, see e.g. Burrows et al.,1999) and the SCanning Imaging Absorption spectroMeter for Atmospheric CHartographY (SCIAMACHY, see e.g. Bovensmann et al., 1999) in the visible spectral region may
ACPD
5, 1925–1942, 2005 SCIAMACHY water vapour validation S. No ¨el et al. Title Page Abstract Introduction Conclusions References Tables Figures J I J I Back CloseFull Screen / Esc
Print Version Interactive Discussion
EGU be used to derive global water vapour concentrations (No ¨el et al.,1999,2002,2004a;
Casadio et al., 2000; Maurellis et al., 2000; Lang et al., 2003; Wagner et al., 2003; Buchwitz et al.,2004).
The GOME instrument was started on the second European Remote Sensing Satel-lite (ERS-2) in 1995 and is still operating (although at somewhat degraded performance
5
and coverage). SCIAMACHY is an extended version of GOME and part of the atmo-spheric chemistry payload of the European Environmental Satellite ENVISAT which was launched in March 2002. The combination of GOME and SCIAMACHY data al-ready now covers a time span of 9–10 years which may extend even further, depending of the life time of SCIAMACHY (or ENVISAT). In addition, the GOME-2 instruments on
10
the series of operational meteorological satellites Metop (the first one to be launched by the end of 2005) will continue this data set. Therefore, an analysis of these GOME-type instrument data can lead to an additional, independent global water vapour climatology (see alsoLang and Lawrence,2004).
The current paper presents recent results of the so-called “Air Mass Corrected
Dif-15
ferential Optical Absorption Spectroscopy” (AMC-DOAS) method which has been ap-plied to SCIAMACHY nadir measurements in the spectral region at about 700 nm. No ¨el et al.(2004a) already showed that it is possible to derive good water vapour total columns from SCIAMACHY measurements using the AMC-DOAS method. However, these results were based on only a small amount of analysed data (some days of
mea-20
surements). In the current paper we will extend the validation of the AMC-DOAS water vapour results to a longer period of time, namely the whole year 2003. Furthermore, we will present the first global monthly mean water vapour data from SCIAMACHY.
ACPD
5, 1925–1942, 2005 SCIAMACHY water vapour validation S. No ¨el et al. Title Page Abstract Introduction Conclusions References Tables Figures J I J I Back CloseFull Screen / Esc
Print Version Interactive Discussion
EGU
2. The AMC-DOAS retrieval method
The AMC-DOAS retrieval method has been extensively discussed inNo ¨el et al.(2004a) and No ¨el et al. (2004b)1. Therefore, only a small summary of the algorithm will be given here.
Similar to the well-known DOAS (Differential Optical Absorption Spectroscopy)
ap-5
proach the AMC-DOAS method derives information about the amount of an atmo-spheric species from differential absorption structures in sun-normalised radiances. The AMC-DOAS method does not require absolutely calibrated radiances and irradi-ances, as long as the differential structures are not affected by calibration issues. The method is numerically fast and therefore well suited for operational data processing.
10
The main differences between AMC-DOAS and standard DOAS are as follows:
1) In standard DOAS, which is only applicable in the optically thin case, the absorp-tion depth in the differential spectra is proportional to the absorber amount. Water vapour has highly structured absorption features (saturated and non-saturated lines) which are not resolved by GOME or SCIAMACHY. Therefore, the relation between
ab-15
sorption depth and absorber amount becomes non-linear, which is considered by the AMC-DOAS method.
2) The AMC-DOAS method includes an Air Mass Factor (AMF) correction derived from O2 absorption features in same spectral region as the water vapour absorption. This is why the fitting window for the AMC-DOAS water vapour retrieval has been
20
selected to be 688 nm to 700 nm, where both water vapour and molecular oxygen show absorptions of similar strength.
The main purpose of the AMF correction factor is to correct the retrieved water vapour column, but beside this the AMF correction factor can be used as an inherent quality check for the retrieved data. The AMC-DOAS retrieval assumes a cloud-free
25
tropical background atmosphere and does not consider different surface elevations. If
1
No ¨el, S., Buchwitz, M., Burrows, J. P., Eichmann, K.-U., and Bovensmann, H.: Water Vapour Column Retrieval from SCIAMACHY, Adv. Space Res., submitted, 2004b.
ACPD
5, 1925–1942, 2005 SCIAMACHY water vapour validation S. No ¨el et al. Title Page Abstract Introduction Conclusions References Tables Figures J I J I Back CloseFull Screen / Esc
Print Version Interactive Discussion
EGU the derived AMF correction is too large, this is an indication that these assumptions
are not valid (most likely because the observed scene is too cloudy or contains a high mountain area).
Therefore, as in previous studies, only results with an AMF correction factor larger than 0.8 have been taken into account. Currently, the AMC-DOAS retrieval is limited to
5
solar zenith angles (SZAs) below 88◦.
Note that in the present study – in contrast to No ¨el et al. (2004a) – no additional scaling factor has been applied to the retrieved columns to better match correlative data. This was no longer necessary after using an updated (narrower) SCIAMACHY slit function (No ¨el et al., 2004b)2. As a consequence, the AMC-DOAS results do not
10
rely on any other measurement data, e.g. comparisons with ground based radio sonde measurements. The retrieved water vapour columns therefore provide an completely independent data set.
3. Data bases
In the present paper, SCIAMACHY water vapour data are compared with SSM/I
mea-15
surements and model data from the European Centre for Medium-Range Weather Forecasts (ECMWF).
The SCIAMACHY water vapour data have been derived by applying the AMC-DOAS retrieval method to all available SCIAMACHY nadir data for the year 2003. Because there is no complete consolidated set of SCIAMACHY calibrated spectra (Level 1 data)
20
available yet, the analysis is based on a combination of both consolidated and uncon-solidated near-real-time (NRT) data. Even after inclusion of the NRT data there are still larger data gaps, especially in November 2003. In this sense the results presented in the next section are still of preliminary nature.
2
No ¨el, S., Buchwitz, M., Burrows, J. P., Eichmann, K.-U., and Bovensmann, H.: Water Vapour Column Retrieval from SCIAMACHY, Adv. Space Res., submitted, 2004b.
ACPD
5, 1925–1942, 2005 SCIAMACHY water vapour validation S. No ¨el et al. Title Page Abstract Introduction Conclusions References Tables Figures J I J I Back CloseFull Screen / Esc
Print Version Interactive Discussion
EGU To avoid a potential influence of the known insufficient radiometric calibration of the
current Level 1 data (Skupin et al., 2002, 2003) on the retrieval results, always the same (specially calibrated) solar reference spectrum (provided by J. Frerick, ESA) has been used in the retrieval.
The SSM/I data used in the comparison have been taken from the Daily Gridded
5
Integrated Water Vapour Product provided by the Global Hydrology Resource Center (GHRC) at the Global Hydrology and Climate Center, Huntsville, Alabama. We took only data for the descending orbit part of the DMSP F-14 satellite, because its dayside equatorial crossing time of about 08:00 LT is close to the ENVISAT dayside equatorial crossing time of 10:00 LT. Because SSM/I is a MW sensor, only data over ocean are
10
available.
The ECMWF water vapour columns have been calculated using assimilated meteo-rological fields (geopotential height, temperature, pressure, and specific humidity) from the operational daily analysis data. These data are provided on a 1.5◦×1.5◦ spatial grid at 60 altitude levels every 6 h. The 6-h values have been combined and integrated
15
over height to derive the total vertical water vapour column. Afterwards, daily averages of the columns have been computed for each grid point. Note that the ECMWF data are not completely independent from SSM/I data because SSM/I results have been assimilated into the ECMWF model.
For the inter-comparison all SCIAMACHY and ECMWF data have been (re-)gridded
20
to the spatial resolution of the SSM/I data which is 0.5◦×0.5◦.
4. Results
In this section, two types of results will be presented. First, we will show a time series of (globally averaged) deviations between SCIAMACHY total water vapour columns and SSM/I and ECMWF data for the year 2003. Then we will compare global maps of
25
ACPD
5, 1925–1942, 2005 SCIAMACHY water vapour validation S. No ¨el et al. Title Page Abstract Introduction Conclusions References Tables Figures J I J I Back CloseFull Screen / Esc
Print Version Interactive Discussion
EGU 4.1. Time series
The time series data have been generated in the following way: (1) Determine col-locations of (daily gridded) SCIAMACHY water vapour total columns between 0 and 7 g/cm2(which is about the total range of columns) and correlative data. (2) Compute the absolute differences SCIAMACHY−SSM/I and SCIAMACHY−ECMWF for this
col-5
located data set. (3) Compute the weighted daily means and standard deviations by averaging over all collocated grid points. The weights are chosen to be the cosine of the geographic latitude. The reason for these weights is that the input data are on an equidistant latitude/longitude grid which is not representative for the surface area of the Earth. Therefore, without proper weights, high latitude columns would contribute too
10
much to the global mean. (4) The global monthly means are then derived by averaging the daily means over one month.
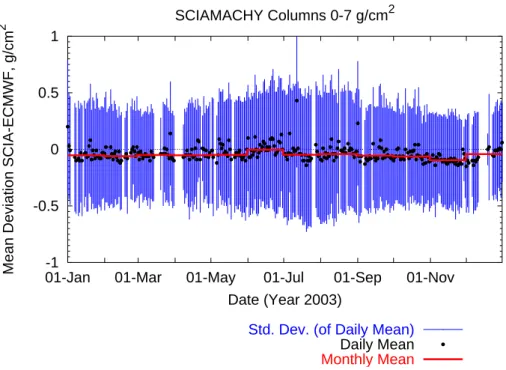
The results of this procedure are shown in Figs.1and2. The black circles mark the daily means, the blue vertical lines are the corresponding daily standard deviations, and the red line denotes the monthly mean.
15
As can be seen from these figures, the standard deviation of the data is in both the comparisons with SSM/I and ECMWF quite high (about 0.5 g/cm2, maybe somewhat higher for SSM/I data). This magnitude of scatter has been observed before (see e.g. No ¨el et al.,2004a;Lang and Lawrence,2004). It can be mainly attributed to the large temporal and spatial variability of atmospheric water vapour.
20
The scatter of the daily mean values is significantly smaller. For the comparison with SSM/I data it is about 0.1–0.2 g/cm2, and even less (∼0.1 g/cm2) for the comparison with ECMWF.
The monthly averages are quite constant over the year 2003. The SCIAMACHY water vapour columns are in the order of 0.2 g/cm2lower than the corresponding SSM/I
25
results whereas the typical deviation between SCIAMACHY and ECMWF data is only −0.05 g/cm2 which is one magnitude lower than the observed daily scatter. Thus, the SCIAMACHY data agree very well with ECMWF data throughout the year.
ACPD
5, 1925–1942, 2005 SCIAMACHY water vapour validation S. No ¨el et al. Title Page Abstract Introduction Conclusions References Tables Figures J I J I Back CloseFull Screen / Esc
Print Version Interactive Discussion
EGU 4.2. Monthly means
Monthly means of SCIAMACHY and ECMWF data have been computed by averaging all available data for a specific month at each grid point. No special weighting is nec-essary, because only data of the same geolocation are averaged. Note that no direct comparisons with SSM/I monthly means are shown, because SSM/I data are used as
5
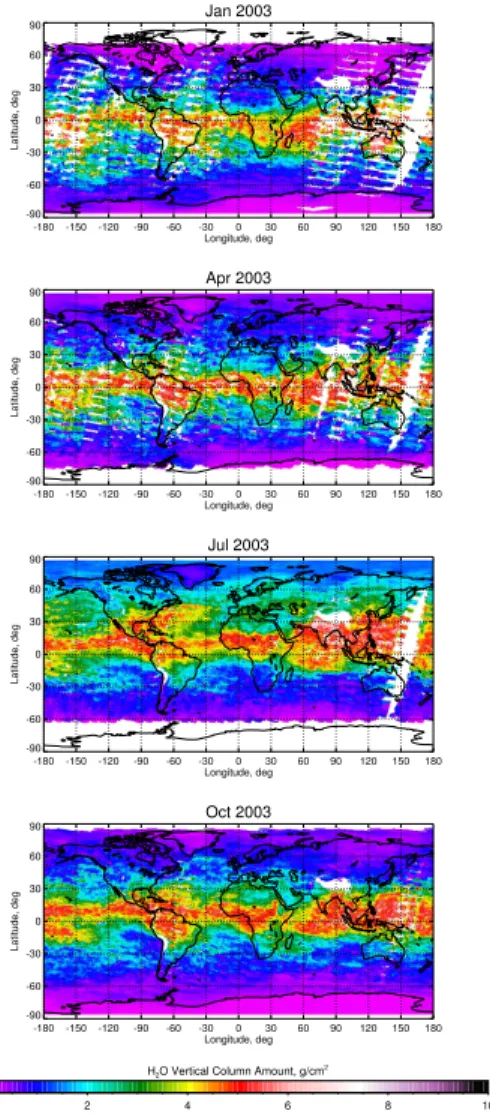
input for the ECMWF model; a comparison would therefore yield no new results. Figure3shows the resulting means of SCIAMACHY total water vapour column data for the months January, April, July and October 2003, corresponding to different sea-sons.
The overall picture of the SCIAMACHY monthly means seems quite reasonable.
10
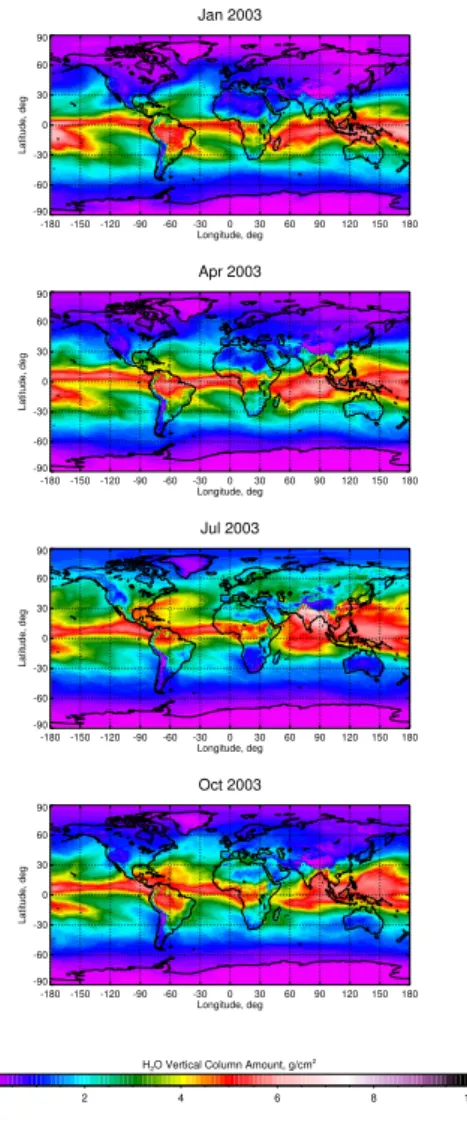
The SCIAMACHY results are quite similar to the corresponding water vapour monthly means derived from ECMWF data displayed in Fig. 4. There is high humidity in the tropics, low humidity at higher latitudes. The movement of the inner tropical conver-gence zone (ITCZ) with season is clearly visible from the shift of high water vapour columns in the tropics.
15
For some regions there are no SCIAMACHY water vapour data available (white ar-eas in Fig. 3). Except for those northern or southern regions, where there are no SCIAMACHY data because of a too high solar zenith angle, these gaps are mainly caused by the incomplete SCIAMACHY Level 1 data set; this is especially evident in November 2003 (not shown) where no data over the Atlantic ocean are available.
How-20
ever, there are also some regions where there are no SCIAMACHY water vapour data for the whole year, like over the Himalaya and the Andes. These gaps are not caused by missing Level 1 data but they correspond to regions which are regularly masked out by the AMC-DOAS quality check. This is expected, because the background at-mosphere of high mountain areas is extremely different from the one assumed in the
25
retrieval. In fact, this shows that the AMC-DOAS quality check is working correctly, which adds confidence to the SCIAMACHY AMC-DOAS water vapour data product.
ex-ACPD
5, 1925–1942, 2005 SCIAMACHY water vapour validation S. No ¨el et al. Title Page Abstract Introduction Conclusions References Tables Figures J I J I Back CloseFull Screen / Esc
Print Version Interactive Discussion
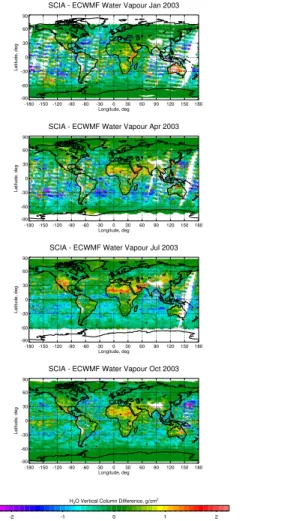
EGU ample, in summer 2003 the humidity over the Sahara desert is much higher in
SCIA-MACHY data than expected from the ECMWF model data. This can be seen more clearly in Fig.5, where the absolute differences between SCIAMACHY and ECMWF water vapour monthly means are plotted. Noting that any deviation below the typical scatter of the water vapour data of 0.5 g/cm2(i.e. the green areas on the plots) can be
5
considered as a good agreement, the difference plots show in general quite encourag-ing results.
Looking a bit more into the details of Fig. 5 reveals that the agreement between SCIAMACHY and ECMWF data over land seems to be somewhat better than over ocean. Ocean areas are quite noisy in the difference plots. The SCIAMACHY data
10
over ocean tend to be lower than the corresponding ECMWF monthly means. This is in line with the results of the comparison with SSM/I data in the previous subsection. Over the continents, the agreement between both data sets is quite good except for some specific regions at certain times where SCIAMACHY columns are higher than the ECMWF values. This over-estimation of the water vapour content by SCIAMACHY
15
(or the under-estimation by the ECMWF model) seems to occur preferably over desert regions like the above mentioned southern Sahara during Summer and western parts of North America. This may indicate an influence of the surface albedo. In addition, the different surface elevation which is is not considered by the AMC-DOAS retrieval may play a role. On the other hand, problems of the ECMWF model data at these regions
20
can also not be excluded, because it is unclear how many real measurements (e.g. radio sonde data) went into the model at these locations.
Furthermore, the different temporal and spatial coverage of SCIAMACHY and ECMWF data may play a role here. As long as there are still large amounts of SCIA-MACHY Level 1 data missing no final conclusion on the quality of a monthly mean
25
ACPD
5, 1925–1942, 2005 SCIAMACHY water vapour validation S. No ¨el et al. Title Page Abstract Introduction Conclusions References Tables Figures J I J I Back CloseFull Screen / Esc
Print Version Interactive Discussion
EGU
5. Summary and conclusions
A first preliminary validation of SCIAMACHY water vapour columns derived by the AMC-DOAS method has been performed. The interpretation of the results of this effort is somewhat limited by the amount of currently available SCIAMACHY calibrated spec-tra. Comparisons with SSM/I and ECMWF data for the year 2003 show in general a
5
good agreement. A high scatter of about 0.5 g/cm2is visible throughout the year. This scatter is mainly caused by atmospheric variability which in general makes a validation of water vapour columns more difficult.
The global mean SCIAMACHY AMC-DOAS water vapour columns tend to be lower than the correlative data. The agreement of SCIAMACHY results with ECMWF data
10
is somewhat better than with SSM/I data which confirms previous findings which were based on a smaller data set.
As a first step towards a SCIAMACHY (or GOME-type) water vapour climatology reasonable global maps of monthly mean water vapour columns could be derived. Comparisons with corresponding ECMWF monthly means showed in general a good
15
agreement, although there are some discrepancies especially over ocean and desert areas which require further investigation.
Acknowledgements. SCIAMACHY is a national contribution to the ESA ENVISAT project,
funded by Germany, The Netherlands, and Belgium.
SCIAMACHY data have been provided by ESA. SSM/I data have been provided by the Global
20
Hydrology Resource Center (GHRC) at the Global Hydrology and Climate Center, Huntsville, Alabama. We thank the European Center for Medium Range Weather Forecasting (ECMWF) for providing us with analysed meteorological fields.
This work has been funded by the BMBF via GSF/PT-UKF, by DLR-Bonn, and by the University of Bremen.
25
ACPD
5, 1925–1942, 2005 SCIAMACHY water vapour validation S. No ¨el et al. Title Page Abstract Introduction Conclusions References Tables Figures J I J I Back CloseFull Screen / Esc
Print Version Interactive Discussion
EGU
References
Bauer, P. and Schluessel, P.: Rainfall, total water, ice water, and water vapor over sea from polarized microwave simulations and Special Sensor Microwave/Imager data, J. Geophys. Res., 98, 20 737–20 759, 1993. 1927
Bovensmann, H., Burrows, J. P., Buchwitz, M., Frerick, J., No ¨el, S., Rozanov, V. V., Chance,
5
K. V., and Goede, A. H. P.: SCIAMACHY – Mission Objectives and Measurement Modes, J. Atmos. Sci., 56, 127–150, 1999. 1927
Buchwitz, M., No ¨el, S., Bramstedt, K., Rozanov, V. V., Bovensmann, H., Tsvetkova, S., and Burrows, J. P.: Retrieval of trace gas vertical columns from SCIAMACHY/ENVISAT near-infrared nadir spectra: First preliminary results, Adv. Space Res., 34, 809–814, 2004. 1928
10
Burrows, J. P., Weber, M., Buchwitz, M., Rozanov, V., Ladst ¨atter-Weißenmayer, A., Richter, A., de Beek, R., Hoogen, R., Bramstedt, K., Eichmann, K.-U., Eisinger, M., and Perner, D.: The Global Ozone Monitoring Experiment (GOME): Mission Concept and First Scientific Results, J. Atmos. Sci., 56, 151–175, 1999. 1927
Casadio, S., Zehner, C., Pisacane, G., and Putz, E.: Empirical retrieval of the atmospheric air
15
mass factor (ERA) for the measurement of water vapour vertical contenet using GOME data, Geophys. Res. Lett., 27, 1483–1486, 2000. 1928
Dai, A., Wang, J., Ware, R. H., and Hove, T. V.: Diurnal variation in water vapor over North America and its implications for sampling errors in radiosonde humidity, J. Geophys. Res., 107, 10.1029/2001JD000642, 2002. 1927
20
Gao, B.-C. and Kaufman, Y. J.: Water vapor retrievals using Moderate Resolution Imag-ing Spectroradiometer (MODIS) near-infrared channels, J. Geophys. Res., 108, 4389, doi:10.1029/2002JD003023, 2003. 1927
Lang, R. and Lawrence, M. G.: Evaluation of the hydrological cycle of MATCH driven by NCEP reanalysis data: comparison with GOME water vapor field measurements, Atmos. Chem.
25
Phys. Discuss., pp. 7917–7984, 2004. 1928,1932
Lang, R., Williams, J. E., van der Zande, W. J., and Maurellis, A. N.: Application of the Spectral Structure Parameterization technique: retrieval of total water vapor columns from GOME, Atmos. Chem. Phys., 3, 145–160, 2003,
SRef-ID: 1680-7324/acp/2003-3-145. 1928
30
Li, Z., Muller, J.-P., Cross, P., Albert, P., Hewison, T., Watson, R., Fischer, J., and Bennartz, R.: Validation of MERIS Near IR Water Vapour Retrievals Using MWR and GPS Measurements,
ACPD
5, 1925–1942, 2005 SCIAMACHY water vapour validation S. No ¨el et al. Title Page Abstract Introduction Conclusions References Tables Figures J I J I Back CloseFull Screen / Esc
Print Version Interactive Discussion
EGU in Proceedings of the MERIS User Workshop 10–13 November 2003 ESA-ESRIN, Frascati,
Italy,http://envisat.esa.int/workshops/meris03/proceedings.html, 2003. 1927
Maurellis, A. N., Lang, R., van der Zande, W. J., Aben, I., and Ubachs, W.: Precipitable Water Vapor Column Retrieval from GOME Data, Geophys. Res. Lett., 27, 903–906, 2000. 1928 No ¨el, S., Buchwitz, M., Bovensmann, H., Hoogen, R., and Burrows, J. P.: Atmospheric Water
5
Vapor Amounts Retrieved from GOME Satellite Data, Geophys. Res. Lett., 26, 1841–1844, 1999. 1928
No ¨el, S., Buchwitz, M., Bovensmann, H., and Burrows, J. P.: Retrieval of total water vapour column amounts from GOME/ERS-2 data, Adv. Space Res., 29, 1697–1702, 2002. 1928 No ¨el, S., Buchwitz, M., and Burrows, J. P.: First retrieval of global water vapour column amounts
10
from SCIAMACHY measurements, Atmos. Chem. Phys., 4, 111–125, 2004a, SRef-ID: 1680-7324/acp/2004-4-111. 1928,1929,1930,1932
Skupin, J., No ¨el, S., Wuttke, M. W., Bovensmann, H., and Burrows, J. P.: Calibration of SCIA-MACHY in-flight measured irradiances and radiances – First results of level 1 validation, in Proc. ENVISAT Validation Workshop, ESRIN/Frascati, SP-531, ESA Publications Divison,
15
2002. 1931
Skupin, J., No ¨el, S., Wuttke, M. W., Bovensmann, H., Burrows, J. P., Hoogeveen, R., Kleipool, Q., and Lichtenberg, G.: In-flight calibration of the SCIAMACHY solar irradiance spectrum, Adv. Space Res., 32, 2129–2134, 2003. 1931
Wagner, T., Heland, J., Z ¨oger, M., and Platt, U.: A fast H2O total column density product from
20
GOME – Validation with in-situ aircraft measurements, Atmos. Chem. Phys., 3, 651–663, 2003,
ACPD
5, 1925–1942, 2005 SCIAMACHY water vapour validation S. No ¨el et al. Title Page Abstract Introduction Conclusions References Tables Figures J I J I Back CloseFull Screen / Esc
Print Version Interactive Discussion EGU -1 -0.5 0 0.5 1
01-Jan 01-Mar 01-May 01-Jul 01-Sep 01-Nov
Mean Deviation SCIA-SSM/I, g/cm
2
Date (Year 2003)
SCIAMACHY Columns 0-7 g/cm2
Std. Dev. (of Daily Mean)
Daily Mean Monthly Mean
Fig. 1. Global mean and standard deviation of the difference between collocated SCIAMACHY and SSM/I water vapour columns for the year 2003.
ACPD
5, 1925–1942, 2005 SCIAMACHY water vapour validation S. No ¨el et al. Title Page Abstract Introduction Conclusions References Tables Figures J I J I Back CloseFull Screen / Esc
Print Version Interactive Discussion EGU -1 -0.5 0 0.5 1
01-Jan 01-Mar 01-May 01-Jul 01-Sep 01-Nov
Mean Deviation SCIA-ECMWF, g/cm
2
Date (Year 2003)
SCIAMACHY Columns 0-7 g/cm2
Std. Dev. (of Daily Mean)
Daily Mean Monthly Mean
Fig. 2. Global mean and standard deviation of the difference between collocated SCIAMACHY and ECMWF water vapour columns for the year 2003.
ACPD
5, 1925–1942, 2005 SCIAMACHY water vapour validation S. No ¨el et al. Title Page Abstract Introduction Conclusions References Tables Figures J I J I Back CloseFull Screen / Esc
Print Version Interactive Discussion EGU Jan 2003 -180 -150 -120 -90 -60 -30 0 30 60 90 120 150 180 Longitude, deg -90 -60 -30 0 30 60 90 Latitude, deg Apr 2003 -180 -150 -120 -90 -60 -30 0 30 60 90 120 150 180 Longitude, deg -90 -60 -30 0 30 60 90 Latitude, deg Jul 2003 -180 -150 -120 -90 -60 -30 0 30 60 90 120 150 180 Longitude, deg -90 -60 -30 0 30 60 90 Latitude, deg Oct 2003 -180 -150 -120 -90 -60 -30 0 30 60 90 120 150 180 Longitude, deg -90 -60 -30 0 30 60 90 Latitude, deg 0 2 4 6 8 10
H2O Vertical Column Amount, g/cm2
ACPD
5, 1925–1942, 2005 SCIAMACHY water vapour validation S. No ¨el et al. Title Page Abstract Introduction Conclusions References Tables Figures J I J I Back CloseFull Screen / Esc
Print Version Interactive Discussion EGU Jan 2003 -180-150-120 -90 -60 -30 0 30 60 90 120 150 180 Longitude, deg -90 -60 -30 0 30 60 90 Latitude, deg Apr 2003 -180-150-120 -90 -60 -30 0 30 60 90 120 150 180 Longitude, deg -90 -60 -30 0 30 60 90 Latitude, deg Jul 2003 -180-150-120 -90 -60 -30 0 30 60 90 120 150 180 Longitude, deg -90 -60 -30 0 30 60 90 Latitude, deg Oct 2003 -180-150-120 -90 -60 -30 0 30 60 90 120 150 180 Longitude, deg -90 -60 -30 0 30 60 90 Latitude, deg 0 2 4 6 8 10
H2O Vertical Column Amount, g/cm2
ACPD
5, 1925–1942, 2005 SCIAMACHY water vapour validation S. No ¨el et al. Title Page Abstract Introduction Conclusions References Tables Figures J I J I Back CloseFull Screen / Esc
Print Version Interactive Discussion
EGU
SCIA - ECWMF Water Vapour Jan 2003
-180-150-120 -90 -60 -30 0 30 60 90 120 150 180 Longitude, deg -90 -60 -30 0 30 60 90 Latitude, deg
SCIA - ECWMF Water Vapour Apr 2003
-180-150-120 -90 -60 -30 0 30 60 90 120 150 180 Longitude, deg -90 -60 -30 0 30 60 90 Latitude, deg
SCIA - ECWMF Water Vapour Jul 2003
-180-150-120 -90 -60 -30 0 30 60 90 120 150 180 Longitude, deg -90 -60 -30 0 30 60 90 Latitude, deg
SCIA - ECWMF Water Vapour Oct 2003
-180-150-120 -90 -60 -30 0 30 60 90 120 150 180 Longitude, deg -90 -60 -30 0 30 60 90 Latitude, deg -2 -1 0 1 2
H2O Vertical Column Difference, g/cm2
Fig. 5. Difference between SCIAMACHY and ECMWF monthly means of total water vapour columns for the year 2003.