HAL Id: hal-00295971
https://hal.archives-ouvertes.fr/hal-00295971
Submitted on 6 Jul 2006
HAL is a multi-disciplinary open access
archive for the deposit and dissemination of
sci-entific research documents, whether they are
pub-lished or not. The documents may come from
teaching and research institutions in France or
abroad, or from public or private research centers.
L’archive ouverte pluridisciplinaire HAL, est
destinée au dépôt et à la diffusion de documents
scientifiques de niveau recherche, publiés ou non,
émanant des établissements d’enseignement et de
recherche français ou étrangers, des laboratoires
publics ou privés.
by WFM-DOAS: version 0.5 CO and CH4 and impact of
calibration improvements on CO2 retrieval
M. Buchwitz, R. de Beek, S. Noël, J. P. Burrows, H. Bovensmann, O.
Schneising, I. Khlystova, M. Bruns, H. Bremer, P. Bergamaschi, et al.
To cite this version:
M. Buchwitz, R. de Beek, S. Noël, J. P. Burrows, H. Bovensmann, et al.. Atmospheric carbon gases
retrieved from SCIAMACHY by WFM-DOAS: version 0.5 CO and CH4 and impact of calibration
improvements on CO2 retrieval. Atmospheric Chemistry and Physics, European Geosciences Union,
2006, 6 (9), pp.2727-2751. �hal-00295971�
Atmos. Chem. Phys., 6, 2727–2751, 2006 www.atmos-chem-phys.net/6/2727/2006/ © Author(s) 2006. This work is licensed under a Creative Commons License.
Atmospheric
Chemistry
and Physics
Atmospheric carbon gases retrieved from SCIAMACHY by
WFM-DOAS: version 0.5 CO and CH
4
and impact of calibration
improvements on CO
2
retrieval
M. Buchwitz1, R. de Beek1, S. No¨el1, J. P. Burrows1, H. Bovensmann1, O. Schneising1, I. Khlystova1, M. Bruns1, H. Bremer1, P. Bergamaschi2, S. K¨orner3, and M. Heimann3
1Institute of Environmental Physics (IUP), University of Bremen FB1, Bremen, Germany 2Institute for Environment and Sustainability, Joint Research Centre (EC-JRC-IES), Ispra, Italy 3Max Planck Institute for Biogeochemistry (MPI-BGC), Jena, Germany
Received: 13 October 2005 – Published in Atmos. Chem. Phys. Discuss.: 3 January 2006 Revised: 31 March 2006 – Accepted: 6 June 2006 – Published: 6 July 2006
Abstract. The three carbon gases carbon monoxide (CO),
carbon dioxide (CO2), and methane (CH4) are important at-mospheric constituents affecting air quality and climate. The near-infrared nadir spectra measured by SCIAMACHY on ENVISAT contain information on the vertical columns of these gases which we retrieve using a modified DOAS al-gorithm (WFM-DOAS or WFMD). Our main data products are CO vertical columns and dry-air column averaged mix-ing ratios of methane (CH4) and CO2 (denoted XCH4 and XCO2). For CO and CH4we present new results for the year 2003 obtained with an improved version of WFM-DOAS (WFMDv0.5) retrieved from Level 1 version 4 (Lv1v4) spec-tra. This data set has recently been compared with a net-work of ground based FTIR stations. Here we describe the WFMDv0.5 algorithm, present global and regional maps, and comparisons with global reference data. We show that major problems of the previous versions (v0.4 and v0.41) related to the varying ice-layer on the SCIAMACHY chan-nel 8 detector have been solved. Compared to MOPITT the SCIAMACHY CO columns are on average higher by about 10–20%. Regionally, however, especially over central South America, differences can be much larger. For methane we present global and regional maps which are compared to TM5 model simulations performed using standard methane emission inventories. We show that methane source regions can be clearly detected with SCIAMACHY. We also show that the methane data product can be significantly further improved using Lv1v5 spectra with improved calibration. For CO2we present three years of SCIAMACHY CO2 mea-surements over Park Falls, Wisconsin, USA, retrieved from Lv1v5. We show that the quality of CO2 retrieved from
Correspondence to: M. Buchwitz
(michael.buchwitz@iup.physik.uni-bremen.de)
these spectra is significantly higher compared to WFMDv0.4 XCO2retrieved from Lv1v4.
1 Introduction
Carbon monoxide (CO) is a major tropospheric air pollutant and carbon dioxide (CO2) and methane (CH4) are the two most important anthropogenic greenhouse gases. Knowl-edge about the global distribution of these carbon gases is therefore important. CO plays a central role in tropospheric chemistry (see, e.g., Bergamaschi et al., 2000, and references given therein) as CO is the leading sink of the hydroxyl rad-ical (OH) which itself largely determines the oxidizing ca-pacity of the troposphere and, therefore, its self-cleansing ef-ficiency and the concentration of greenhouse gases such as CH4. CO also has large air quality impact as a pre-curser to tropospheric ozone, a secondary pollutant associated with respiratory problems and decreased crop yields. Satellite measurements of CH4, CO2, and CO in combination with in-verse modeling have the potential to help better constrain the uncertainties of the magnitude of the surface fluxes than cur-rently possible with the highly precise but rather sparse data from the network of surface stations (see Houweling et al., 1999, 2004; Rayner and O’Brien, 2001, and references given therein). A better understanding of the sources and sinks of CH4and CO2is important for example to accurately predict the future concentrations of these gases and associated cli-mate change. Monitoring of the emissions of these gases is also required by the Kyoto protocol.
High quality trace gas column retrieval from the SCIA-MACHY near-infrared spectra is a challenging task for many reasons, e.g., due to calibration issues mainly related to high
and variable dark signals and changing detector characteris-tics (Gloudemans et al., 2005), because it is difficult to de-tect the weak CO lines which are close to the noise level and superimposed by strong absorption features of water and methane, and because of the challenging accuracy and pre-cision requirements for CO2 (Rayner and O’Brien, 2001; Houweling et al., 2004) and CH4(Meirink et al., 2006).
When developing a retrieval algorithm many decisions have to be made (selection of spectral fitting window, in-version procedure including definition of fit parameters and use of a priori information, radiative transfer approximations, etc.) to process the data in an optimum way such that a good compromise is achieved between processing speed and ac-curacy/precision of the data products. In this context it is important to point out that other groups are also working on this important topic using different approaches (see Gloude-mans et al., 2004, 2005; Frankenberg et al., 2005a,b,c, 2006; Houweling et al., 2005; Barkley et al., 2006a,b; B¨osch et al., 2006).
SCIAMACHY has not been specified to measure CO2 and CH4 regional surface fluxes in contrast to the fu-ture near-infrared/nadir missions OCO/USA (Crisp et al., 2004) and GOSAT/Japan (http://www.jaxa.jp/missions/ projects/sat/eos/gosat/index e.html) which will have, for ex-ample, higher spectral and spatial resolution compared to SCIAMACHY to maximize spectral information and to have higher probability for cloud free ground pixels. Neverthe-less, SCIAMACHY makes similar measurements as will be performed by OCO and GOSAT and therefore can be con-sidered the predecessor of these dedicated CO2and/or CH4 missions.
Initial carbon gas vertical column data products derived from SCIAMACHY nadir observations with WFM-DOAS version 0.4x (0.4 and 0.41) have been compared with global reference data in Buchwitz et al. (2005b) and ground based Fourier Transform Infra Red (FTIR) spectroscopy measure-ments (De Maziere et al., 2004; Sussmann and Buchwitz, 2005; Warneke et al., 2005; Dils et al., 2005; Sussmann et al., 2005). A comparison of the new version 0.5 CO and methane data products with ground-based FTIR measure-ments has recently been performed by Dils et al. (2006), including a comparison of WFMDv0.4 XCO2 at three sta-tions. Here we present a description of the WFMDv0.5 algo-rithm and a comparison with global reference data. For CO2 we present an initial investigation concerning the impact of recent calibration improvements (e.g., improved dark signal calibration) on the CO2retrieval which will result in a signif-icantly improved CO2(but also methane and potentially CO) data set in the near future.
This paper is organized as follows: In Sect. 2 the SCIA-MACHY instrument is introduced followed by a description of the WFM-DOAS retrieval algorithm in Sect. 3. In Sect. 4 we present and discuss the carbon gas results. Conclusions are given in Sect. 5.
2 The SCIAMACHY instrument
SCIAMACHY (Burrows et al., 1995; Bovensmann et al., 1999) is a spectrometer that measures reflected, scattered and transmitted solar radiation in the spectral region 214– 2380 nm at moderate spectral resolution (0.2–1.6 nm). On the Earth’s day side SCIAMACHY mainly performs a se-quence of alternating nadir and limb observations. The hizontal resolution of the nadir measurements depends on or-bital position and spectral interval but is typically 60 km (e.g., for methane and CO2) or 120 km (e.g., for CO) across track times 30 km along track. These measurements can be inverted to obtain a large number of (primarily) atmospheric data products (Bovensmann et al., 1999).
Overall, the in-flight optical performance of SCIA-MACHY is as expected from the on-ground activities. One exception is a time dependent optical throughput variation in the SCIAMACHY near-infrared (NIR) channels 7 (the main CO2 channel) and 8 (the only CO channel and main CH4channel) due to ice build-up on the detectors which ad-versely affects the trace gas retrieval (Buchwitz et al., 2005b; Gloudemans et al., 2005). This effect is limited by regu-lar heating of the instrument. The WFM-DOAS version 0.5 methane and version 0.4 XCO2results presented in this paper have been derived from channel 6 which is not affected by an ice-layer. The WFM-DOAS version 0.5 CO is retrieved from channel 8 using a correction procedure for ice-layer induced errors.
3 WFM-DOAS retrieval algorithm
The retrieval of a long-lived and therefore relatively well-mixed gas such as carbon dioxide and methane is extremely challenging as only small variations on top of a large back-ground are of relevance in order to obtain information on their surface sources and sinks. Therefore, the retrieval algo-rithm has to be very accurate. In addition, the algoalgo-rithm also has to be very fast to process huge amounts of data. We have developed the Weighting Function Modified Differential Op-tical Absorption Spectroscopy (WFM-DOAS) retrieval algo-rithm to accomplish this task.
WFM-DOAS (Buchwitz et al., 2000b, 2004, 2005a,b; Buchwitz and Burrows, 2004) is an unconstrained linear-least squares method based on scaling (or shifting) pre-selected vertical profiles. The fit parameters for the trace gases are directly the desired vertical columns. The loga-rithm of a linearized radiative transfer model plus a low-order polynomial is fitted to the logarithm of the ratio of a mea-sured nadir radiance and solar irradiance spectrum, i.e. the observed sun-normalized radiance. The WFM-DOAS refer-ence spectra are the logarithm of the sun-normalized radiance and its derivatives computed with a radiative transfer model (Buchwitz et al., 2000a). In order to avoid time-consuming
M. Buchwitz et al.: SCIAMACHY/WFM–DOAS CO, CH4, and CO2columns 2729
Fig. 1. The black symbols show daily averages of the SCIAMACHY WFM-DOAS v0.5 CO column data product over Europe for the year
2003. The CO product has been obtained by multiplying the CO columns from the spectral fit (red symbols) with a correction factor derived from the simultaneously fitted methane columns. The correction factor is the ratio of an a-priori methane column divided by the retrieved methane column which is shown as blue symbols. The green symbols show the average optical throughput of channel 8 determined from ratios of solar spectra. The throughput varies because of a changing ice layer on the channel 8 detector. As can be seen, the methane column is highly correlated with the throughput, indicating a time dependent bias of the retrieved methane column due to the changing ice layer (the correlation coefficient is 0.96 for the entire time period and 0.98 for the time period day 140 to day 230 of year 2003). The uncorrected CO columns (red) show significant day to day variations but a significant correlation with throughput (0.73 for the time period day 140–230) and methane (0.77 for days 140–230).
on-line radiative transfer simulations, a fast look-up table scheme has been implemented.
Due to the varying ice-layers on the channel 7 and 8 de-tectors (see Sect. 2) the in-orbit spectrometer slit function of SCIAMACHY is different from the one measured on-ground and changes with time (Gloudemans et al., 2005; Buchwitz et al., 2005b). The slit function currently used by WFM– DOAS has been determined by applying WFM–DOAS to the in-orbit nadir measurements. The one that resulted in best fits, i.e. the smallest fit residuum, has been selected.
Basically the same algorithm is used to retrieve CO, methane, and CO2. There are however also trace gas specific differences which will be discussed in the following subsec-tions.
3.1 CO specific aspects
Carbon monoxide v0.5 is retrieved from a small spectral fit-ting window (2324–2335 nm) located in channel 8 covering several absorption lines of CO. Compared to our initial v0.4 CO product (Buchwitz et al., 2004, 2005b) v0.5 CO has been significantly improved.
The v0.5 CO column product is retrieved from an opti-mized spectral fitting window and generated without the ap-plication of a scaling factor (the v0.4 product was scaled by a factor 0.5). The shift of the fitting window resulted in CO columns being significantly lower (nearly a factor of two) compared to the fitting window used for v0.4 CO thus elimi-nating the need for significantly downscaling the columns as was necessary for v0.4. This shows that the selection of a fitting window for SCIAMACHY CO retrieval is critical and requires careful analysis of real data especially for a weak
Fig. 2. Ratios of CO columns (black symbols) and methane columns (red symbols) retrieved using different spectrometer slit functions. The
SCIAMACHY slit function is changing with time due to the varying ice layer on the channel 8 detector. The main effect is a broadening of the wings at (nearly) constant full width at half maximum (F W H M) (see Gloudemans et al., 2005, and references given therein) and may be modeled using the slit function f (1λ) given in the annotation of the figure. Here 1λ is the spectral distance (in nm) from the center wavelength of a detector pixel, C is a constant selected such that (numerical) integration of f over wavelength gives unit area, F W H M is the selected full width at half maximum (here: 0.24 nm), and EXP is a parameter that mainly determines the relative contributions of the wings, i.e., the shape of the slit function for |1λ| larger than 0.5×F W H M. As can be seen, both the CO and methane columns change as a function of EXP in a similar but not exactly identical way.
absorbers such as CO with superimposed much stronger ab-sorption features of other gases and potentially calibration errors on the order of the depth of the absorption lines (∼1– 3%). For simulated measurements such a large dependence of the retrieved column on the fitting window has not been found. The probably most important reason for the signifi-cant dependence of the retrieved CO column on the choice of the spectral fitting window is that residual calibration er-rors are more critical for the WFM-DOAS version 0.4 fit-ting window (2359–2370 nm) compared to the version 0.5 fitting window (2324–2335 nm). The version 0.4 fitting win-dow is located at the long wavelength end of channel 8, i.e., at larger wavelength compared to the version 0.5 fitting window, where the nadir radiance is typically much smaller compared to the version 0.5 fitting window because of the decrease of the solar irradiance with increasing wavelength and because of significantly larger absorption of water vapor. Furthermore, also the sensitivity of the instrument is lower at
the end of channel 8 compared to the center of the channel (where the version 0.5 fitting window is located) because of the drop of the detector pixel quantum efficiency at longer wavelength. The retrieval of CO using the version 0.4 fitting window is also adversely affected by much stronger water absorption lines compared to the version 0.5 fitting window as water is a highly variable spectrally interfering gas and ac-curate fitting of the much smaller CO lines is more difficult. In addition, uncertainties in the water vapor spectroscopic line parameters result in less accurate CO columns in case of stronger interfering water lines.
In addition to the optimized fitting window a correction has been applied to reduce time dependent biases caused by the ice-issue (e.g., slit function change), to improve the trieval for partially cloud covered scenes and to make the re-trieval less sensitive to aerosol and albedo variability. The correction is based on the retrieved methane column ob-tained from the same fitting window from which the CO is
M. Buchwitz et al.: SCIAMACHY/WFM–DOAS CO, CH4, and CO2columns 2731
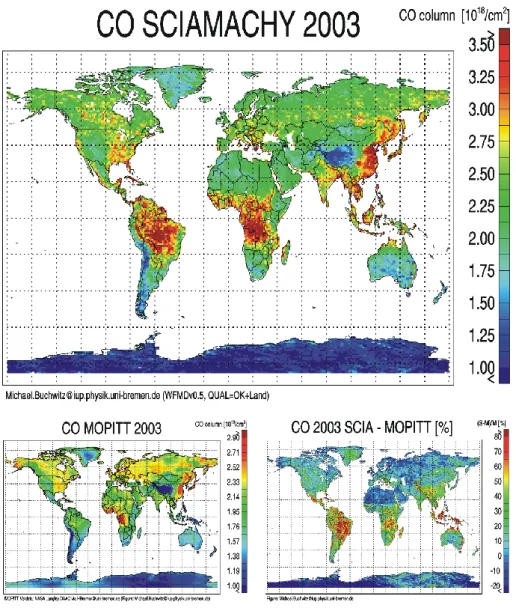
Fig. 3. Year 2003 average of SCIAMACHY/WFM-DOAS version 0.5 CO columns (top) compared to MOPITT operational CO columns
(Lv2V3) over land (bottom left). Note that the scale is different because the SCIAMACHY CO columns are typically higher compared to MOPITT (on average by about 10%). The relative CO column differences (SCIAMACHY–MOPITT) are shown in the bottom right panel.
retrieved. A correction factor, defined as the ratio of an as-sumed (a-priori) methane column (given below) and the re-trieved methane column, is applied to the rere-trieved CO col-umn. The a-priori methane column is computed using a sin-gle (scene independent) methane profile taking into account the surface elevation of the corresponding ground pixel. The assumed methane column is 3.6×10¹⁹ molecules/cm2 for a ground pixel with a surface elevation equal to sea level (corresponding to an assumed surface pressure of 1013 hPa). This approach makes use of the fact that the variability of the methane columns is low (few percent) compared to the variability of the CO columns.
Figure 1 illustrates this approach. It is shown that both the uncorrected CO and methane columns are correlated with the independently measured channel averaged relative
opti-cal throughput determined from ratios of solar spectra. The variation of the throughput is primarily due to the chang-ing thickness of the ice layer on the channel 8 detector. The columns change because of the ice induced slit function changes. Figure 2 shows the typical response of the retrieved columns caused by a changing slit function. As can be seen the response is similar for both gases but not identical. The change of the weak absorber CO is typically larger than the change of the much stronger absorber methane. As a conse-quence our approach to correct the CO column using the re-trieved methane column is not perfect. It will typically result in a correction in the right direction (i.e., towards higher CO columns) but the correction may not be large enough. This is most probably the reason why the corrected CO shown in Fig. 1 for the time period day 190 to day 310 still appears to
follows the throughput curve. We estimate the accuracy of this method to about 10–20%. In Gloudemans et al. (2005) a somewhat different approach is described to use the retrieved methane columns to correct the CO columns for ice-layer in-duced biases.
The WFM-DOAS v0.5 CO column data product contains for each measurement a quality flag to indicate a (potentially) successful measurement. To decide if a measurement is suc-cessful, a number of criteria have been defined based on the value of the root-mean-square of the fit residuum, the CO fit error, and the methane correction factor. The methane cor-rection factor, for example, has to be close to 1.0 (within 20%) for a measurement to be classified as successful. Oth-erwise the disturbances due to clouds, aerosols, surface re-flectivity, calibration issues, etc., are considered too large to be corrected for. Note that because of the correction proce-dure the quality flag does not depend on the cloud mask (i.e., the quality flag is independent of the pixel being classified as cloud contaminated or not). This is also a major difference to version 0.4 CO. Because of this the number of pixels being classified useful for version 0.5 is about ten times larger than for version 0.4.
3.2 Methane specific aspects
For methane we derive dry air column averaged mixing ra-tios XCH4 by normalizing the retrieved methane column with the simultaneously observed airmass estimated by re-trieving the column of a reference gas whose column is less variable than methane. Initially (for v0.4) we used oxygen (O2) columns retrieved from the O2A band (760 nm) (Buch-witz et al., 2005a,b). Unfortunately, the sensitivity of the retrieved O2 column with respect to, e.g. aerosol, is quite different compared to methane mainly because of the large spectral distance between the two fitting windows. For v0.41 XCH4 (Buchwitz et al., 2005b) we use CO2 retrieved from the 1.6 µm region (channel 6). The new v0.5 XCH4 data product is derived in a similar way as the v0.41 data prod-uct, except that methane is retrieved from channel 6 (1629– 1671 nm) instead of channel 8. There are two reasons why methane retrieval from channel 6 should give better results compared to channel 8: (i) channel 6 is not affected by an ice-layer, and (ii) the channel 6 methane absorption band is located close to the channel 6 CO2band thus improving the cancellation of errors when the ratio is computed. This ap-proach has been introduced by Frankenberg et al. (2005c). For each ground pixel a quality flag is set using similar cri-teria as for CO (the cricri-teria are: CH4 and CO2 column fit errors less than 10%; CH4 and CO2 columns within 20% of assumed (a-priori) column (3.6×10¹⁹molecules/cm2 for CH4and 8×10²¹molecules/cm2for CO2for a ground pixel with an average surface elevation corresponding to sea level), SZA less than 88 deg, forward scan pixel (i.e., no fast back scan pixel because of four times larger ground pixel size). As for CO the quality flag is independent of the pixel being
classified as cloud contaminated or not. There is however one difference compared to CO: because of the high accu-racy and precision requirements for methane and the reduced quality of measurements over water, only pixels over land are classified useful.
3.3 Carbon dioxide specific aspects
The SCIAMACHY/WFM-DOAS version 0.4 XCO2retrieval algorithm is described in detail in Buchwitz et al. (2005a) and Buchwitz et al. (2005b). The CO2columns are retrieved using a small spectral fitting window (1558–1594 nm) lo-cated in SCIAMACHY channel 6 which covers one absorp-tion band of CO2and weak absorption features of water va-por. Similar as for methane, dry air column averaged mixing ratios XCO2are determined. The air columns used to nor-malize the CO2 columns are obtained from the simultane-ously measured oxygen (O2) columns retrieved from the O2 A-band (see also Houweling et al., 2005, for SCIAMACHY CO2retrieval and van Diedenhoven et al., 2005, for SCIA-MACHY O2retrieval).
Because of the large spectral distance between the CO2 band (1580 nm) and the O2 band (760 nm) the sensitivity of the spectral nadir measurements with respect to aerosols, (partial) clouds, and surface reflectivity is quite different for CO2and O2. This results in light path length related errors on the retrieved CO2and O2columns which do not perfectly cancel when the CO2to O2column ratio, i.e. XCO2, is com-puted (Buchwitz et al., 2005a). We estimate the XCO2error to about a few percent with both random and systematic com-ponents (Buchwitz et al., 2005a,b).
Because of the high precision and accuracy requirements for XCO2 the contamination by clouds needs to be min-imized as much as possible. In order to identify cloud-contaminated ground pixels we currently use a threshold algorithm based on sub-pixel information provided by the SCIAMACHY Polarization Measurement Devices (PMDs) (details are given in Buchwitz et al., 2005a). In short, we use PMD1 which corresponds to the spectral region 320–380 nm located in the UV part of the spectrum. Strictly speaking, the algorithm detects enhanced backscatter in the UV. Enhanced UV backscatter mainly results from clouds but might also be due to high aerosol loading or high surface UV spectral flectance (despite the low sensitivity of PMD1 for surface re-flectivity changes compared to PMDs 2–7; note that PMD1 has been selected because of its low sensitivity to surface properties). As a result, ice or snow covered surfaces may wrongly be classified as cloud contaminated.
The main problem of WFM-DOAS version 0.4 as ap-plied to Level 1 version 4 (Lv1v4) spectra is a systemat-ically underestimation of the CO2 columns and an over-estimation of the O2 columns (Buchwitz et al., 2005a,b). To compensate for this, the initially retrieved CO2 and O2 columns are scaled with constant factors (1.27 for CO2and 0.85 for O2). The factors have been chosen such that the
M. Buchwitz et al.: SCIAMACHY/WFM–DOAS CO, CH4, and CO2columns 2733
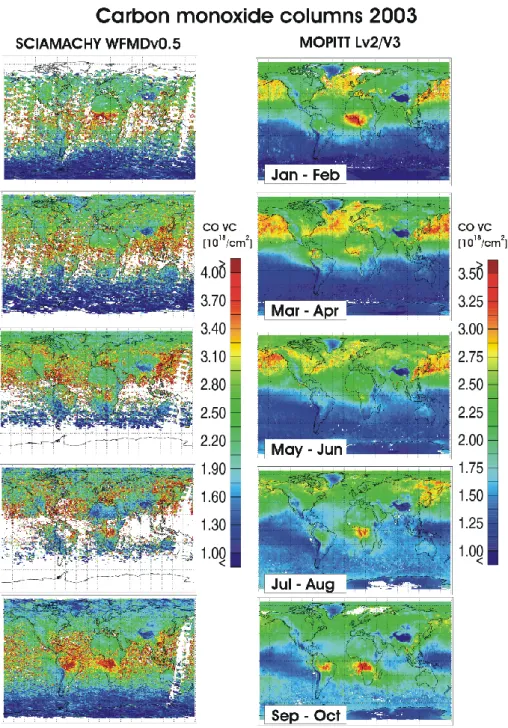
Fig. 4. Comparison of year 2003 bi-monthly averages of SCIAMACHY/WFM-DOAS version 0.5 CO (left) with MOPITT (right).
CO2 and O2 columns are close to their expected value of about 8×10²¹molecules/cm2and 4.5×1024molecules/cm2, respectively, for a cloud-free scene with a surface elevation close to sea level. Despite (up)scaling of the XCO2 it is shown in Dils et al. (2006) that version 0.4 XCO2is still a few percent too low compared to FTIR. Because WFMDv0.4 XCO2 is scaled we focused in Buchwitz et al. (2005a) and Buchwitz et al. (2005b) on spatial and temporal XCO2 vari-ability and not on absolute values when comparing the SCIA-MACHY XCO2 with reference data, e.g., by comparing XCO2anomalies.
Here we present first results of WFM-DOAS applied to SCIAMACHY Lv1v5 spectra which have an improved cali-bration compared to the previous Lv1v4 spectra from which the initial v0.4 XCO2year 2003 data set has been retrieved (for details concerning the calibration concept see Lichten-berg et al. (2005)). We will show that significantly improved CO2spectral fits are obtained and that the CO2columns re-trieved from Lv1v5 spectra are higher by about 20%. This eliminates the need for a (large) CO2scaling factor.
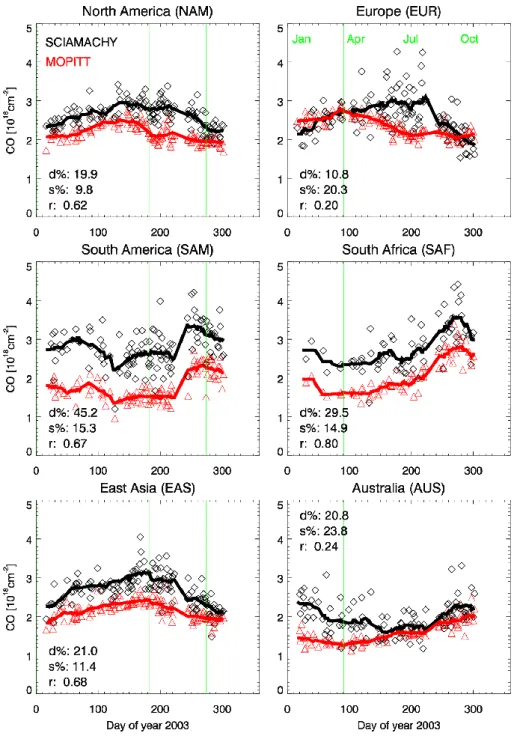
Fig. 5. Regions selected for a comparison of the SCIAMACHY and MOPITT CO columns: North America (NAM), Europe (EUR), Eastern
Asia (EAS), South America (SAM), South Africa (SAF), and Australia (AUS).
4 Trace gas results
We have processed all available SCIAMACHY Lv1v4 spec-tra of the year 2003 by WFM-DOAS (details concerning the processed orbits are given in Buchwitz et al., 2005b). The WFM-DOAS version 0.5 year 2003 data set will be discussed in the following for CO (Sect. 4.1) and XCH4(Sect. 4.2). For XCO2 we have additionally processed all available Lv1v5 spectra of the years 2003 to 2005 covering the area around Park Falls, Wisconsin, USA. These data will be presented in Sect. 4.3.
4.1 Carbon monoxide (CO)
To assess the quality of the new SCIAMACHY/WFM-DOAS version 0.5 CO column data product we have compared it with operational version 3 CO columns from MOPITT/EOS-Terra (Deeter et al., 2003). Figure 3 shows a comparison of year 2003 averages of both independent data sets. Fig-ure 3 has been obtained by directly averaging the CO col-umn data products of both sensors without considering dif-ferences in spatial and temporal sampling, horizontal res-olution, and altitude sensitivity (a comparison of spatially co-located measurements is given below). The comparison is restricted to measurements over land because of the re-duced quality of the SCIAMACHY near-infrared/nadir mea-surements over oceans caused by the low albedo of water in the near-infrared which results in low signals and low signal-to-noise ratios. Overall, both data sets agree reason-ably well but there are also significant differences. On av-erage, the SCIAMACHY data are higher compared to MO-PITT by 0.20×10¹⁸molecules/cm2 (10.5%) but regionally the differences can be much larger (up to 80%), e.g. over South America. The standard deviation of the difference is 0.48×10¹⁸molecules/cm2(27.9%).
Figure 4 enables a comparison between the two data sets for bi-monthly averages including the SCIAMACHY mea-surements over water. Especially over water the differences to MOPITT are large (see above). The time dependence of CO over central and south Africa and South America
mainly originating from biomass burning (see e.g. van der Werf et al., 2004) is qualitatively in good agreement show-ing maximum values north of the equator in Africa in Jan-uary/February and south of the equator in Africa and South America in September/October. The inter-hemispheric dif-ference is clearly visible in the SCIAMACHY data. A com-parison with MOPITT based on monthly means (not shown here) using the measurements over land and water shows that the inter-hemispheric CO difference as measured by both sensors is in good agreement (mean difference within 3%, correlation coefficient r=0.9).
For a more quantitative assessment we have performed a detailed comparison for six regions which are shown in Fig. 5. Figure 6 shows daily averages of co-located SCIA-MACHY and MOPITT CO columns for each region. Typi-cally the SCIAMACHY columns are higher than MOPITT. For the northern hemispheric regions the average difference is in the range 10% (Europe) to 20% (north America, east-ern Asia). Larger differences are found over southeast-ern Africa (30%) and South America (45%). The time dependence of CO over both regions is however in good agreement (the cor-relation of the daily averages is 0.67 and 0.8) but there ap-pears to be a constant offset relative to MOPITT of nearly 1.0×10¹⁸molecules/cm2.
Figure 7 shows a similar comparison as presented in Fig. 6 but restricted to cloud free SCIAMACHY pixels. Because the cloud contaminated pixels have been removed from the comparison Fig. 7 contains significantly less data (less days) for comparison. Nevertheless, the comparison with MOPITT gives nearly identical results as Fig. 6 where the cloud con-taminated pixels were included. From this one may conclude that the difference between SCIAMACHY and MOPITT is not due to clouds or the way the CO is corrected for partial cloud cover using the simultaneously measured methane.
According to Figs. 6 and 7 the SCIAMACHY WFM-DOAS version 0.5 CO is typically higher compared to MOPITT. Dils et al. (2006) have performed a comparison of FTIR columnar CO at 11 ground stations with WFM-DOAS version 0.5 CO, SCIAMACHY CO retrieved using
M. Buchwitz et al.: SCIAMACHY/WFM–DOAS CO, CH4, and CO2columns 2735
Fig. 6. Comparison of the SCIAMACHY (black) and MOPITT (red) CO columns for the six regions shown in Fig. 5. For the comparison
both the daily SCIAMACHY and MOPITT columns have been gridded on a 0.5◦×0.5◦latitude/longitude grid. The symbols show the daily average of all coincident grid points. For SCIAMACHY all measurement have been averaged for which the WFM-DOAS v0.5 quality flag indicates a (potentially) successful measurement. The solid lines represent a 30 days running average. For each region the following numbers have been computed based on the (not smoothed) daily averages: d% is the mean difference SCIA–MOPITT in percent, s% denotes the standard deviation of the difference in percent, and r is the correlation coefficient.
the SRON IMLM algorithm and the University of Heidelberg IMAP-DOAS algorithm, and MOPITT. This comparison shows that depending on the location of the ground station and the time of the year SCIAMACHY WFM-DOAS version 0.5 CO may be somewhat higher or lower compared to FTIR
or MOPITT. They compared more than 20 000 WFM-DOAS version 0.5 CO column measurements co-located with FTIR and found an average deviation below 1% with a standard de-viation of 25% relative to FTIR (more precisely relative to a polynomial fit through the FTIR data) and a correlation
coef-Fig. 7. As coef-Fig. 6 but only for SCIAMACHY cloud free pixels.
ficient of 0.86 for monthly mean values. For northern hemi-spheric stations they found that the SCIAMACHY/WFM-DOAS CO columns are typically lower compared to FTIR by up to –8.3% (for Ny Alesund, Spitsbergen). For the southern hemispheric stations (Wollongong, Lauder, Arrival Heights) they found typically an overestimation up to 22.6% (for Lauder). Unfortunately, none of the stations is located in the major CO source regions of South America and cen-tral/southern Africa. It is also shown in Dils et al. (2006) that significant differences exist between the three independent
algorithms that have been used to retrieve CO from SCIA-MACHY.
What could be the reason for the differences between SCIAMACHY and MOPITT especially over Amazonia (SAM region) where the differences are largest? One rea-son might be the different vertical weighting of both sen-sors with SCIAMACHY having higher sensitivity for bound-ary layer CO. In order to address this issue it is impor-tant to also use model simulations and additional measure-ments (e.g., in-situ CO measuremeasure-ments). We have not yet
M. Buchwitz et al.: SCIAMACHY/WFM–DOAS CO, CH4, and CO2columns 2737
Fig. 8. Difference of CO columns of SCIAMACHY and MOPITT as a function of top-of-atmosphere (TOA) albedo at 2325 nm as measured
by SCIAMACHY. The top panel shows the absolute difference of the CO columns, the bottom panel shows the percentage difference. The comparison is based on daily gridded data using only cloud free SCIAMACHY measurements over land with good quality as indicated by the WFM-DOAS CO product quality flag. The black crosses correspond to all measurements, the red crosses to the subset located in the SAM region (South America). The blue lines show the linear fit of the difference (of all measurements) as a function of TOA albedo. R is the correlation coefficient and a0 (y-axis intersection for x=0) and a1 (slope) are the two parameters of the linear fit.
performed a comparison with model simulations. de Laat et al. (2006) discuss a comparison of regionally averaged monthly mean CO columns retrieved from SCIAMACHY using the SRON IMLM algorithm in comparison with model simulations for the time period September 2003 to August 2004 (interestingly de Laat et al. (2006) note that they
se-lected this time period because of insufficient quality of the spectra prior to September 2003, i.e., for large parts of the time period analyzed in this paper). For several regions they found good agreement with the model simulations. For South America however (roughly corresponding to the SAM region shown in Fig. 6) they found large disagreement
be-Fig. 9. Year 2003 SCIAMACHY/WFM-DOAS version 0.5 CO over China including seasonal variation (right). All CO measurements over
land are shown for which the WFM-DOAS quality flag indicates a successful measurement.
tween SCIAMACHY/IMLM CO and the model simulations (large scatter of the SCIAMACHY measurements of up to or even much larger than 50%). For southern Africa (i.e., south of / southern part of SAF region shown in Fig. 6) the SCIAMACHY/IMLM CO shows also large differences (about 50% higher values of SCIAMACHY compared to the model for October 2003 and systematically higher values of SCIAMACHY (about 30–50%) for February to July 2004). They conclude that differences of the monthly means are typ-ically below 13% except for regions with large instrument-noise errors (i.e., low albedo regions and/or regions with only a few data points due to, e.g., persistent cloud cover) such as their South America region.
Figure 4 shows that the SCIAMACHY WFM-DOAS version 0.5 CO over the oceans especially in the trop-ics/subtropics is higher than MOPITT suggesting a high bias of SCIAMACHY potentially related to the low albedo of water around 2.3 both random and systematicµm (∼1%). Therefore, it could be that also the SCIAMACHY CO mea-surements over land (e.g., SAM and SAF regions shown in Fig. 6) are to a certain extent biased high due to the rel-atively low surface albedo of vegetation of about 0.1 (see e.g., ASTER Spectral Library, http://speclib.jpl.nans.gov). If there is an albedo dependent bias of the SCIAMACHY CO measurements over these land regions then the bias will be significantly lower than the possible bias over water be-cause of the much higher albedo of vegetation compared to the extremely low albedo of water. In order to investigate this we have computed top of atmosphere (TOA) albedos (at 2325 nm) from a number of days of cloud free SCIAMACHY
measurements in June and October 2003. The TOA albedo is defined as Rπ/I / cos(SZA), where R is the nadir radi-ance, I is the solar irradiance and SZA is the solar zenith angle. Because 2325 nm is a relatively transparent wave-length for cloud free measurements, the TOA albedo is a good proxy of the surface albedo. Figure 8 shows the differ-ence between SCIAMACHY and MOPITT CO as a function of SCIAMACHY measured TOA albedo. As can be seen, there is a slight dependence of the difference on albedo with SCIAMACHY CO on average biased high for low albedos. There is however large scatter (larger than the bias) and the correlation is low (less than 0.3). Figure 8 suggests that on average there appears to be a high bias of SCIAMACHY CO for low albedo scenes (albedo less than about 0.1) of up to about 20% or 0.8×10¹⁸molecules/cm2.
Finally we present some regional results focusing on China. Air pollution resulting from large-scale fossil fuel combustion and fossil fuel related activities has become a problem with increasing importance, especially for countries with an increasing energy demand and inherent fuel con-sumption such as China. The quantification of concentrations near the sources and the subsequent transport of pollutants is important, for example, for monitoring and forecasting of air pollution. The left panel of Fig. 9 shows yearly averaged ver-tical columns of CO over China. Clearly visible are large gions of elevated CO (shown in red) indicating CO source re-gions. Elevated CO is present over a large area south of Bei-jing, in the Red Basin around Chengdu/Chongqing, around Shenyang, and over Hainan Dao and Zhanjiang. The elevated CO detected with SCIAMACHY clearly correlates with
ma-M. Buchwitz et al.: SCIAMACHY/WFM–DOAS CO, CH4, and CO2columns 2739
Fig. 10. Comparison of SCIAMACHY CO over China with CO from MOPITT. Top left panel: As Fig. 9 but generated by averaging
only those SCIAMACHY measurements where also a coincident MOPITT measurements exists. Top right panel: Year 2003 average of all MOPITT measurements where also a coincident SCIAMACHY measurements exists. Bottom left panel: Relative difference between SCIAMACHY and MOPITT (SCIAMACHY – MOPITT, i.e., positive values indicate higher values of SCIAMACHY). Bottom right panel: Absolute difference between SCIAMACHY and MOPITT (SCIAMACHY – MOPITT).
jor cities, for example Chongqing and surroundings where more than 30 million people are living. The three panels on the right hand side of Fig. 9 show tri-monthly averaged CO columns. The largest CO columns are observed in the May to July 2003 average over large parts of eastern China and around Chongqing/Chengdu. High columns are also ob-served over these regions during other times of the year, es-pecially around Beijing during February to April.
As SCIAMACHY’s near-infrared measurements have higher sensitivity to boundary layer CO compared to the CO retrieved from the thermal infrared measurements of MO-PITT one would expect that the differences to MOMO-PITT are largest near surface source areas of CO. Figure 10 shows a comparison of the CO columns retrieved from both sen-sors over the same area also shown in Fig. 9. For the com-parison the daily data of both sensors have been gridded and only those grid boxes have been used for the compari-son where measurements exist for both sensors (“coincident measurements”). Figure 10 shows yearly averages of the co-incident CO columns of both sensors as well as the relative and the absolute difference. The differences are relatively
small (less than about 0.4×10¹⁸molecules/cm2) outside ma-jor source regions (e.g., Himalaya, large parts of northern China) but significantly larger over major source regions (e.g., around Beijing, Wuhan, Fuzhou, Zhanjian, around Lake Baikal (north-east of Irkutusk), the Ganges plain (e.g., around New Delhi), along the Brahmaputra river, and over large parts of south-east Asia (e.g., parts of Burma, Thailand, and southern Vietnam around Ho Chi Minh City)). Qual-itatively the higher values of SCIAMACHY observed over surface source regions of CO compared to MOPITT are con-sistent with what one would expect from a sensor with higher sensitivity for boundary layer CO.
4.2 Methane (CH4)
Figure 11 shows a comparison of the new SCIAMACHY/WFM-DOAS version 0.5 XCH4 data product derived from channel 6 with independent TM5 model simulations performed at the EC Joint Research Centre (JRC), Ispra, Italy (Bergamaschi et al., 2000, 2005a). The TM5 model is a two-way nested atmospheric zoom
Fig. 11. Comparison of bi-monthly year 2003 averages of SCIAMACHY/WFM-DOAS version 0.5 methane (left) with TM5 model
simula-tions (right).
model (Krol et al., 2005). It allows to define zoom regions (e.g. over Europe) which are run at higher spatial resolution (1×1 degrees), embedded into the global domain, run at a resolution of 6×4 degrees. We employ the tropospheric standard version of TM5 with 25 vertical layers. TM5 is an off-line model and uses analyzed meteorological fields from the ECMWF weather forecast model to describe advection and vertical mixing by cumulus convection and turbulent diffusion. Methane (a priori) emissions are as described by Bergamaschi et al. (2005a) and shortly summarized here: Anthropogenic emissions of domestic ruminants, fossil fuel production, waste treatment, biofuel, and minor sources are based on EDGAR 3.2 for year 1995 (Olivier and Berdowski, 2001), emissions from rice paddies are from Matthews et al. (1991) and biomass burning emissions from Houweling et al. (1999); natural emissions from wetlands are from Walter et al. (2001); emissions from wild animals and termites, as well as CH4 uptake by soils are from the GISS data base (Fung et al., 1991), and emissions from the ocean are from Houweling et al. (1999). Chemical destruction of CH4 by OH radicals is simulated using pre-calculated OH fields based on CBM-4 chemistry and optimized with methyl chlo-roform. For the stratosphere also the reaction of CH4 with Cl and O(1D) radicals are considered. The TM5 simulations are currently being refined, e.g. by implementing a multiple zoom mode (Bergamaschi et al., 2005b) and optimization versus highly accurate surface measurements Bergamaschi
et al. (2006)1.
For this study we used the same TM5 data set as used for comparison with our previous methane v0.4x products (Buchwitz et al., 2005b).
Figure 11 shows a comparison of bi-monthly averages. The SCIAMACHY measurements are somewhat lower than TM5 XCH4, especially at high latitudes. For the tropical re-gion Fig. 11 is consistent with the findings of Frankenberg et al. (2005c) who also analyzed differences of SCIAMACHY data and model simulations (but for the time period August to November 2003) and found significantly higher methane values compared to model simulations over large parts of the tropics suggesting significantly greater tropical emissions than currently in the emission inventories. What exactly causes these high methane values still needs to be assessed (see, e.g., Bergamaschi et al., 20061) but it has to be pointed out that the magnitude of the large tropical methane source is consistent with the recent discovery of methane emis-sions from plants (Keppler et al., 2006), with large emisemis-sions mainly in the tropical region. Frankenberg et al. (2005c) used a different retrieval algorithm (IMAP-DOAS) and compared
1Bergamaschi, P., Frankenberg, C., Meirink, J. F., Krol, M., Dentener, F., Wagner, T., Platt, U., Kaplan, J. O., K¨orner, S., Heimann, M., Dlugokencky, E. J., and Goede, A.: Satellite chartog-raphy of atmospheric methane from SCIAMACHY onboard EN-VISAT: (II) Evaluation based on inverse model simulations, J. Geo-phys. Res., submitted, 2006.
M. Buchwitz et al.: SCIAMACHY/WFM–DOAS CO, CH4, and CO2columns 2741
Fig. 12. Comparison of SCIAMACHY methane with TM5 model simulations for 1 July 2003. The top panel shows WFM-DOAS v0.5
methane (black symbols) for all ground pixels, including measurements over water. The corresponding TM5 model values are shown in blue. The WFM-DOAS v0.5 methane is based on SCIAMACHY Lv1v4 spectra. As can be seen, the SCIAMACHY v0.5 methane differs from the TM5 model simulations especially at high latitudes where the solar zenith angle is large. The red points show (preliminary) SCIAMACHY methane retrieved from Lv1v5 spectra which does not show low values at high latitudes. The bottom panel shows the ratio the SCIAMACHY methane derived from version 4 and 5 spectra as a function of the cosine of the solar zenith angle. BIAS is the solar zenith angle dependent bias of the SCIAMACHY v0.5 methane obtained from a comparison with ground based FTIR measurements at various stations as a function of time during 2003 (Dils et al., 2006). The slope of the red BIAS line is in good agreement with the linear fit of the ratio of the methane column versus cosine of solar zenith angle (blue line) indicating that the v0.5 methane bias is due to a calibration problem of the Lv1v4 spectra which has been solved for Lv1v5.
with a different model (TM3 model of KNMI). Figure 11 confirms these important findings and shows that they nei-ther depend on the details of the retrieval method nor on the model used for comparison (the TM3/KNMI model used by Frankenberg et al. (2005c) is however very similar to the TM5/JRC model used here).
Figure 11 shows that especially at high latitudes the ob-served XCH4 is significantly lower than the model XCH4. When comparing time series of the SCIAMACHY
mea-surements with the ground based FTIR meamea-surements at several stations (Dils et al., 2006) it has been found that the difference to FTIR is clearly correlated with the so-lar zenith angle (SZA) at the time of the measurement. We found that the SZA dependent bias is approximately given by BIAS=0.9+0.15cos(SZA), i.e., dividing the re-trieved methane columns by BIAS provides a good first or-der correction. Figure 12 shows a comparison of one day of SCIAMACHY methane measurements compared to TM5.
Fig. 13. Comparison of SCIAMACHY/WFM-DOAS version 0.5 methane (top) with TM5 model simulations (bottom) for the year 2003.
The SCIAMACHY map has been generated by averaging all measurements for which the WFM-DOAS quality flag indicates a successful measurement. The SCIAMACHY measurements are SZA bias corrected and scaled with 1.02.
For this day methane has been retrieved from two different versions of the SCIAMACHY spectra, namely Lv1v4 which has been used to generate the year 2003 data set discussed here, and Lv1v5 with improved calibration (e.g., much bet-ter dark signal calibration). Figure 12 shows that the solar zenith angle dependent bias is due to a calibration problem of the Lv1v4 spectra that has been solved for Lv1v5. We have not yet reprocessed all data using the improved calibration. The WFMDv0.5 methane data set we present here has been derived from Lv1v4 spectra. We use the SZA bias correc-tion as described above. This data set is the one that has been
compared with ground based FTIR measurements (Dils et al., 2006) with and without SZA bias correction and also with two other SCIAMACHY methane data products from two other groups retrieved using somewhat different approaches (Frankenberg et al., 2005c; Gloudemans et al., 2005). For the comparison between SCIAMACHY and TM5 shown in this paper the SCIAMACHY averaging kernels (which are close to but not exactly equal to 1.0) have not been consid-ered and the SCIAMACHY methane is not corrected for CO2 variability using, e.g., model simulations.
M. Buchwitz et al.: SCIAMACHY/WFM–DOAS CO, CH4, and CO2columns 2743
Fig. 14. Comparison of SCIAMACHY WFM-DOAS v0.5 methane with TM5 model simulations. The top panel shows the difference
SCIA–TM5 (in ppbv) of the daily data during 2003. The black symbols correspond to the SZA corrected SCIAMACHY data and the blue symbols to the uncorrected data. The middle panel shows the standard deviation of the difference, and the bottom panel the linear correlation coefficient. The correlation is lower during the mid of the year not because of a change of the quality of the retrieval but due to the reduced number of measurements in the southern hemisphere (large solar zenith angles / polar night in Antarctica).
Figure 13 shows a comparison of SZA bias corrected SCIAMACHY methane with TM5. The SCIAMACHY methane has been scaled with 1.02 to enable a comparison with TM5 on the same ppbv scale. The approximately 2% low bias of version 0.5 methane (prior to scaling with 1.02) is consistent with the findings of the FTIR comparison (Dils et al., 2006).
Figure 14 shows a quantitative comparison of SCIA-MACHY methane with TM5. It is shown that the SZA bias correction results in typically much better agreement with TM5 compared to the uncorrected methane. The standard de-viation of the difference of the daily data is typically 50 ppbv (∼3%) for the SZA bias corrected data.
Higher values of methane in the tropics compared to the model simulations are clearly visible in the uncorrected
Fig. 15. Comparison of SCIAMACHY/WFM-DOAS version 0.5 XCH4(left) with TM5 model simulations (right) for four regions using the TM5 high resolution zoom mode over Europe and low resolution mode outside Europe. The ppbv scale has been selected differently for each figure to better highlight the regional methane spatial pattern. The block-like pattern of the TM5 methane (e.g. over the US) reflects the TM5 model resolution for the TM5 low resolution mode. For each SCIAMACHY overpass there are typically several SCIAMACHY measurements within a given TM5 grid box because the SCIAMACHY resolution is higher compared to TM5 in low resolution mode. The TM5 data have been directly sampled without spatial interpolation yielding for each overpass a single TM5 value for all SCIAMACHY measurements in a given TM5 grid box. The SCIAMACHY data are SZA bias corrected and scaled with 1.02.
measurements (Fig. 11) and in the corrected measurements (Fig. 13). The SZA bias (and its correction) is small in the tropics as the solar zenith angle is relatively low and does not vary very much over the year. Both figures indicate (in agree-ment with Frankenberg et al. (2005c)) that a methane source is missing (or a known source is underestimated) in the
trop-ics. The results shown here give no indications that the miss-ing methane source can be attributed to a (solar zenith angle dependent) measurement error. In order to determine the pre-cise size of the missing methane source, however, even small measurement errors matter. We think that for such an appli-cation the SZA bias correction used here is probably not
ac-M. Buchwitz et al.: SCIAMACHY/WFM–DOAS CO, CH4, and CO2columns 2745
Fig. 16. Comparison of SCIAMACHY/WFM-DOAS version 0.5 XCH4(top) with TM5 model simulations (bottom) over India and China. The SCIAMACHY data are SZA bias corrected and scaled with 1.02.
curate enough and that reprocessing using version 5 spectra is needed for this application (this is currently under prepa-ration).
Figure 15 shows detailed results for four regions, namely Europe, northern America, southern America, and south-east Asia, including a comparison with TM5. In TM5 regionally elevated methane columns (shown in red) are due to methane emissions from various sources such as fossil fuel related ac-tivities, wetlands, waste handling, ruminants, and rice culti-vation. The good qualitative agreement of the SCIAMACHY methane measurements with TM5 shows that SCIAMACHY can clearly detect major source regions of methane for the various regions. The comparison with TM5 XCH4shows in general good agreement but there are also significant regional differences which are, at least partially, due to shortcom-ings of current methane emission data bases Bergamaschi et al. (2006)1. A similar comparison with TM5 as shown here for SCIAMACHY methane derived using WFM-DOAS is shown in Frankenberg et al. (2006) for methane retrieved using the University of Heidelberg IMAP-DOAS algorithm. Qualitatively the methane products derived using the two dif-ferent algorithms are in good agreement, quantitatively how-ever there are differences, e.g., due to different versions of the SCIAMACHY spectra and due to differences of the re-trieval algorithms. Frankenberg et al. (2006) have
investi-gated the error due to normalization the methane column by the simultaneously retrieved CO2column used to convert the methane column into a column averaged mixing ratio. Using model simulations they found that the variations in the CO2 column abundances are far smaller than those in methane. Nevertheless, some error remains (especially at higher north-ern latitudes) and they therefore correct the retrieved methane mixing ratios using CO2columns obtained from model simu-lations whereas in this paper the CO2mixing ratio is assumed constant. For our future methane data product we will also consider an improved CO2correction using, e.g., a first order correction of the CO2seasonal cycle.
India and China emit significant amounts of methane, e.g., due rice cultivation, ruminants, and wetlands. Fig-ure 16 shows a comparison of tri-monthly averages of SCIA-MACHY methane over India and China with TM5. Shown in Fig. 16 are only those measurements for which the quality flag determined by the retrieval algorithm indicates a (po-tentially) successful measurement. Using this approach the measurements over the Himalaya region are filtered out (the WFM-DOAS reference spectra are only strictly valid for the altitude range 0–3 km; note that for CO the quality criteria are less strict compared to methane - therefore the Himalaya region is shown in Fig. 9). Clearly visible are large regions of elevated methane (shown in red). During August to
Octo-Fig. 17. Elevated methane as observed by SCIAMACHY/WFM-DOAS version 0.5 XCH4near Urumqi (or Urumtschi, indicated by a black cross) in north-west China. The year 2003 average is shown in the top-left panel. The three other panels show tri-monthly averaged methane. The SCIAMACHY data are SZA bias corrected and scaled with 1.02.
ber the methane concentrations are significantly higher com-pared to May to July in qualitative agreement with the model simulations. In China elevated concentrations are present in the Red Basin around Chongqing/Chengdu (see annotation of Fig. 9, left panel) even during May to July. Apart from the Red Basin Fig. 9 shows regionally elevated methane as measured by SCIAMACHY over several other areas, for ex-ample in north-west China. Figure 17 shows that methane is persistently elevated near the city of Urumqi. Urumqi lies in a region with many coal fields and coal field fires (see, e.g. http://www.coalfire.caf.dlr.de). Figure 17 suggests that sig-nificant amounts of methane are emitted in this region and accumulate in the valley located to the north-west of Urumqi (Liu Huang Gou, “Sulphur Valley”).
4.3 Carbon dioxide (CO2)
Global maps and time series of the SCIAMACHY/WFM-DOAS version 0.4 XCO2data product have been presented in Buchwitz et al. (2005b) including a comparison with global model simulations using TM3 (Heimann and K¨orner, 2003). Comparison with TM3 showed reasonable agree-ment especially after temporal and spatial averaging of the SCIAMACHY data. We found however also significant
dif-ferences, most notably that the measured XCO2variability is typically larger compared to the model by about a fac-tor of 2–5. Recently Dils et al. (2006) have compared v0.4 XCO2 with ground based FTIR measurements at three sta-tions. They found a low bias of about 7% of SCIAMACHY XCO2relative to FTIR, a standard deviation of the difference of 3–4% and a quite low correlation of about r= 0.4. Apart from the systematic low bias it was however not possible to draw other strong conclusions from this comparison because none of the three stations (Jungfraujoch in Switzerland, Ny Alesund in Spitsbergen, and Egbert in Canada near Toronto) is ideal for a comparison with SCIAMACHY tropospheric CO2: Jungfraujoch is a high altitude station not sensitive to boundary layer CO2, Ny Alesund is a high latitude station (no CO2measurements during polar night and difficult mea-surement conditions for SCIAMACHY because of low signal due to large solar zenith angles and low snow/ice albedo in the near-infrared), and Egbert CO2shows significant scatter due to strong influence of local sources.
The main problem of the v0.4 XCO2data product is that the CO2 columns measured by SCIAMACHY had to be scaled with 1.27 to compensate for a systematic underesti-mation of the CO2columns. The (scaled) v0.4 XCO2 year 2003 data set has been retrieved from Lv1v4 spectra. The
M. Buchwitz et al.: SCIAMACHY/WFM–DOAS CO, CH4, and CO2columns 2747
Fig. 18. Typical WFM-DOAS v0.4 CO2spectral fits for measurements over Park Falls, Wisconsin, USA (left) and Bremen, Germany (right). The top panels show the measured sun-normalized radiance as symbols (grey for Level 1 version 4 spectra and black for version 5 spectra). The solid lines correspond to the WFM-DOAS model after the fit. The retrieved (unscaled) CO2columns are given in the annotation. As can be seen, the CO2derived from the version 5 spectra compared to version 4 spectra are about 19% higher over Park Falls (column ratio: 7.0/5.9) and about 22% higher over Bremen (column ratio: 7.3/6.0). The CO2fit error improves by about a factor of four. The bottom panels show the fit residuals, i.e., the difference between measurement and WFM-DOAS model after the fit. The root-mean-square (RMS) of the fit residuals (see annotation) is about 0.2% for the Level 1 v5 spectra and about three times worse for Level 1 v4 spectra.
latest version of the spectra is Lv1v5 which has a signifi-cantly improved calibration compared to Lv1v4. Especially the quality of the near-infrared channel was very prelimi-nary for Lv1v4. In order to use Lv1v4 near-infrared spec-tra it was necessary to improve the calibration by replac-ing (“patchreplac-ing”) the dark signals in the binary Level 1 data files by improved ones (Buchwitz et al., 2005a,b). For the Lv1v5 spectra we found that the quality of the calibration is good enough so that the nominal calibration can be used. The results shown here for Lv1v5 have been obtained using the nominal calibration (activating all calibration steps ex-cept polarization correction).
Figure 18 shows a typical comparison of WFM-DOAS CO2 spectral fits using (dark signal patched) Lv1v4 and (nominally calibrated) Lv1v5 spectra. As can be seen, the CO2 columns retrieved from Lv1v5 spectra are higher by about 20% compared to the unscaled CO2columns retrieved from Lv1v4 spectra. Figure 18 also shows that the quality of the spectral fit is about a factor of three better for Lv1v5. As a consequence, the CO2fit error is improved by typically a factor 3–4: for Lv1v5 it is typically less than 2% instead of being larger than 6% for Lv1v4.
The entire year 2003 data set has not yet been repro-cessed using the improved spectra because for our next ver-sion CO2product we plan to implement a number of algo-rithm changes to further improve the quality of the retrieved CO2 (e.g., reduction of albedo sensitivity, update of spec-troscopic parameters). We have however processed all avail-able year 2003–2005 orbits over Park Falls, Wisconsin, USA. Park Falls is one of the few sites where ground based XCO2 FTIR measurements are being performed. The Park Falls FTIR is part of the new Total Carbon Column Observing Network (TCCON) currently built up especially for the val-idation of satellite CO2measurements (Washenfelder et al., 2005). Figure 19 shows monthly averaged year 2003–2005 XCO2 over Park Falls as measured by SCIAMACHY. For 2003 the (scaled) v0.4 XCO2 data product retrieved from Lv1v4 spectra (“old CO2”) is compared to unscaled XCO2 retrieved using the same algorithm applied to Lv1v5 spec-tra (“new CO2”). In contrast to our version 0.5 CO and methane data products we have not yet implemented an au-tomatic computation of a standard quality flag for the XCO2 data product. For the computation of the monthly means we have used only cloud free measurements over land for which
Fig. 19. Monthly mean dry air column averaged CO2mixing ratios as measured by SCIAMACHY over Park Falls, Wisconsin, USA. The left panel shows in red the WFM-DOAS version 0.4 XCO2data product for 2003 (which is scaled) retrieved from Lv1v4 spectra. The monthly mean values are shown as symbols, the standard deviations of the individual measurements for a given month as vertical lines. The thickness of the connecting line corresponds to the standard deviation (shown as vertical red lines) divided by the square root of the number of measurements used to compute the monthly means. In black the XCO2derived from Lv1v5 spectra is shown which has been generated without scaling the CO2columns. The right panel shows the measurements for 2004 (blue) and 2005 (black) retrieved from Lv1v5 (CO2not scaled).
the root-mean-square (RMS) of the CO2fit residuum is better than 0.3% for the new CO2and better than 0.8% for the old CO2 reflecting the differences in the quality of the spectral fits using the old and the new calibration. In addition, only pixels have been selected whose center coordinates have a distance of less than 350 km from Park Falls. For both data sets not all orbits are currently available and due to instru-ment decontamination time periods there are additional large data gaps (especially in August 2003). Therefore, we were not (yet) able to compute a monthly mean value for August 2003. As can be seen, the new unscaled CO2is on average a few percent lower compared to the scaled old CO2(the un-scaled old CO2would be around 285 ppmv) but the time de-pendence is similar although not identical, especially in June 2003. From this one can conclude that the preliminary new CO2still has a low bias of a few percent. For the years 2004 and 2005 the new XCO2is similar during spring and autumn, but different during July and August where CO2is lower in 2004 compared to 2005.
A detailed comparison with the Park Falls FTIR measure-ments will be performed after official release of the FTIR data and after the WFM-DOAS algorithm improvements as indicated above have been implemented. Currently only a first preliminary comparison is possible. A comparison of Fig. 19 with preliminary FTIR measurements as presented in Washenfelder et al. (2005) shows reasonable agreement with respect to the time dependence and the amplitude of
the CO2 over Park Falls. For 2005 the XCO2 difference between April and August as measured by SCIAMACHY is about 13 ppmv (=366–353) and about 9 ppmv for FTIR (=382–373). The SCIAMACHY averaging kernels for CO2 are about 1.5 near the surface and about 1.0 around 5 km (500 hPa) (Buchwitz et al., 2005a). From this one can con-clude that SCIAMACHY would overestimate CO2 variabil-ity by about 25% (e.g., 11.25 ppmv instead of 9 ppmv) if the variability is mainly confined to the lowest few kilometers of the atmosphere (this is a value that has also been found by ap-plying SCIAMACHY averaging kernels to TM3 model sim-ulations). For a quantitative comparison of the CO2the aver-aging kernels of both instruments need to be considered. The FTIR CO2averaging kernels are typically closer to 1.0 in the lower troposphere (within about 0.8–1.2, depending on alti-tude, solar zenith angle, etc.; see B¨osch et al., 2006) than the WFM-DOAS v0.4 CO2averaging kernels but they also dif-fer from 1.0. For 2004 SCIAMACHY observes significantly lower CO2around July/August compared to 2005 in qualita-tive agreement with the FTIR measurements. SCIAMACHY however appears to overestimate the spring/summer CO2 dif-ference.
5 Conclusions
We have presented an improved algorithm (WFM-DOAS version 0.5) for the retrieval of vertical columns of carbon
M. Buchwitz et al.: SCIAMACHY/WFM–DOAS CO, CH4, and CO2columns 2749
monoxide (CO) and dry-air column averaged mixing ratios of methane (XCH4) from the spectral near-infrared nadir observations of the SCIAMACHY instrument onboard the European environmental satellite ENVISAT. A comparison with global reference data (MOPITT satellite data for CO and TM5 model simulations for XCH4) shows that the CO and methane v0.5 data products are significantly improved compared to earlier versions (0.4, 0.41). The results of the comparison with the global reference data are broadly con-sistent with the comparison of ground based FTIR measure-ments at 11 ground stations (Dils et al., 2006). For CO we found reasonable agreement with MOPITT with SCIA-MACHY CO being typically higher compared to MOPITT. The SCIAMACHY – MOPITT comparison has been con-ducted by directly comparing the CO vertical column data products of both sensor not taking into account the differ-ent averaging kernels which indicate much higher sensitiv-ity to the lower troposphere for SCIAMACHY compared to MOPITT which has his sensitivity maximum in the middle and upper troposphere. For methane we have found that the data product can be further improved using Level 1 version 5 (Lv1v5) spectra which have an improved calibration com-pared to Lv1v4 spectra used to generate the WFM-DOAS version 0.5 year 2003 methane data set presented here. De-spite future improvements we have shown that the quality of the current data set is high enough to detect major source regions of methane (e.g., eastern US, large parts of Europe and Russia, South America, central Africa, India, China) and CO (e.g., eastern China, central and southern Africa, South America). For carbon dioxide we have presented first results obtained by applying the WFM-DOAS v0.4 retrieval algo-rithm to the improved Lv1v5 nadir spectra. Compared to earlier results obtained with Lv1v4 spectra we find a signif-icant improvement with respect to the quality of the spectral fits and the retrieved CO2columns. A first qualitative com-parison with preliminary FTIR measurements at Park Falls, Wisconsin, USA, indicates reasonable agreement. A detailed quantitative comparison will be performed after release of the FTIR data and after implementation of a number of fur-ther improvements of our WFM-DOAS retrieval algorithm. The results presented here demonstrate significant progress to reach our main goal which is the generation of data prod-ucts with a quality good enough to provide qualitative and as much as possible quantitative information on the surface sources and sinks of these major carbon gases using e.g. in-verse modeling.
Acknowledgements. We thank ESA and DLR for providing us with the SCIAMACHY Level 1 data and the SCIAMACHY calibration team (e.g., DLR, SRON, ESA, University of Bremen) for continuously improving the quality of the spectra. We thank the MOPITT teams at NCAR and University of Toronto for the MOPITT Level 2 Version 3 data which have been obtained via the NASA Langley DAAC. We also thank two anonymous referees for their constructive comments. Funding for this study came from the German Ministry for Research and Education
(BMBF) via DLR-Bonn (50EE0027, project SADOS), the Euro-pean Commission (5th FP, Energy, Environment and Sustainable Development, EVG1-CT-2002-00079, project EVERGREEN), from ESA (GMES/PROMOTE) and from the University and the State of Bremen. We acknowledge exchange of information within the European Commission Network of Excellence ACCENT. Edited by: T. R¨ockmann
References
Barkley, M. P., Frieß, U., and Monks, P. S.: Measuring atmospheric CO2 from space using Full Spectral Initiation (FSI) WFM-DOAS, Atmos. Chem. Phys. Discuss., 6, 2765–2807, 2006a. Barkley, M. P., Monks, P. S., Frieß, U., Mittermeier, R. L., Fast,
H., K¨orner, S., and Heimann, M.: Comparison between SCIA-MACHY atmospheric CO2 retrieved using (FSI) WFM-DOAS to ground based FTIR data and the TM3 chemistry transport model, Atmos. Chem. Phys. Discuss., 6, 5387–5425, 2006b. Bergamaschi, P., Krol, M., Dentener, F., Vermeulen, A., Meinhardt,
F., Graul, R., Peters, W., and Dlugokencky, E. J.: Inverse mod-elling of national and European CH4emissions using the atmo-spheric zoom model TM5, Atmos. Chem. Phys., 5, 2431–2460, http://www.direct.sref.org/1680-7324/acp/2005-5-2431, 2005a. Bergamaschi, P., Frankenberg, C., Meirink, J. F., Krol, M.,
Den-tenter, F., van Weele, M., Wagner, T., Platt, U., K¨orner, S., and Heimann, M.: CH4 total columns from SCIAMACHY – Comparison with atmospheric models (extended abstract: https: //www.icdc7.com/article41.html), Seventh International Carbon Dioxide Conference, Boulder, CO, USA, 25–30 September, 2005b.
Bergamaschi, P., Hein, R., Heimann, M., and Crutzen, P. J.: Inverse modeling of the global CO cycle, 1. Inversion of CO mixing ra-tios, J. Geophys. Res., 105, 1909–1927, 2000.
Bovensmann, H., Buchwitz, M., Frerick, J., Hoogeveen, R., Kleipool, Q., Lichtenberg, G., No¨el, S., Richter, A., Rozanov, A., Rozanov, V. V., Skupin, J., von Savigny, C., Wuttke, M., and Bur-rows, J. P.: SCIAMACHY on ENVISAT: In-flight optical perfor-mance and first results, in: Remote Sensing of Clouds and the At-mosphere VIII, edited by: Sch¨afer, K. P., Com`eron, A., Carleer, M. R., and Picard, R. H. (PDF file available from WFM-DOAS web site http://www.iup.physik.uni-bremen.de/sciamachy/NIR NADIR WFM DOAS/index.html), Proceedings of SPIE, 5235, 160–173, 2004.
Bovensmann, H., Burrows, J. P., Buchwitz, M., Frerick, J., No¨el, S., Rozanov, V. V., Chance, K. V., and Goede, A.: SCIAMACHY – Mission Objectives and Measurement Modes, J. Atmos. Sci., 56, 127–150, 1999.
B¨osch, H., Toon, G. C., Sen, B., Washenfelder, R. A., Wennberg, P. O., Buchwitz, M., de Beek, R., Burrows, J. P., Crisp, D., Christi, M., Connor, B. J., Natraj, V., and Yung, Y. L.: Space-based Near-infrared CO2Measurements: Testing the OCO Retrieval Algorithm and Validation Concept Using SCIAMACHY Obser-vations over Park Falls, Wisconsin, J. Geophys. Res., in press, 2006.
Buchwitz, M., de Beek, R., Burrows, J. P., Bovensmann, H., Warneke, T., Notholt, J., Meirink, J. F., Goede, A. P. H., Bergam-aschi, P., K¨orner, S., Heimann, M., and Schulz, A.: Atmospheric methane and carbon dioxide from SCIAMACHY satellite data: