HAL Id: hal-00300990
https://hal.archives-ouvertes.fr/hal-00300990
Submitted on 14 Feb 2005HAL is a multi-disciplinary open access
archive for the deposit and dissemination of sci-entific research documents, whether they are pub-lished or not. The documents may come from teaching and research institutions in France or abroad, or from public or private research centers.
L’archive ouverte pluridisciplinaire HAL, est destinée au dépôt et à la diffusion de documents scientifiques de niveau recherche, publiés ou non, émanant des établissements d’enseignement et de recherche français ou étrangers, des laboratoires publics ou privés.
Global satellite validation of SCIAMACHY O3 columns
with GOME WFDOAS
A. Bracher, M. Weber, K. Bramstedt, M. Coldewey-Egbers, L. N. Lamsal, J.
P. Burrows
To cite this version:
A. Bracher, M. Weber, K. Bramstedt, M. Coldewey-Egbers, L. N. Lamsal, et al.. Global satellite validation of SCIAMACHY O3 columns with GOME WFDOAS. Atmospheric Chemistry and Physics Discussions, European Geosciences Union, 2005, 5 (1), pp.795-813. �hal-00300990�
ACPD
5, 795–813, 2005
SCIAMACHY O3
columns with GOME WFDOAS A. Bracher et al. Title Page Abstract Introduction Conclusions References Tables Figures J I J I Back Close
Full Screen / Esc
Print Version Interactive Discussion
EGU
Atmos. Chem. Phys. Discuss., 5, 795–813, 2005 www.atmos-chem-phys.org/acpd/5/795/
SRef-ID: 1680-7375/acpd/2005-5-795 European Geosciences Union
Atmospheric Chemistry and Physics Discussions
Global satellite validation of SCIAMACHY
O
3
columns with GOME WFDOAS
A. Bracher, M. Weber, K. Bramstedt, M. Coldewey-Egbers, L. N. Lamsal, and J. P. Burrows
Institute of Environmental Physics and Remote Sensing (IUP/IFE), University of Bremen, Otto-Hahn-Allee 1, 28334 Bremen, Germany
Received: 20 December 2004 – Accepted: 7 February 2005 – Published: 14 February 2005 Correspondence to: A. Bracher (bracher@uni-bremen.de)
ACPD
5, 795–813, 2005
SCIAMACHY O3
columns with GOME WFDOAS A. Bracher et al. Title Page Abstract Introduction Conclusions References Tables Figures J I J I Back Close
Full Screen / Esc
Print Version Interactive Discussion
EGU Abstract
Global stratospheric ozone columns measured by SCIAMACHY (Scanning Imaging Spectrometer for Atmospheric Chartography; data versions 5.01 and 5.04) aboard the recently launched Environmental Satellite (ENVISAT) from January to June 2003 were compared to collocated total ozone data from GOME (Global Ozone Monitoring
Exper-5
iment on ERS-2) retrieved using the weighting function DOAS algorithm (WFDOAS; Version 1.0) in order to assess the level-2 data (trace gas data) retrieval accuracy from SCIAMACHY. The large number of collocated total ozone data from the two instru-ments which are flying in the same orbit were spatially binned into regular 2.5◦ and 2.5◦ grids and then compared. This binning method shows similar results than direct
10
comparisons but is about thousand times faster. Results of these satellite compar-isons show that SCIAMACHY O3vertical columns (version 5.01/5.04) are on average 1% (±2%) lower than GOME WFDOAS and scatter increases at solar zenith angles above 85◦and at low total ozone values. Results show dependencies on the seasonal cycle, latitudes, and total ozone amounts which are explained by the implementation of
15
an old GOME algorithm based on GOME Data Processor (GDP) version 2.4 algorithm for the SCIAMACHY operational product. A reprocessing with an algorithm equivalent to GOME GDP version 4.0 and/or GOME WFDOAS V1.0 will improve significantly the quality of the SCIAMACHY ozone product. Since GOME lost its global coverage in July 2003 due to data rate limitation, continuation of the total ozone time series with
20
SCIAMACHY is of highest importance for long-term trend monitoring.
1. Introduction
The stratospheric ozone layer protects the biosphere from harmful ultraviolet radiation. The discovery of the Antarctic ozone hole in the early 1980s (Farman et al., 1985), but also changes in the Arctic and lower latitudes, established the need for global
mea-25
Organi-ACPD
5, 795–813, 2005
SCIAMACHY O3
columns with GOME WFDOAS A. Bracher et al. Title Page Abstract Introduction Conclusions References Tables Figures J I J I Back Close
Full Screen / Esc
Print Version Interactive Discussion
EGU
zation, 1999). To assess current and future changes longterm observations of ozone are urgently needed. Ground-based instruments can provide long and stable records for specified location, but satellite instruments are the most effective way to achieve a global view of the atmosphere. As satellite instruments age and unfortunately die, it is necessary to compare ozone measurements from older with those from newer
instru-5
ments in order to ensure that longterm behaviour, derived from a combination of ozone sensors will be useful (e.g. Cunnold et al., 1996). However, satellite instruments have to be validated during the complete lifetime to ensure ongoing quality of the measured data and to avoid longterm drifts due to instrumental aging.
The Scanning Imaging Absorption Spectrometer for Atmospheric Chartography
10
(SCIAMACHY) is part of the atmospheric chemistry payload of the third Earth obser-vation satellite platform of ESA called ENVISAT which was launched on 1 March 2002. SCIAMACHY is the successor of the Global Ozone Monitoring Experiment (GOME) on ERS-2 measuring ozone columns among other atmospheric constituents in nadir viewing mode (Burrows et al., 1999; Bovensmann et al., 1999). GOME on ERS-2 is
15
operating since April 1995 and delivering operationally global ozone and NO2columns. Also for ozone profiles and other trace gases (BrO, SO2, OCLO, HCHO, water vapour) the retrieval has been demonstrated (more details e.g. in Burrows et al., 1999). The GOME total ozone retrieval algorithm using weighting function DOAS approach (GOME WFDOAS) showed in an extensive global validation with ground–based data an
agree-20
ment on average within 1% and very little seasonal variation (Coldewey-Egbers et al., 2004; Weber et al., 2004). This new algorithm improved upon the current operational GOME total ozone (GDP) Version 3.0 (GDP V3 VALREPORT, 2002). This version will be soon replaced by GDP Version 4.0 that is of comparable quality than WFDOAS V1.0. For this reason the GOME WFDOAS data set from January to June 2003 is used
25
for global validation of the reprocessed SCIAMACHY total ozone Version 5.01/5.04 (differences are negligible between the two versions regarding total ozone). The study was performed in order to analyse the quality of SCIAMACHY global data products by looking at zonal means and seasonal variation as well as dependencies on solar zenith
ACPD
5, 795–813, 2005
SCIAMACHY O3
columns with GOME WFDOAS A. Bracher et al. Title Page Abstract Introduction Conclusions References Tables Figures J I J I Back Close
Full Screen / Esc
Print Version Interactive Discussion
EGU
angle and total ozone itself.
2. Satellite O3data sets
SCIAMACHY is a passive remote sensing instrument, which measures the back scat-tered and reflected electromagnetic radiation from the atmosphere. ENVISAT flies in a sun synchronous near polar orbit at a mean altitude of 795 km with the equator
cross-5
ing time in descending node at 10:00 a.m. local time. One orbits takes about 100 min which results in 14 orbits per day. SCIAMACHY comprises eight spectral channels between 240 and 2380 nm with a channel dependent spectral resolution between 0.2 and 1.5 nm. The total ozone retrieval occurs between 325 and 335 nm at a spectral resolution of about 0.2 nm. SCIAMACHY is the first satellite instrument, that makes
10
spectroscopic observations alternating between nadir and limb viewing geometries, and in addition provides solar and lunar occultation modes. For this study only data from SCIAMACHY nadir observations have been used. The nadir mirror scans along the satellite track and each full scan covers a ground area of approximately 30 km along track by 960 km across track. The effective spatial resolution for ozone total columns
15
from SCIAMACHY varies between 30 km along track and between 30 to 240 km across track as discussed in Bovensmann et al. (1999).
The nadir viewing instrument GOME on board of ERS-2 is a combined prism and grating spectrometer that operates in a similar way as SCIAMACHY. ERS-2 follows EN-VISAT in the same orbit with a time difference of 30 min. Global coverage is achieved
20
after 42 orbits or approximately three days, while for SCIAMACHY it takes six days because of the additional limb measurements. At latitudes higher than 65◦ complete coverage is provided daily except for the polar night region. Measurements cover the entire spectrum from 240 nm to 790 nm with a spectral resolution varying between 0.2 to 0.3 nm and are recorded in four separate spectral channels. The measurement
se-25
quence of an across scan lasts 6 s, three radiance measurements are taken in 1.5 s in forward direction covering together a maximum surface area of 40 km by 960 km each
ACPD
5, 795–813, 2005
SCIAMACHY O3
columns with GOME WFDOAS A. Bracher et al. Title Page Abstract Introduction Conclusions References Tables Figures J I J I Back Close
Full Screen / Esc
Print Version Interactive Discussion
EGU
and the final back scan (Burrows et al., 1999). In June 2003, the tape recorder for intermediate data storage failed, since then only data are transmitted to the ground when ERS-2 is in direct contact with ground stations and this limits the coverage to an extended area in the North Atlantic sector.
Vertical column densities of ozone are retrieved from SCIAMACHY and GOME
UV-5
VIS nadir measurements by using the Differential Optical Absorption Spectroscopy (DOAS, Platt, 1994). For SCIAMACHY, the DOAS algorithm determines ozone slant columns in the 325–335 nm (UV) spectral window, respectively. SCIAMACHY retrieves ozone slant columns in the 425–450 nm (VIS) spectral window, but in this study only the UV results were compared. The SCIAMACHY VIS ozone product still shows major
10
errors (e.g. Bracher et al., 2002). After generation of four versions of SCIAMACHY operational data products from the near real time processor (SCI NL) during commis-sioning phase, the SCI NL processor was upgrated to the newly operational version 5.01 in March 2004. Compared to previous versions, the main changes are an updated radiometric calibration of radiances (level-1 data) and the use of ozone cross-sections
15
measured by Bogumil et al. (2000) with the SCIAMACHY flight model (FM). In August 2004 one part of the SCIAMACHY 2003 level-2 data set was processed with version 5.04 which improves mainly the (re)processing capabilities. Except for the time period from 1 January 2003 to 21 March 2003 where version 5.01 had been affected by an incorrect handling of a season index, the level-2 product of versions 5.01 and 5.04
20
are equal. All versions of the SCIAMACHY operational ozone column product are an adaptation of Version 2.4 of the GOME Data Processor that are two versions behind the current GOME GDP V3.0.
The new algorithm weighting function DOAS (WFDOAS) is used to retrieve total ozone columns from GOME in the 325–335 nm (UV) spectral window. WFDOAS fits
25
vertically integrated ozone weighting functions rather than ozone cross-section to the sun-normalised radiances that enables a direct retrieval of vertical column amounts (Coldewey-Egbers et al., 2004). The WFDOAS algorithm also takes into account the slant column pathlength modulation as a function of wavelength that is usually
ne-ACPD
5, 795–813, 2005
SCIAMACHY O3
columns with GOME WFDOAS A. Bracher et al. Title Page Abstract Introduction Conclusions References Tables Figures J I J I Back Close
Full Screen / Esc
Print Version Interactive Discussion
EGU
glected in standard DOAS when using single air mass factors to convert observed slant column into vertical column densities. For the first time several auxiliary quanti-ties directly derived from the GOME spectral range such as cloud-top-height and cloud fraction (O2-A band) and effective albedo using the Lambertian Equivalent Reflectiv-ity (LER) near 377 nm are used in combination as input to the ozone retrieval. The
5
most significant improvement over GOME V3.0 is the explicit treatment of the ozone dependent contribution in the Raman correction in scattered light known as Ring effect (Coldewey-Egbers et al., 2004). The precision of the total ozone retrieval is estimated to be better than 3% for solar zenith angles below 80◦. A detailed validation study by Weber et al. (2004) showed that GOME WFDOAS total ozone agrees on average
10
within 1% with selected ground-based measurements from the WOUDC (World Ozone and UV Radiation Data Centre), and only shows a negligible seasonal dependency within 0.5% in the mid latitudes and within 1% in the high latitudes, with maximum in winter and minimum in summer. At high solar zenith angles in polar regions a positive bias between 5 to 8% was found (Weber et al., 2004).
15
3. Comparison method
For the comparison available complete data set with near global coverage from both instruments were available for the first half of 2003. Reprocessed SCIAMACHY data set version 5.01/5.04 were validated. Only SCIAMACHY measurements taken at solar zenith angles below 90◦ were included. The GOME WFDOAS V1.0 data set includes
20
measurements below 88◦solar zenith angle.
Since GOME/ERS-2 and SCIAMACHY/ENVISAT are flying in the same orbit only 30 min apart, numerous collocated measurements can be found (up to 10 000 a day). In order to quickly compare collocations of a day up to a month period, and in addi-tion to that, to overcome the difference in ground pixel size of 30 km×60 km of
SCIA-25
MACHY and 40 km×320 km for GOME, the following method was applied: All O3total column data of each day were spatially binned into 2.5◦×2.5◦ wide grids. When both
ACPD
5, 795–813, 2005
SCIAMACHY O3
columns with GOME WFDOAS A. Bracher et al. Title Page Abstract Introduction Conclusions References Tables Figures J I J I Back Close
Full Screen / Esc
Print Version Interactive Discussion
EGU
instruments had measurements in the same grid, the mean of each instrument was compared to the mean of the other instrument as follows:
(tO3of SCIAMACHY – tO3of GOME)/tO3of GOME (1)
The daily comparisons were analysed in four zonal bands (90◦S to 60◦S, 60◦S to 23◦S, 23◦S to 23◦N, 23◦N to 60◦N, 60◦N to 90◦N) and as a function of solar zenith
5
angle and total ozone. In addition to that, means and root mean square (RMS) values of the mean relative deviations as a function of solar zenith angle and total ozone considering all days were determined.
4. Results
Figure 1 shows the binned SCIAMACHY V5.01 and GOME WFDOAS V1.0 global total
10
ozone data from 16 April 2003. SCIAMACHY global total ozone has gaps where limb measurements have been made. Overall, total ozone values from both instruments are in good agreement except in selected regions near the poles (e.g. west of Greenland and around 10◦–20◦E and 65◦–70◦S) where SCIAMACHY total ozone columns are slightly higher and lower, respectively, than GOME WFDOAS.
15
The comparison between the two binned data sets from 16 April 2003 are shown as a function of latitude for all measurements with SCIAMACHY solar zenith angle below 90◦ (Fig. 2 left) and below than 70◦ (Fig. 2 right). These comparisons can be done within two minutes computing time when data are gridded. As an example, results using direct comparisons where SCIAMACHY pixels within each GOME pixel were
20
directly compared to GOME, are also shown here. Opposed to the binning method, the computing time for direct comparisons for this particular day took three days. Both comparison methods agree to within 0.5% for mean relative deviations and within 1% for RMS of mean relative deviations. The direct comparisons show generally lower RMS than the binning method. For SCIAMACHY data limited to solar zenith angle
25
ACPD
5, 795–813, 2005
SCIAMACHY O3
columns with GOME WFDOAS A. Bracher et al. Title Page Abstract Introduction Conclusions References Tables Figures J I J I Back Close
Full Screen / Esc
Print Version Interactive Discussion
EGU
to lack of data south of 53◦S that exhibit larger deviations. In both figures, a clear latitudinal dependence can be seen: between 53◦S and 23◦N SCIAMACHY is within −2% to 0% (±1–3%) and between 23◦N and 80◦N within 0% to +3% (±1–3%) of GOME WFDOAS. When SCIAMACHY measurements south of 53◦S are included the mean relative deviation of SCIAMACHY to GOME WFDOAS decreases to −3%.
5
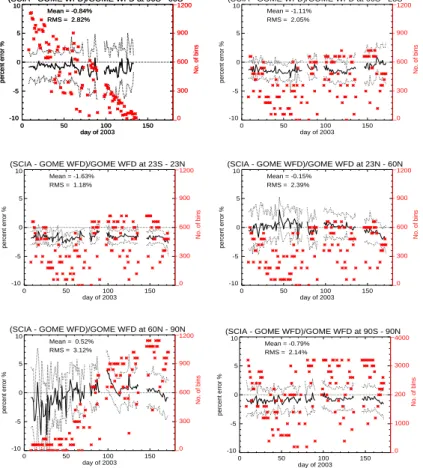
Figure 3 is summarising the results from daily comparisons between January and June 2003 based upon the binning method. The results have been grouped into various zonal bands and the number of data bins within each zonal band are also shown. If all data of one day have been available from both instruments around 3200 data bins have been available for the comparison. At mid latitudes and in the tropics (Fig. 3 top
10
right, middle left, and middle right) these numbers vary between 20 and 700 data bins per day. No differences in mean deviation and RMS can be observed in relation to the number of binned data. Similar conclusions can be drawn from the global data (90◦S to 90◦N, Fig. 3 bottom right). Here, the number of binned data varies between 200 and 3200. In the polar regions, the number of binned data overall decreases from
15
1200 to 0 by changing from summer season to winter (Fig. 3 top left) and increases from 0 to 1200 from winter to summer (Fig. 3 bottom left). For both polar regions, a significant increase in scatter of the mean relative deviation and a significant increase of RMS is observed when the number of data within each bins falls below 300. During Antarctic summer (Fig. 3 top left) the mean relative deviation and RMS are very stable
20
between −1.5 and 0% and 2%, respectively. From March until May, when the number of binned data falls below 300, both, mean relative deviation and RMS are increasing to between −3 and+1% and to between 2 and 4%, respectively. A similar picture is observed in the Arctic (Fig. 3 bottom left): During winter (January and February) mean relative deviation and RMS are high with −7.5 to +2.5% and 3 to 5%, respectively;
25
in spring and early summer (March to June) the mean deviation gets smaller with a mean relative deviation of between −1.5 and+4% and a RMS of 3%. At mid latitudes a weak seasonal signal in the differences can be observed. At southern mid latitudes (Fig. 3 top right) SCIAMACHY has a mean relative deviation of −2 to −0.5% compared
ACPD
5, 795–813, 2005
SCIAMACHY O3
columns with GOME WFDOAS A. Bracher et al. Title Page Abstract Introduction Conclusions References Tables Figures J I J I Back Close
Full Screen / Esc
Print Version Interactive Discussion
EGU
to GOME from summer to fall (January to May) that improves slightly in winter (June) to values within 1%. The RMS increases slightly from values of 1 to 1.5% in summer to 2 to 3% in winter. In the northern mid latitudes (Fig. 3 middle right) SCIAMACHY has a mean relative deviation of −2 to+1% in spring/summer (late March to June) and shows more scatter and more positive values in winter (January to mid March) with
5
−2 to+3%. Again, the RMS decreases slightly from values of 2 to 3% in winter to 1.5 to 2% in spring and summer. The observed increase in the RMS from summer to winter can be explained by the higher ozone variability in winter (e.g. Weber et al., 2002, 2003).
In the tropics, SCIAMACHY total ozone compared to GOME shows very little
varia-10
tion throughout the half year time period. A negative bias of 0.5 to 2.5% with RMS of 1% is observed between SCIAMACHY and GOME. Similar conclusions are drawn from the results containing all data (90◦S to 90◦N), SCIAMACHY total ozone compared to GOME shows very little variation throughout the investigated time period with a mean relative deviation of between −2 and+0.5% and a RMS on the order of 2%.
15
In summary, there is generally an underestimation of SCIAMACHY total ozone with respect to GOME except for the northern mid and polar latitudes where larger variations in the differences are observed. In order to evaluate the results so far obtained, the validation results are investigated as a function of solar zenith angle and total ozone.
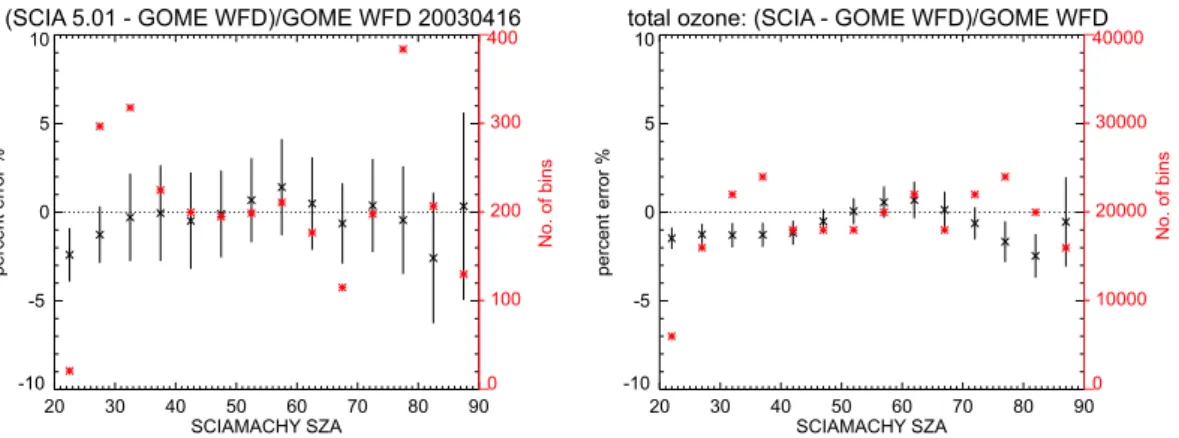
Figure 4 shows the results of the SCIAMACHY-GOME comparisons as a function of
20
the mean of the SCIAMACHY solar zenith angle (SZA) within each data bin. While for one day, 16 April 2003, the mean relative deviation with RMS is shown to the left of Fig. 4, the results from all days are plotted to the right. Both figures show a clear tendency in the differences to GOME as a function of SCIAMACHY SZA. Looking at the results from all SCIAMACHY measurements, the bias of the mean relative deviation
25
to GOME becomes more positive (from −1.5% to 1%) between 20◦and 65◦ SZA and more negative again at higher SZA, but above 85◦SZA quite low (around −0.5%) again. Above 85◦SZA the RMS becomes significantly larger in both analyses as compared to values below 85◦SZA.
ACPD
5, 795–813, 2005
SCIAMACHY O3
columns with GOME WFDOAS A. Bracher et al. Title Page Abstract Introduction Conclusions References Tables Figures J I J I Back Close
Full Screen / Esc
Print Version Interactive Discussion
EGU
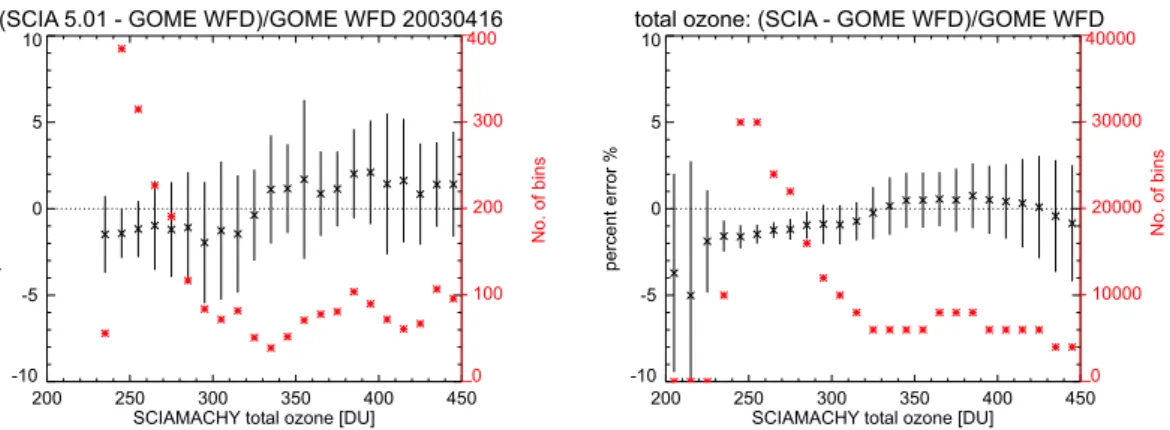
Figure 5 shows the results as a function of the SCIAMACHY total ozone values within a data bin. Looking at the results of all comparisons of one day no correlation between the number of data bins and the mean or RMS of the comparisons is detected (Fig. 5 left), but the plot summarising all days (Fig. 5 right) shows that the RMS is becoming larger when the number of data bins is decreasing. Comparable to the SZA
5
dependence, the mean relative deviations becomes more positive with increasing total ozone up to 390 DU, but above 390 DU more negative again. The similar characteristic behaviour of the differences between SCIAMACHY and GOME as function of SZA and total ozone is not a real surprise since the total ozone is also somewhat dependent on the solar zenith angle during the SCIAMACHY (and GOME) measurement, with higher
10
total ozone observed at mid latitudes with an intermediate SZA.
5. Discussion and conclusions
In this study a large global validation between SCIAMACHY V5.01/5.04 and GOME WFDOAS V1 from the first half of 2003 was performed. A fast method for comparing these large data sets with up to 10 000 collocated pixels per day was introduced. Within
15
two minute computing time comparisons of all collocated measurements within a day can be performed, within a few hours the whole data set was statistically analysed using spatial binning of the SCIAMACHY and GOME total ozone data. It was shown that this binning method produces similar results to within 0.5% compared to direct matches.
20
Overall, the extensive validation of SCIAMACHY total ozone data version 5.01/5.04 shows on average an underestimation of GOME WFDOAS total ozone: the mean rela-tive deviation of SCIAMACHY 5.01/5.04 varies between −2% and+0.5% with an RMS of 2% below 90◦solar zenith angle (SZA). Bearing in mind, that GOME WFDOAS total ozone values are within 1% of global ground-based values (Weber et al., 2004), the
25
results are in accordance with the comparison of SCIAMACHY data version 5.01 to NDSC ground-based measurements where an underestimation of 1% of SCIAMACHY
ACPD
5, 795–813, 2005
SCIAMACHY O3
columns with GOME WFDOAS A. Bracher et al. Title Page Abstract Introduction Conclusions References Tables Figures J I J I Back Close
Full Screen / Esc
Print Version Interactive Discussion
EGU
was detected (Lambert et al., 2004). An improvement of SCIAMACHY total ozone data quality is observed when only data below 85◦or even 75◦SZA are considered.
In addition, the study also illucidated dependencies of SCIAMACHY differences to GOME on total ozone and solar zenith angle (seasons, latitudes). At least the sea-sonal and zonal dependencies are coupled: e.g. in the tropics, where seasons do not
5
play a role and ozone variability is low, the mean relative deviation remains nearly con-stant and RMS values throughout the investigated time period is minimum. At high and mid latitudes, the scatter of mean relative deviation and RMS increases from sum-mer to winter increases as the atmospheric variability increases. Except for the Arctic region a slight increase of the mean relative deviation of SCIAMACHY total ozone to
10
GOME WFDOAS from summer to winter and vice versa is observed. Such seasonal dependencies have already been observed in the northern midlatitudes data of the operational products of GOME GDP 2.4 (see Lambert et al., 2000), and processing of SCIAMACHY V5.01/5.04 is based on this particular data processor version. The shortcomings of the GDP Version 2.4 has been attributed to the following: lack of
tem-15
perature correction in the ozone cross sections, air mass factors (AMF) calculations which use a ozone climatology based on an outdated two-dimensional coupled climate model, a lack of iterations to match total ozone of climatological ozone profiles used in the AMF calculations to the retrieved total ozone, the limited treatment of the at-mospheric profile shape effect, and the partial unsuitability of the particular spectral
20
analysis when the atmosphere becomes optically thick (Lambert et al., 2000). In ad-dition, ozone filling-in as part of the overall Ring effect is not included as it is in the GOME WFDOAS algorithm (Coldewey-Egbers et al., 2004). The much larger negative bias between the SCIAMACHY and GOME algorithms in the Arctic winter of our study compared to other regions might be explained that generally at high SZA and in polar
25
regions satellite and ground based UV-VIS measurements bear larger errors due to a high signal to noise ratio at low light conditions. We probably observed this in the Arctic region only, because Antarctic winter season observations was not covered in our study.
ACPD
5, 795–813, 2005
SCIAMACHY O3
columns with GOME WFDOAS A. Bracher et al. Title Page Abstract Introduction Conclusions References Tables Figures J I J I Back Close
Full Screen / Esc
Print Version Interactive Discussion
EGU
In summary, the current operational SCIAMACHY total ozone data Version 5.01/5.04 shows an insufficient data quality with a clear dependence on season, latitudes and to-tal ozone. When the reprocessing of SCIAMACHY toto-tal ozone data with an equivalent of GOME WFDOAS or GDP Version 4.0 and above will have been carried out, an accu-racy within to 1% for all measurements below 85◦SZA can be expected. GDP Version
5
4.0 will be introduced to GOME in early 2005 (C. Zehner, ESA-ESRIN, personal com-munication). An adaptation of WFDOAS algorithm to SCIAMACHY is currently planned and it will ensure a better consistency between GOME and SCIAMACHY.
Acknowledgements. We would like to thank DLR and ESA/ESRIN for providing GOME and
SCIAMACHY calibrated level 1 spectral and level 2 data, respectively. This work is funded
10
in part by ESA-ESRIN (AO-project 651 SATVAL and contract 16402/02/I-LG), the DLR-Bonn (contract No. 50 EE0025), the BMBF (FKZ 01 SF9994 and 7ATF42 (GOMSTRAT) within the AFO 2000 national research programme), and EU project EVK2-CT-2001-00133 (CANDIDOZ).
References
Bogumil, K., Orphal, J., and Burrows, J. P.: Temperature dependent absorption cross sections
15
of O3, NO2, and other atmospheric trace gases measured with the SCIAMACHY spectrom-eter, Proceedings of the ERS – Envisat – Symposium, Goteborg, Sweden, 2000.
Bovensmann, H., Burrows, J. P., Buchwitz, M., Frerick, J., No ¨el, S., Rozanov, V. V., Chance, K. V., and Goede, A. H. P.: SCIAMACHY – Mission Objectives and Measurement Modes, J. Atmos Sci., 56, 125–150, 1999.
20
Bracher, A., Weber, M., Bramstedt, K., Richter, A., Rozanov, A., von Savigny, C., von K ¨onig, M., and Burrows, J. P.: Validation of ENVISAT trace gas data products by comparison with GOME/ERS-2 and other satellite sensors, in: Proceedings of the Envisat Validation Work-shop, edited by: Lacoste, H., ESA Publications Division, Nordwijk, The Netherlands, SP-531, 2002.
25
Burrows, J. P., Weber, M., Buchwitz, M., Rozanov, V. V., Ladst ¨adter-Weissenmayer, A., Richter, A., de Beek, R., Hoogen, R., Bramstedt, K., Eichmann, K.-U., Eisinger, M., and Perner, D.: The Global Ozone Monitoring Experiment (GOME): Mission Concept and First Scientific Results, J. Atmos Sci., 56, 151–175, 1999.
ACPD
5, 795–813, 2005
SCIAMACHY O3
columns with GOME WFDOAS A. Bracher et al. Title Page Abstract Introduction Conclusions References Tables Figures J I J I Back Close
Full Screen / Esc
Print Version Interactive Discussion
EGU
Coldewey-Egbers, M., Weber, M., Lamsal, L. N., de Beek, R., Buchwitz, M., and Burrows, J. P.: Total ozone retrieval from GOME UV spectral data using the weighting function DOAS approach, Atmos. Chem. Phys. Discuss., 4, 4915–4944, 2004,
SRef-ID: 1680-7375/acpd/2004-4-4915.
Cunnold, D. M., Wang, H., Chu, W. P., and Froidevaux, L.: Comparisons between Stratospheric
5
Aerosol and Gas Experiment II and microwave limb sounder ozone measurements and alias-ing SAGE II ozone trends in the lower stratosphere, J. Geophys. Res., 101, 10 061–10 075, 1996.
Farman, J. C., Peters, D., and Greisinger, K. M.: Large losses of total ozone in Antarctica reveal seasonal ClOX/NO interaction, Nature, 315, 207–210, 1985.
10
GDP V3 VALREPORT: ERS-2 GOMEGDP 3.0 Implementation and Validation, ESA Techni-cal Note ERSE-DTEX-EOAD-TN-02-0006, Issue 1.0, edited by: Lambert, J.-C., November 2002, see also:http://earth.esrin.esa.it/pub/ESA DOC/GOME/gdp3/gdp3.htm, 2002. Lambert, J.-C., Van Roozendael, M., Simon, P. C., Pommereau, J.-P., Goutail, F., Gleason, J.
F., Andersen, S. B., Arlander, D. W., Bui Van, N. A., Claude, H., de La No ¨e, J., De Mazi `ere,
15
M., Dorokhov, V., Eriksen, P., Green, A., Karlsen Tørnkvist, K., K ˚astad Høiskar, B. A., Kyr ¨o, E., Leveau, J., Merienne, M.-F., Milinevsky, G., Roscoe, H. K., Sarkissian, A., Shanklin, J. D., Staehelin, J., Wahlstrøm Tellefsen, C., and Vaughan, G.: Combined characterisation of GOME and TOMS total ozone measurements from space using ground-based observations from the NDSC, Adv. Space Res., 26, 1931–1940, 2000.
20
Lambert, J.-C., Alaart, M., Andersen, S. B., Blumenstock, T., Bodeker, G., Brinksma, E., Cam-bridge, C., de Maziere, M., Demoulin, P., Gerard, P., Gil, M., Goutail, F., Granville, J., Ionov, D. V., Kyr ¨o, E., Navarro-Comas, M., Piters, A., Pommereau, J.-P., Richter, A., Roscoe, H. K., Schets, H., Shanklin, J. D., Suortti, T., Sussmann, R., Van Roozemdael, M., Varostos, C., Wagner, T., Wood, S., and Yela, M.: First ground-based validation of SCIAMACHY v5.01
25
ozone column, in: Proceedings of the Second Workshop on the Atmospheric Chemistry Val-idation of ENVISAT (ACVE-2), edited by: Danesy, D., 3–7 May 2004, ESA ESRIN, Frascati, Italien, ESA Publications Division, Nordwijk, Niederlande, SP-562, 39–46, 2004.
Platt, U.: Differential Optical Absorption Spectroscopy (DOAS), in: Air Monitoring by Spectro-scopic Techniques, edited by: Siegrist, M., Chemical Analysis Series, 127, 27–84, 1994.
30
Weber, M., Eichmann, K.-U., Wittrock, F., Bramstedt, K., Hild, L., Richter, A., Burrows, J. P., and M ¨uller, R.: The cold Arctic winter 1995/96 as observed by the Global Ozone Monitoring experiment GOME and HALOE: Tropospheric wave activity and chemical ozone loss, Q. J.
ACPD
5, 795–813, 2005
SCIAMACHY O3
columns with GOME WFDOAS A. Bracher et al. Title Page Abstract Introduction Conclusions References Tables Figures J I J I Back Close
Full Screen / Esc
Print Version Interactive Discussion
EGU
Roy. Meteor. Soc., 128, 1293–1319, 2002.
Weber, M., Dhomse, S., Wittrock, F., Richter, A., Sinnhuber, B.-M., and Burrows, J. P.: Dynam-ical Control of NH and SH Winter/Spring Total Ozone from GOME Observations in 1995– 2002, Geophys. Res. Lett., 30, 1853, doi:10.1029/2002GL016799, 2003.
Weber, M., Lamsal, L. N., Coldewey-Egbers, M., Bramstedt, K., and Burrows, J. P.:
Pole-to-5
pole validation of GOME WFDOAS total ozone with groundbased data, Atmos. Chem. Phys. Discuss., 4, 6909–6941, 2004,
SRef-ID: 1680-7375/acpd/2004-4-6909.
World Meteorological Organization: Scientific assessment of stratospheric ozone, 1998, U. N. Eniron. Program, Geneva, Switzerland, 1999.
ACPD
5, 795–813, 2005
SCIAMACHY O3
columns with GOME WFDOAS A. Bracher et al. Title Page Abstract Introduction Conclusions References Tables Figures J I J I Back Close
Full Screen / Esc
Print Version Interactive Discussion
EGU
Fig. 1. Total O3 from SCIAMACHY V5.01 (left) and GOME WFDOAS V1.0 (right) binned into 2.5◦×2.5◦grids from 16 April 2003.
ACPD
5, 795–813, 2005
SCIAMACHY O3
columns with GOME WFDOAS A. Bracher et al. Title Page Abstract Introduction Conclusions References Tables Figures J I J I Back Close
Full Screen / Esc
Print Version Interactive Discussion
EGU
Fig. 2. Mean relative deviation (straight line) and root mean square of the mean relative
de-viation (dotted line) between collocated SCIAMACHY V 5.01 and GOME WFDOAS V1.0 total O3 comparisons with binned data sets (black) and by direct collocations (red) are shown for
16 April 2003. In the comparisons all coincidences were included where SCIAMACHY mea-surements have been limited to below 90◦ solar zenith angle (SZA, left) and below 70◦ SZA (right).
ACPD
5, 795–813, 2005
SCIAMACHY O3
columns with GOME WFDOAS A. Bracher et al. Title Page Abstract Introduction Conclusions References Tables Figures J I J I Back Close
Full Screen / Esc
Print Version Interactive Discussion
EGU
(SCIA - GOME WFD)/GOME WFD at 90S - 60S
0 50 100 150 day of 2003 -10 -5 0 5 10 percent error % _ 0 - 300 - 600 - 900 1200 _ No. of bins Mean = -0.84% RMS = 2.82%
(SCIA - GOME WFD)/GOME WFD at 90S - 60S
0 50 100 150 day of 2003 -10 -5 0 5 10 percent error % _ 0 - 300 - 600 - 900 1200 _ No. of bins Mean = -0.84% RMS = 2.82%
(SCIA - GOME WFD)/GOME WFD at 60S - 23S
0 50 100 150 day of 2003 -10 -5 0 5 10 percent error % _ 0 - 300 - 600 - 900 1200 _ No. of bins Mean = -1.11% RMS = 2.05%
(SCIA - GOME WFD)/GOME WFD at 60N - 90N
0 50 100 150 day of 2003 -10 -5 0 5 10 percent error % _ 0 - 300 - 600 - 900 1200 _ No. of bins Mean = 0.52% RMS = 3.12%
(SCIA - GOME WFD)/GOME WFD at 23S - 23N
0 50 100 150 day of 2003 -10 -5 0 5 10 percent error % _ 0 - 300 - 600 - 900 1200 _ No. of bins Mean = -1.63% RMS = 1.18%
(SCIA - GOME WFD)/GOME WFD at 23N - 60N
0 50 100 150 day of 2003 -10 -5 0 5 10 percent error % _ 0 - 300 - 600 - 900 1200 _ No. of bins Mean = -0.15% RMS = 2.39%
(SCIA - GOME WFD)/GOME WFD at 90S - 90N
0 50 100 150 day of 2003 -10 -5 0 5 10 percent error % _ 0 - 1000 - 200 - 3000 4000 _ No. of bins Mean = -0.79% RMS = 2.14%
Fig. 3. Mean relative total ozone deviation (black solid line), root mean square of daily mean
relative deviation (black dotted line) and number of binned data (red asterisks) of all compar-isons between SCIAMACHY V5.01/V5.04 (taken below 90◦ SZA) and GOME WFDOAS V1.0 during the first half of 2003 in various zonal bands: Antarctic latitudes (top left), mid southern latitudes (top right), tropics (middle left), mid northern latitudes (middle right), Arctic latitudes (bottom left), and globally (bottom right).
ACPD
5, 795–813, 2005
SCIAMACHY O3
columns with GOME WFDOAS A. Bracher et al. Title Page Abstract Introduction Conclusions References Tables Figures J I J I Back Close
Full Screen / Esc
Print Version Interactive Discussion
EGU (SCIA 5.01 - GOME WFD)/GOME WFD 20030416
20 30 40 50 60 70 80 90 SCIAMACHY SZA -10 -5 0 5 10 percent error % _0 - 100 - 200 - 300 400 _ No. of bins
total ozone: (SCIA - GOME WFD)/GOME WFD
20 30 40 50 60 70 80 90 SCIAMACHY SZA -10 -5 0 5 10 percent error % _0 - 10000 - 20000 - 30000 40000 _ No. of bins
Fig. 4. Comparisons of binned SCIAMACHY V5.01/V5.04 with GOME WFDOAS V1.0 total
O3 as a function of SCIAMACHY solar zenith angle in 5◦ steps. Left: Mean with root mean square of the mean relative deviation from 16 April 2003 (black crosses and bars) and number of binned data (red asterisks). Right: The same but for all data from the first half of 2003.
ACPD
5, 795–813, 2005
SCIAMACHY O3
columns with GOME WFDOAS A. Bracher et al. Title Page Abstract Introduction Conclusions References Tables Figures J I J I Back Close
Full Screen / Esc
Print Version Interactive Discussion
EGU (SCIA 5.01 - GOME WFD)/GOME WFD 20030416
200 250 300 350 400 450
SCIAMACHY total ozone [DU] -10 -5 0 5 10 percent error % 0 - 100 - 200 - 300 400 _ _ No. of bins
total ozone: (SCIA - GOME WFD)/GOME WFD
200 250 300 350 400 450
SCIAMACHY total ozone [DU] -10 -5 0 5 10 percent error % 0 - 10000 - 20000 - 30000 40000 _ _ No. of bins
Fig. 5. Comparisons of binned SCIAMACHY V5.01/V5.04 with GOME WFDOAS V1.0 total O3
as a function of SCIAMACHY total ozone in 10 DU steps. Left: Mean with root mean square of the mean relative deviation from 16 April 2003 (black crosses and bars) and number of binned data (red asterisks). Right: The same, but for all data from the first half of 2003.