HAL Id: hal-00301155
https://hal.archives-ouvertes.fr/hal-00301155
Submitted on 1 Apr 2005HAL is a multi-disciplinary open access
archive for the deposit and dissemination of sci-entific research documents, whether they are pub-lished or not. The documents may come from teaching and research institutions in France or abroad, or from public or private research centers.
L’archive ouverte pluridisciplinaire HAL, est destinée au dépôt et à la diffusion de documents scientifiques de niveau recherche, publiés ou non, émanant des établissements d’enseignement et de recherche français ou étrangers, des laboratoires publics ou privés.
Carbon monoxide, methane and carbon dioxide columns
retrieved from SCIAMACHY by WFM-DOAS: year
2003 initial data set
M. Buchwitz, R. de Beek, S. Noël, J. P. Burrows, H. Bovensmann, H. Bremer,
P. Bergamaschi, S. Körner, M. Heimann
To cite this version:
M. Buchwitz, R. de Beek, S. Noël, J. P. Burrows, H. Bovensmann, et al.. Carbon monoxide, methane and carbon dioxide columns retrieved from SCIAMACHY by WFM-DOAS: year 2003 initial data set. Atmospheric Chemistry and Physics Discussions, European Geosciences Union, 2005, 5 (2), pp.1943-1971. �hal-00301155�
ACPD
5, 1943–1971, 2005 CO, CH4, and CO2 columns from SCIAMACHY M. Buchwitz et al. Title Page Abstract Introduction Conclusions References Tables Figures J I J I Back Close Full Screen / EscPrint Version Interactive Discussion
EGU
Atmos. Chem. Phys. Discuss., 5, 1943–1971, 2005 www.atmos-chem-phys.org/acpd/5/1943/
SRef-ID: 1680-7375/acpd/2005-5-1943 European Geosciences Union
Atmospheric Chemistry and Physics Discussions
Carbon monoxide, methane and carbon
dioxide columns retrieved from
SCIAMACHY by WFM-DOAS: year 2003
initial data set
M. Buchwitz1, R. de Beek1, S. No ¨el1, J. P. Burrows1, H. Bovensmann1, H. Bremer1, P. Bergamaschi2, S. K ¨orner3, and M. Heimann3
1
Institute of Environmental Physics (IUP), University of Bremen FB1, Bremen, Germany
2
Institute for Environment and Sustainability, Joint Research Centre (EC-JRC-IES), Ispra, Italy
3
Max Planck Institute for Biogeochemistry (MPI-BGC), Jena, Germany
Received: 27 January 2005 – Accepted: 4 March 2005 – Published: 1 April 2005 Correspondence to: M. Buchwitz ([email protected]) © 2005 Author(s). This work is licensed under a Creative Commons License.
ACPD
5, 1943–1971, 2005 CO, CH4, and CO2 columns from SCIAMACHY M. Buchwitz et al. Title Page Abstract Introduction Conclusions References Tables Figures J I J I Back Close Full Screen / EscPrint Version Interactive Discussion
EGU
Abstract
The near-infrared nadir spectra measured by SCIAMACHY on-board ENVISAT con-tain information on the vertical columns of important atmospheric trace gases such as carbon monoxide (CO), methane (CH4), and carbon dioxide (CO2). The scientific algorithm WFM-DOAS has been used to retrieve this information. For CH4 and CO2 5
also column averaged mixing ratios (XCH4 and XCO2) have been determined by si-multaneous measurements of the dry air mass. All available spectra of the year 2003 have been processed. We describe the algorithm versions used to generate the data (v0.4; for methane also v0.41) and show comparisons of monthly averaged data over land with global measurements (CO from MOPITT) and models (for CH4 and CO2). 10
We show that enhanced concentrations of CO resulting from biomass burning have been detected which are in reasonable agreement with MOPITT. The measured XCH4 is enhanced over India, south-east Asia, and central Africa in September/October 2003 in line with model simulations where they result from surface sources of methane such as rice fields and wetlands. In qualitative agreement with model simulations the XCO2 15
measurements over the northern hemisphere show the lowest mixing ratios around July due to uptake of CO2 by the growing vegetation of the land biosphere. We also identified potential problems such as a too low inter-hemispheric gradient for CO, a time dependent bias of the methane columns on the order of a few percent, and a few percent too high CO2over parts of the Sahara.
20
1. Introduction
Knowledge about the global distribution of carbon monoxide (CO) and of the relatively well-mixed greenhouse gases methane (CH4) and carbon dioxide (CO2) is important for many reasons. CO, for example, plays a central role in tropospheric chemistry (see, e.g.,Bergamaschi et al.,2000, and references given therein) as CO is the leading sink 25
ACPD
5, 1943–1971, 2005 CO, CH4, and CO2 columns from SCIAMACHY M. Buchwitz et al. Title Page Abstract Introduction Conclusions References Tables Figures J I J I Back Close Full Screen / EscPrint Version Interactive Discussion
EGU
the troposphere and, therefore, its self-cleansing efficiency and the concentration of greenhouse gases such as CH4. CO also has large air quality impact as a precurser to tropospheric ozone, a secondary pollutant associated with respiratory problems and decreased crop yields. Satellite measurements of CH4 and CO2 in combination with inverse modeling have the potential to help better understand their surface sources 5
and sinks than currently possible with the very accurate but rather sparse data from the network of surface stations (seeHouweling et al.,1999,2004;Rayner and O’Brian,
2001, and references given therein). A better understanding of the sources and sinks of CH4and CO2is important for example to accurately predict the future concentrations of these gases and associated climate change. Monitoring of the emissions of these 10
gases is also required by the Kyoto protocol.
The first CO results from SCIAMACHY retrieved by WFM-DOAS have recently been presented inBuchwitz et al.(2004a), and first results on CH4and CO2have been pre-sented inBuchwitz et al.(2004b), both papers focusing on a detailed analysis of single day data (except for CO2 for which also time averaged data have been discussed). 15
Here we present the first large data set of the above mentioned gases obtained by pro-cessing nearly a year (year 2003) of nadir radiance spectra using initial versions (v0.4 and v0.41) of the WFM-DOAS retrieval algorithm. WFM-DOAS is a scientific retrieval algorithm which is independent of the official operational algorithm of DLR/ESA.
The SCIAMACHY/WFM-DOAS data set has been compared with independent 20
ground based Fourier Transform Spectroscopy (FTS) measurements. These compar-isons, which are limited to the data close to a given ground station, are described elsewhere in this issue (e.g., Dils et al., 2005; Sussmann et al., 2005). Initial compari-son for a sub-set of the data can be found inde Maziere et al.(2004);Sussmann and
Buchwitz (2005);Warneke et al.(2005). Here we focus on the comparison with global 25
reference data.
Accurate retrieval of the columns of the gases from the SCIAMACHY spectra is a challenging task for many reasons, e.g., because of calibration issues (related to the high and variable dark signals in the near-infrared), because the weak CO lines are
ACPD
5, 1943–1971, 2005 CO, CH4, and CO2 columns from SCIAMACHY M. Buchwitz et al. Title Page Abstract Introduction Conclusions References Tables Figures J I J I Back Close Full Screen / EscPrint Version Interactive Discussion
EGU
difficult to detect, and because of the challenging accuracy and precision requirements for CO2 and CH4. When developing the retrieval algorithm many choices have to be made (selection of spectral fitting window, inversion procedure including definition of fit parameters and use of a priori information, radiative transfer approximations, etc.) to process the data in an optimum way such that a good compromise is achieved between 5
processing speed and accuracy of the data products. In this context it is important to point out that other groups are also working on this using quite different approaches
(seeGloudemans et al.,2004;Frankenberg et al.,2005,2004).
This paper is organized as follows: In Sect. 2 the SCIAMACHY instrument is in-troduced followed by a description of the WFM-DOAS retrieval algorithm in Sect. 3. 10
Section4 gives an overview about the processed data mainly in terms of time cover-age. The main sections are the three Sects.5–7where the results for CO, CH4, and CO2are separately presented and discussed. The conclusions are given in Sect.8.
2. The SCIAMACHY instrument
The SCanning Imaging Absorption spectroMeter for Atmospheric CHartographY 15
(SCIAMACHY) instrument (Burrows et al., 1995; Bovensmann et al., 1999, 2004) is part of the atmospheric chemistry payload of the European Space Agencies (ESA) environmental satellite ENVISAT, launched in March 2002. ENVISAT flies in sun-synchronous polar low Earth orbit crossing the equator at 10:00 a.m. local time. SCIA-MACHY is a grating spectrometer that measures spectra of scattered, reflected, and 20
transmitted solar radiation in the spectral region 240–2400 nm in nadir, limb, and solar and lunar occultation viewing modes.
SCIAMACHY consists of eight main spectral channels (each equipped with a linear detector array with 1024 detector pixels) and seven spectrally broad band Polarization Measurement Devices (PMDs) (details are given in Bovensmann et al., 1999). For 25
this study observations of channel 6 (for CO2) and 8 (for CH4, CO, and N2O), and Po-larization Measurement Device (PMD) number 1 (∼320–380 nm) have been used. In
ACPD
5, 1943–1971, 2005 CO, CH4, and CO2 columns from SCIAMACHY M. Buchwitz et al. Title Page Abstract Introduction Conclusions References Tables Figures J I J I Back Close Full Screen / EscPrint Version Interactive Discussion
EGU
addition, channel 4 has been used to determine the mass of dry air from oxygen (O2) column measurements using the O2A band. Channels 4, 6 and 8 measure simultane-ously the spectral regions 600–800 nm, 970–1772 nm and 2360–2385 nm at spectral resolutions of 0.4, 1.4 and 0.2 nm, respectively. For SCIAMACHY the spatial resolution depends on the spectral interval and orbital position. For channel 8 data, the spatial 5
resolution, i.e., the footprint size of a single nadir measurement, is 30×120 km2 corre-sponding to an integration time of 0.5 s, except at high solar zenith angles (e.g., polar regions in summer hemisphere), where the pixel size is twice as large (30×240 km2). For the channel 4 and 6 data used for this study the integration time is mostly 0.25 s cor-responding to a horizontal resolution of 30×60 km2. SCIAMACHY also performs direct 10
(extraterrestrial) sun observations, e.g., to obtain the solar reference spectra needed for the retrieval.
SCIAMACHY is one of the first instruments that performs nadir observations in the near-infrared (NIR) spectral region (i.e., around 2 µm). In contrast to the ultra violet (UV) and visible spectral regions where high performance Si detectors have been man-15
ufactured for a long time, no appropriate near-infrared detectors were available when SCIAMACHY was designed. The near-infrared InGaAs detectors of SCIAMACHY were a special development for SCIAMACHY. Compared to the UV-visible detectors they are characterized by a substantially higher pixel-to-pixel variability in quantum efficiency and dark (leakage) current. Each detector array has a large number of dead and bad 20
pixels. In addition, the dark signal is significantly higher compared to the UV-visible mainly because of thermal radiation generated by the instrument itself. The in-flight optical performance of SCIAMACHY is overall as expected from the on-ground calibra-tion and characterizacalibra-tion activities (Bovensmann et al., 2004). One exception is the time dependent optical throughput variation in the SCIAMACHY NIR channels 7 and 8 25
due the build-up of an ice layer on the detectors (“ice issue”). This effect is minimised by regular heating of the instrument (Bovensmann et al.,2004) during decontamination phases. The ice layers adversely influence the quality of the retrieval of all gases dis-cussed in this paper as they result in reduced throughput (transmission) and, therefore,
ACPD
5, 1943–1971, 2005 CO, CH4, and CO2 columns from SCIAMACHY M. Buchwitz et al. Title Page Abstract Introduction Conclusions References Tables Figures J I J I Back Close Full Screen / EscPrint Version Interactive Discussion
EGU
reduced signal and signal-to-noise performance. In addition, changes of the instrument slit function have been observed which introduce systematic errors. All these issues complicate the retrieval.
3. WFM-DOAS retrieval algorithm
The Weighting Function Modified Differential Optical Absorption Spectroscopy (WFM-5
DOAS) retrieval algorithm and its current implementation is described in detail else-where (Buchwitz et al., 2000a,2004a,b). In short, WFM-DOAS is an unconstrained linear-least squares method based on scaling pre-selected trace gas vertical profiles. The fit parameters are the desired vertical columns. The logarithm of a linearized radia-tive transfer model plus a low-order polynomial is fitted to the logarithm of the ratio of the 10
measured nadir radiance and solar irradiance spectrum, i.e., observed sun-normalized radiance. The WFM-DOAS reference spectra are the logarithm of the sun-normalized radiance and its derivatives. They are computed with a radiative transfer model taking into account line-absorption and multiple scattering (Buchwitz et al., 2000b). A fast look-up table scheme has been developed in order to avoid time consuming on-line 15
radiative transfer simulations.
In order to identify cloud-contaminated ground pixels we use a simple threshold al-gorithm based on sub-pixel information as provided by the SCIAMACHY Polarization Measurement Devices (PMDs) (details are given inBuchwitz et al.,2004a,b). We use PMD1 which corresponds to the spectral region 320–380 nm located in the UV part 20
of the spectrum. Strictly speaking, the algorithm detects enhanced backscatter in the UV. Enhanced UV backscatter mainly results from clouds but might also be due to high aerosol loading or high surface UV spectral reflectance. As a result, ice or snow covered surfaces may be wrongly classified as cloud contaminated. This needs to be improved in future versions of our retrieval method.
25
The quality of the WFM-DOAS fits in the near-infrared is poor (i.e., the fit residuals are large) when applying WFM-DOAS to the operational Level 1 data products. In
ACPD
5, 1943–1971, 2005 CO, CH4, and CO2 columns from SCIAMACHY M. Buchwitz et al. Title Page Abstract Introduction Conclusions References Tables Figures J I J I Back Close Full Screen / EscPrint Version Interactive Discussion
EGU
order to improve the quality of the fits and thereby the quality of our data products we pre-process the operational Level 1 data products mainly with respect to a better dark signal calibration (seeBuchwitz et al.,2004a,b). In addition, there are indications that the in-orbit slit function of SCIAMACHY is different from the one measured on-ground (Hans Schrijver (SRON), personal communication) due to the “ice issue” (see Sect.2). 5
We use a slit function that has been determined by applying WFM-DOAS to the in-orbit nadir measurements. We selected the one that resulted in best fits, i.e., smallest fit residuum (seeBuchwitz et al.,2004a,b).
4. WFM-DOAS data products: time coverage
The WFM-DOAS trace gas column data products have been derived by processing 10
all consolidated SCIAMACHY Level 1 operational product files (i.e., the calibrated and geolocated spectra) of the year 2003 that have been made available by ESA/DLR (up to mid-2004). Figure 1 gives an overview about the number of orbits per day that have been processed. The maximum number of orbits per day is about fourteen. As can been seen (blue lines), all 14 orbits were available for only a small number of 15
days. For many days no data were available. Many of the large data gaps are due to decontamination phases (see Sect.2) which are indicated by red lines). For November and December 2003 no consolidated (i.e., full product) orbit files have been made available (for ground processing related reasons).
5. Carbon monoxide (CO)
20
For CO column retrieval a small spectral fitting window (2359–2370 nm) located in SCIAMACHY channel 8 has been selected which covers four CO absorption lines. The retrieval is complicated by strong overlapping absorption features of methane and wa-ter vapor. The first results of CO from SCIAMACHY have been presented inBuchwitz
ACPD
5, 1943–1971, 2005 CO, CH4, and CO2 columns from SCIAMACHY M. Buchwitz et al. Title Page Abstract Introduction Conclusions References Tables Figures J I J I Back Close Full Screen / EscPrint Version Interactive Discussion
EGU
et al. (2004a) focusing on a detailed analysis of three days of data of the year 2003. For details concerning pre-processing of the spectra (for improving the calibration), WFM-DOAS v0.4 retrieval, vertical column averaging kernels, quality of the spectral fits, and a quantitative comparison with MOPITT Version 3 CO columns (Deeter et al.,
2003;Emmons et al.,2004) we refer toBuchwitz et al.(2004a). An initial error analysis
5
using simulated measurements can be found in Buchwitz and Burrows(2004) where it is shown that the errors are expected to be less than about 20%. In Buchwitz et
al. (2004a) it has been shown that strong plumes of CO can be detected with single overpass data which are in good qualitative agreement with MOPITT. Globally, for mea-surements over land, the standard deviation of the difference with respect to MOPITT 10
was shown to be in the range 0.4–0.6×10¹⁸molecules/cm2 and the linear correlation coefficient between 0.4 and 0.7. The differences depend on time and location but are typically within 30% for most latitudes. Perfect agreement with MOPITT is, however, not to be expected for a number of reasons (differences in overpass time, spatial reso-lution, etc.). In this context it is important to point out that the sensitivity of SCIAMACHY 15
measurements is nearly independent of altitude whereas the sensitivity of MOPITT to boundary layer CO is low. On the other hand, retrieval of CO from SCIAMACHY is not unproblematic. For example, the WFM-DOAS v0.4 CO column are scaled with a con-stant factor of 0.5 to compensate for an obvious overestimation. This overestimation is most probably closely related to the difficulty of accurately fitting the weak CO lines. 20
The fit residuals, which are on the order of the CO lines, are not (yet) signal-to-noise limited but dominated by (not yet understood) rather stable spectral artifacts.
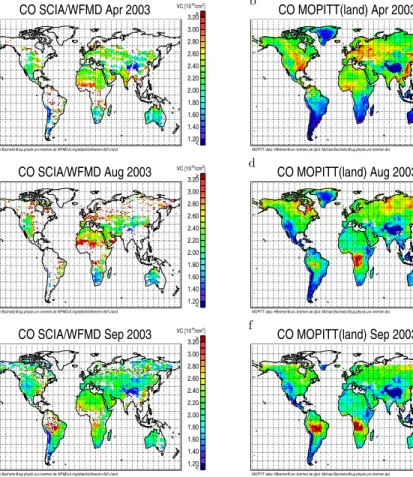
Figure 2 shows a comparison of monthly averaged WFM-DOAS version 0.4 CO columns with CO from MOPITT (version 3). Because of the low surface reflectivity of water the NIR nadir measurements are noisy over the ocean (outside sun-glint con-25
ditions). Therefore, we focus on SCIAMACHY measurements over land. Only these measurements are shown in Fig.2. The same land mask as used for SCIAMACHY has also been used for MOPITT to ease the comparison. SCIAMACHY data have only been averaged if the CO fit error is less than 60% and when the pixels have been
ACPD
5, 1943–1971, 2005 CO, CH4, and CO2 columns from SCIAMACHY M. Buchwitz et al. Title Page Abstract Introduction Conclusions References Tables Figures J I J I Back Close Full Screen / EscPrint Version Interactive Discussion
EGU
flagged cloud free. As can be seen from Fig. 1, there are large SCIAMACHY data gaps for April and August. Therefore, the SCIAMACHY data shown in Fig. 2are not monthly averages obtained from a bias free sampling. The August data, for example, are strongly biased towards the beginning of August.
Only for September were nearly all orbits available. As a result, nearly all land ar-5
eas are covered by measurements during this month. But even for this month there are quite large gaps. There are nearly no data over Greenland because the cloud de-tection algorithm can not discriminate between clouds and snow/ice covered surfaces. There are also large gaps in the tropics due to persistent cloud coverage. When com-paring the September data from SCIAMACHY and MOPITT one can see that overall 10
the agreement is good. Both sensors show that the columns are typically between 1.7 and 2.5×10¹⁸molecules/cm2 (shown in green). Both sensors show large regions of enhanced CO in the northern part of South America and over the central/southern part of Africa. It is well known that a lot of biomass burning is going on in these regions in September. In the northern hemisphere the overall agreement is reasonable but 15
there are also substantial differences. For example, SCIAMACHY sees much higher CO over the eastern part of the United States compared to MOPITT. If this is due to the higher sensitivity of the SCIAMACHY measurements for boundary layer CO or for other reasons is currently unclear.
The April data of SCIAMACHY show large gaps in time and space. The agreement 20
with MOPITT is not so good as for September. The main difference with respect to MO-PITT is the significantly weaker inter-hemispheric difference as seen by SCIAMACHY. Both sensors give (on average) quite similar values over the northern hemisphere but over the southern hemisphere there are significant differences. Here the MOPITT data are mostly in the range 1.2–1.7×10¹⁸molecules/cm2 whereas the SCIAMACHY data 25
are systematically higher (around 2×10¹⁸molecules/cm2). The SCIAMACHY data over South America are sparse. Nevertheless, outside the Andes mountains, there are clear differences concerning the observed CO plumes. Whereas MOPITT only de-tects strongly elevated levels of CO in the most northern part of South America,
SCIA-ACPD
5, 1943–1971, 2005 CO, CH4, and CO2 columns from SCIAMACHY M. Buchwitz et al. Title Page Abstract Introduction Conclusions References Tables Figures J I J I Back Close Full Screen / EscPrint Version Interactive Discussion
EGU
MACHY shows elevated CO also at various other places. The northern hemisphere is difficult to compare because of the large gaps in the SCIAMACHY data. Both sensors observe elevated CO over a large part of western central Africa north of the equator, where significant biomass burning is typically going on during this time of the year.
For August 2003 there are also large gaps in the SCIAMACHY data. In general, the 5
agreement is fair but there are large differences over several parts of the world. For example, SCIAMACHY sees high CO over a large part of northern Africa not seen by MOPITT. The reason for this difference is not clear. The MOPITT data are in better agreement with typical biomass burning areas for August. There are also large regions over the northern hemisphere where SCIAMACHY sees higher columns than MOPITT. 10
For example, SCIAMACHY sees high CO over Portugal (but not over Spain) which is not observed by MOPITT. This coincides with large fires which were going on in August 2003 in Portugal (but not in Spain).
In summary, the agreement is reasonable but there are significant differences at certain locations during certain times of the year. More investigations are needed to 15
explain the observed differences taking into account the different altitude sensitivities of both sensors.
6. Methane (CH4)
The methane columns have been retrieved from a small spectral fitting window (2265– 2280 nm) located in SCIAMACHY channel 8 which covers several absorption lines of 20
CH4 and several but much weaker absorption lines of nitrous oxide (N2O) and water vapor (H2O). The main scientific application of the methane measurements of SCIA-MACHY is to obtain information on the surface sources of methane. The modulation of methane columns due to methane sources is only on the order of about one percent. This is much weaker than the variation of the methane column due to changes of sur-25
face pressure (because methane is well-mixed the methane column is highly correlated with the total air mass and, therefore, with surface pressure). To filter out these much
ACPD
5, 1943–1971, 2005 CO, CH4, and CO2 columns from SCIAMACHY M. Buchwitz et al. Title Page Abstract Introduction Conclusions References Tables Figures J I J I Back Close Full Screen / EscPrint Version Interactive Discussion
EGU
larger disturbing modulations, the methane columns need to be normalized by the ob-served airmass to obtain a so called dry air column averaged mixing ratio of methane (denoted XCH4). To accomplish this, oxygen (O2) columns have been retrieved in addition to the methane columns. From the oxygen columns the airmass can be cal-culated using its constant mixing ratio of 0.2095. The O2 columns used to compute 5
the WFM-DOAS v0.4 XCH4 data product have been retrieved from the SCIAMACHY measurements in the O2A band spectral region (around 760 nm; channel 4).
First CH4results from SCIAMACHY have been presented inBuchwitz et al.(2004b) focusing on a detailed analysis of four days of data of the year 2003. For details con-cerning pre-processing of the spectra (to improve the calibration), WFM-DOAS (v0.4) 10
processing, averaging kernels, quality of the spectral fits, and a quantitative compari-son with global models we refer to that study. An initial error analysis using simulated measurements is given inBuchwitz and Burrows(2004). According to this error anal-ysis errors of a few percent due to undetected cirrus clouds, aerosols, surface reflec-tivity, temperature and pressure profiles, etc., are to be expected. It has been shown 15
inBuchwitz et al.(2004b) that the WFM-DOAS Version 0.4 methane columns have a
time dependent (nearly globally uniform) bias of up to −15% (low bias of SCIAMACHY) for one of the four days that have been analyzed. The bias is correlated with the time after the last decontamination performed to get rid of the ice layers on the detectors. Therefore, Buchwitz et al. (2004b) concluded that the bias might be due to the “ice-20
issue” (see Sect. 2). This is consistent with the finding of H. Schrijver (SRON) (see Sect.2) that the ice build-up on the detectors results in a broadening of the instrument slit function (the wider the slit function compared to the assumed slit function, the larger the underestimation of the retrieved methane column).
Because the methane source signal is weak it typically cannot be detected with 25
single overpass or single day SCIAMACHY data. To detect methane sources averages have to be computed. Because of the time dependent bias of the WFM-DOAS v0.4 methane columns, however, this is not directly possible.
ACPD
5, 1943–1971, 2005 CO, CH4, and CO2 columns from SCIAMACHY M. Buchwitz et al. Title Page Abstract Introduction Conclusions References Tables Figures J I J I Back Close Full Screen / EscPrint Version Interactive Discussion
EGU
an improved version of our methane data product (Version 0.41) by applying a bias correction to the v0.4 methane columns. We assume that the data can be sufficiently corrected by dividing the columns by a globally constant scaling factor which only pends on time (on the day of the measurement). The correction factor has been de-termined as follows: For each day all cloud free v0.4 XCH4 measurements over the 5
Sahara have been averaged. The ratio of these daily average mixing ratios to a con-stant reference value (chosen to be 1750 ppbv) is approximately the methane bias (because methane is not constant this is not exactly the methane bias and a certain systematic error is introduced by this assumption). This time dependent methane bias is shown in Fig.3 (black diamonds). This bias shows a similar time dependence as 10
the independently measured channel 8 transmission loss also shown in Fig.3(red dia-monds). The transmission has been determined by averaging the signal of the channel 8 solar measurements normalized to a reference measurement at the beginning of the mission. The varying transmission is a consequence of the varying ice layer on the detectors. Figure 3 shows a third curve, the (daily) correction factor (magenta dia-15
monds). The correction factor curve has been obtained by linearly transforming the transmission curve. The coefficients of the linear transformation have been selected such that a good match is obtained with the methane bias curve. In order to correct the WFM-DOAS v0.4 methane columns for the systematic errors introduced by the ice layer the correction factors are applied as follows: All v0.4 methane columns of a given 20
day have been divided by the correction factor for this day. The corrected WFM-DOAS v0.4 methane columns are the new WFM-DOAS v0.41 (absolute) methane columns.
In order to generate the new WFM-DOAS v0.41 XCH4 product a second modifica-tion has been applied: Instead of normalizing the methane columns by the oxygen column retrieved from the 760 nm O2A band (as done for v0.4 XCH4), they have been 25
normalized by the CO2columns retrieved from the 1580 nm region (for details on CO2 retrieval see Sect.7). Using CO2rather than O2for normalizing the methane columns has been first proposed by C. Frankenberg et al. (presented at ENVISAT Symposium, Salzburg, Austria, 6–10 September 2004). The reason why normalizing methane by
ACPD
5, 1943–1971, 2005 CO, CH4, and CO2 columns from SCIAMACHY M. Buchwitz et al. Title Page Abstract Introduction Conclusions References Tables Figures J I J I Back Close Full Screen / EscPrint Version Interactive Discussion
EGU
CO2rather than O2is expected to give better results for XCH4is because errors of CO2 and CH4are similar and cancel much better when the ratio is computed. Errors due to aerosols, residual cloud contamination, surface reflection, etc., are expected to be the more similar, the more similar the radiative transfer is. In general, this requires that the two spectral intervals from which the two columns are retrieved are located as close as 5
possible (in wavelength). As the CO2fitting window (at 1580 nm), is much closer to the CH4 fitting window (2270 nm) than the O2window (760 nm) canceling of errors will be better using CO2. In addition, when the column retrieval from the two spectral regions suffers from similar instrumental/calibration errors, also these errors cancel to a certain extent.
10
The drawback of this approach is that CO2is not as constant as O2mainly because of the surface sources and sinks of CO2. This approach requires that the variability of the column averaged mixing ratio of CO2 is small (ideally negligible) compared to the variability of the column averaged mixing ratio of CH4. According to global model simu-lation this is a reasonable assumption. The model simusimu-lations shown inBuchwitz et al.
15
(2004a) indicate that the variability of the methane column is about 6% (±100 ppbv) and
the variability of the CO2column is about 1.5% (±5 ppmv), i.e., a factor of four smaller than for methane. This means that the error introduced by essentially assuming that CO2is constant is less than about 1.5%. This is comparable to the estimated error on the WFM-DOAS v0.4 CO2columns as reported inBuchwitz and Burrows(2004). 20
Figure 4 shows a comparison of WFM-DOAS v0.41 XCH4 with TM5 model simu-lations. The TM5 model is a two-way nested atmospheric zoom model (Krol et al.,
2004). It allows to define zoom regions (e.g. over Europe) which are run at higher spatial resolution (1×1◦), embedded into the global domain, run at a resolution of 6×4◦. We employ the tropospheric standard version of TM5 with 25 vertical layers. TM5 is 25
an off-line model and uses analyzed meteorological fields from the ECMWF weather forecast model to describe advection and vertical mixing by cumulus convection and turbulent diffusion. CH4 (a priori) emissions are as described by Bergamaschi et al.
ACPD
5, 1943–1971, 2005 CO, CH4, and CO2 columns from SCIAMACHY M. Buchwitz et al. Title Page Abstract Introduction Conclusions References Tables Figures J I J I Back Close Full Screen / EscPrint Version Interactive Discussion
EGU
OH fields based on CBM-4 chemistry and optimized with methyl chloroform, for the stratosphere also the reaction of CH4with Cl and O(1D) radicals are considered. The comparison is limited to observations over land as the SCIAMACHY observations over ocean are less precise because of the low ocean reflectivity in the near-infrared. For SCIAMACHY all measurements from cloud free pixels have been averaged where the 5
CH4 column fit error is less than 10%. The bi-monthly averages have been computed from daily gridded data. For the model simulations only those grid boxes where mea-surements were available have been used to compute the averages.
The comparison with the model simulations shows similarities but also differences. Very interestingly and in qualitative agreement with the model simulations, the mea-10
surements show high CH4 mixing ratios in the September to October 2003 average over India, southeast Asia, and over the western part of central Africa, which are ab-sent or significantly lower in the March to April average. In the model the high columns in these regions are a result of methane emissions mainly from rice fields, wetlands, ruminants, and waste handling. The good agreement with the model simulations indi-15
cates that SCIAMACHY can detect these emission signals. However, there are also differences compared to the model simulations. For example, in the March-April aver-age the SCIAMACHY data are few percent lower over large parts of South America but over large parts of the northern hemisphere the SCIAMACHY data are a few percent lower. More investigations are needed to find out what the reasons for these discrep-20
ancies are.
Figure5shows a quantitative comparison of the daily data with the TM5 model, the correlation coefficient and the bias for the two versions of SCIAMACHY XCH4 data products, namely v0.4 and v0.41. As can be seen, the bias is significantly smaller for the v0.41 data, although not zero. There still appears to be a systematic bias due to 25
the ice issue indicating that the bias correction applied to generate the v0.41 data is not perfect. Also the correlation with the model results is better for the version 0.41 data, especially in the middle of 2003, where the correlation coefficient can be as high as 0.9.
ACPD
5, 1943–1971, 2005 CO, CH4, and CO2 columns from SCIAMACHY M. Buchwitz et al. Title Page Abstract Introduction Conclusions References Tables Figures J I J I Back Close Full Screen / EscPrint Version Interactive Discussion
EGU
7. Carbon dioxide (CO2)
The CO2 columns have been retrieved using a small spectral fitting window (1558– 1594 nm) located in SCIAMACHY channel 6 (which is not affected by an ice layer). This spectral region covers one absorption band of CO2and weak absorption features of water vapor. As for methane v0.4 (air or) O2-normalized CO2 columns have been 5
derived, the dry air column averaged mixing ratios XCO2. First results of CO2 from SCIAMACHY have been presented in Buchwitz et al. (2004b). For details concern-ing pre-processconcern-ing of the spectra (for improvconcern-ing the calibration), WFM-DOAS (v0.4) processing, vertical column averaging kernels, quality of the spectral fits, and a quan-titative comparison with global model simulations we refer toBuchwitz et al.(2004b). 10
An initial error analysis using simulated measurements is given inBuchwitz and
Bur-rows (2004). According to this error analysis errors of a few percent due to undetected cirrus clouds, aerosols, surface reflectivity, temperature and pressure profiles, etc., are to be expected. InBuchwitz et al.(2004b) it has been shown that the WFM-DOAS v0.4 CO2columns agree with model columns within a few percent. To compensate for a not 15
yet understood systematic underestimation the WFM-DOAS v0.4 CO2 columns have been scaled with a constant factor of 1.27 (seeBuchwitz et al.,2004b, for details). It has been shown that the spatial and temporal pattern of the retrieved column averaged mixing ratio is in reasonable agreement with the model data except for the amplitude of the variability. The measured variability is about a factor of four higher than the 20
variability of the model data (about 6% compared to about 1.5% for the model data). In the following we restrict the discussion to the comparison of three months of data with TM3 model simulations as shown in Fig.6. More results can be found inBuchwitz
et al. (2004b). TM3 3.8 (Heimann and K ¨orner,2003) is a three-dimensional global at-mospheric transport model for an arbitrary number of active or passive tracers. It uses 25
re-analyzed meteorological fields from the National Center for Environmental Predic-tion (NCEP) or from the ECMWF re-analysis. The modeled processes comprise tracer advection, vertical transport due to convective clouds and turbulent vertical transport
ACPD
5, 1943–1971, 2005 CO, CH4, and CO2 columns from SCIAMACHY M. Buchwitz et al. Title Page Abstract Introduction Conclusions References Tables Figures J I J I Back Close Full Screen / EscPrint Version Interactive Discussion
EGU
by diffusion. Available horizontal resolutions range from 8×10◦ to 1.1×1.1◦. In this case, TM3 was run with a resolution of 1.8×1.8◦ and 28 layers, and the meteorology fields were derived from the NCEP/DOE AMIP-II reanalysis. CO2source/sink fields for the ocean originate fromTakahaschi et al.(2002), for anthropogenic sources from the EDGAR 3.2 database and for the biosphere from the BIOME-BGC model. For SCIA-5
MACHY the averages have been computed using only the cloud free pixels with a CO2 retrieval error of less than 10%. Shown in Fig.6are only the data over land because of the problems with measuring over the ocean in the near-infrared (see Sect.5).
For SCIAMACHY Fig. 6 shows absolute column averaged mixing ratios of CO2 in the range 335–385 ppmv. For TM3 “uncalibrated” XCO2-offsets are shown which are 10
in the range 0–13.7 ppmv. These offsets do not include the (current) background con-centration of CO2. Therefore, not the absolute values but only the variability in space and time should be compared. The model simulations show low columns (compared to the mean column) over the northern hemisphere in July 2003 compared to higher values in May and September. This is mainly due to uptake of CO2 by the biosphere 15
which results in minimum columns around July. Qualitatively the SCIAMACHY data show a similar time dependence with also lower columns in July compared to May and September. This indicates that SCIAMACHY is able to detect the uptake of CO2 by the biosphere over the northern hemisphere when the vegetation is in its main growing season. The measured variability (±25 ppmv) is about a factor of 3–4 higher than the 20
variability of the model data (±7 ppmv).
Over large parts of the (mostly western) Sahara SCIAMACHY sees “plumes” of rel-atively high CO2(red colored areas) not present in the model simulations. These prob-ably a few percent too high CO2mixing ratios may result from the high surface reflec-tivity over the Sahara (probably in combination with aerosol variability). Currently, only 25
a constant surface albedo of 0.1 is assumed for WFM-DOAS (and only one aerosol scenario). According to the error analysis presented inBuchwitz and Burrows(2004) the error on the CO2 column is +1.4% if the albedo is 0.3 instead of 0.1 (for a solar zenith angle of 50◦). The corresponding error for O2 is −3.0%. The XCO2 error is to
ACPD
5, 1943–1971, 2005 CO, CH4, and CO2 columns from SCIAMACHY M. Buchwitz et al. Title Page Abstract Introduction Conclusions References Tables Figures J I J I Back Close Full Screen / EscPrint Version Interactive Discussion
EGU
a good approximation the difference of these errors, i.e., +4.4% or 16 ppmv. This indi-cates that the high values seen by SCIAMACHY over the Sahara may be explained by retrieval algorithm limitations as the current version does not take albedo (and aerosol) variations fully into account.
8. Conclusions
5
Nearly one year (2003) of SCIAMACHY nadir measurements have been processed with the WFM-DOAS retrieval algorithm (v0.4, for methane also v0.41) to generate a number of data products: vertical columns of CO, CH4, and CO2. In addition, O2 columns have been retrieved to compute dry air column averaged mixing ratios for the relatively well-mixed greenhouse gases CH4 and CO2, denoted XCH4and XCO2, 10
respectively. The data products have been compared with independent measurements (CO from MOPITT) and model simulations (for CH4and CO2).
For the CO columns the agreement with MOPITT is mostly within 30%. SCIAMACHY detects enhanced concentrations of CO due to biomass burning similar as MOPITT. SCIAMACHY seems to systematically overestimate the CO columns over large parts 15
of the southern hemisphere at least for certain months where MOPITT sees systemati-cally lower columns in the southern hemisphere compared to the northern hemisphere. This discrepancy is most probably related to the difficulty of accurately fitting the weak CO lines covered by SCIAMACHY. Investigations are ongoing on how to improve the precision and the accuracy of the CO retrieval. This includes using a larger fitting 20
window to cover more CO lines.
The WFM-DOAS Version 0.4 methane columns have a time dependent bias of up to about −15% related to ice build-up on the channel 8 detector. Using a simple bias correction an improved methane data product (v0.41) has been generated. The com-parison with model simulations shows agreement within a few percent. The compari-25
son indicates that SCIAMACHY can detect enhanced columns due to emissions from surface sources such as rice fields and wetlands over India, southeast Asia and central
ACPD
5, 1943–1971, 2005 CO, CH4, and CO2 columns from SCIAMACHY M. Buchwitz et al. Title Page Abstract Introduction Conclusions References Tables Figures J I J I Back Close Full Screen / EscPrint Version Interactive Discussion
EGU
Africa.
The WFM-DOAS Version 0.4 CO2columns show agreement with model simulations within a few percent. The comparison indicates that SCIAMACHY is able to detect low columns of CO2resulting from uptake of CO2over the northern hemisphere when the vegetation is in its main growing season. Over highly reflecting surfaces such as over 5
the Sahara SCIAMACHY seems to systematically overestimate the column averaged mixing ratio of CO2by a few percent most probably because of limitations of the current version of the retrieval algorithm.
A summary of our findings from the comparisons with independent data shown here and elsewhere (Buchwitz et al.,2004a,b;Gloudemans et al.,2004;de Maziere et al., 10
2004;Sussmann and Buchwitz,2005;Warneke et al.,2005) is given in Table1which
shows our current best estimates of precision and accuracy of our data products. Our future work will focus on identifying the reasons for the observed biases and to improve the accuracy of the data products. This will also comprise the use of larger spectral fitting windows, especially for CO, to improve the precision. So far only a small 15
subset of the large spectral region covered by SCIAMACHY has been analyzed.
Acknowledgements. We thank ESA and DLR for making available the SCIAMACHY Level 1
data. We thank the MOPITT teams at NASA and University of Toronto for the MOPITT Level 2 Version 3 data which have been obtained via the Langley DAAC. Funding for this study came from the German Ministry for Research and Education (BMBF) via DLR-Bonn and
GSF/PT-20
UKF, the European Commission (5th FP on Energy, Environment and Sustainable Develop-ment, Contract no. EVG1-CT-2002-00079, project EVERGREEN), and from the University and the State of Bremen. We acknowledge exchange of information within the European Commis-sion (EC) Network of Excellence ACCENT.
References 25
Bergamaschi, P., Hein, R., Heimann, M., and Crutzen, P. J.: Inverse modeling of the global CO
ACPD
5, 1943–1971, 2005 CO, CH4, and CO2 columns from SCIAMACHY M. Buchwitz et al. Title Page Abstract Introduction Conclusions References Tables Figures J I J I Back Close Full Screen / EscPrint Version Interactive Discussion
EGU
Bergamaschi, P., Krol, M., Dentener, F., Vermeulen, A., Meinhardt, F., Graul, R., Peters, W.,
and Dlugokencky, E. J.: Inverse modeling of national and European CH4 emissions using
the atmospheric zoom model TM5, Atmos. Chem. Phys. Discuss., 5, 1007–1066, 2005,
SRef-ID: 1680-7375/acpd/2005-5-1007. 1955
Bovensmann, H., Burrows, J. P., Buchwitz, M., Frerick, J., No ¨el, S., Rozanov, V. V., Chance, K.
5
V., and Goede, A.: SCIAMACHY – Mission Objectives and Measurement Modes, J. Atmos.
Sci., 56, 127–150, 1999. 1946
Bovensmann, H., Buchwitz, M., Frerick, J., Hoogeveen, R., Kleipool, Q., Lichtenberg, G., No ¨el, S., Richter, A., Rozanov, A., Rozanov, V. V., Skupin, J., von Savigny, C., Wuttke, M., and Burrows, J. P.: SCIAMACHY on ENVISAT: In-flight optical performance and first results, in:
10
Remote Sensing of Clouds and the Atmosphere VIII, edited by: Sch ¨afer, K. P., Com `eron, A.,
Carleer, M. R., and Picard, R. H., Proceedings of SPIE, 5235, 160–173, 2004. 1946,1947
Buchwitz, M. and Burrows, J. P.: Retrieval of CH4, CO, and CO2 total column amounts from
SCIA-MACHY nearinfrared nadir spectra: Retrieval algorithm and first results, in: Remote Sensing of Clouds and the Atmosphere VIII, edited by: Sch ¨afer, K. P., Com `eron, A., Carleer,
15
M. R., and Picard, R. H., Proceedings of SPIE, 5235, 375–388, 2004. 1950,1953,1955,
1957,1958
Buchwitz, M., de Beek, R., Bramstedt, K., No ¨el, S., Bovensmann, H., and Burrows, J. P.: Global carbon monoxide as retrieved from SCIAMACHY by WFM-DOAS, Atmos. Chem. Phys., 4, 1945–1960, 2004a,
20
SRef-ID: 1680-7324/acp/2004-4-1945. 1945,1948,1949,1950,1955,1960
Buchwitz, M., de Beek, R., Burrows, J. P., Bovensmann, H., Warneke, T., Notholt, J., Meirink, J. F., Goede, A. P. H., Bergamaschi, P., K ¨orner, S., Heimann, M., M ¨uller, J.-F., and Schulz, A.: Atmospheric methane and carbon dioxide from SCIAMACHY satellite data: Initial com-parison with chemistry and transport models, Atmos. Chem. Phys. Discuss., 4, 7217–7297,
25
2004b,
SRef-ID: 1680-7375/acpd/2004-4-7217. 1945,1948,1949,1953,1957,1960
Buchwitz, M., Rozanov, V. V., and Burrows, J. P.: A near infrared optimized DOAS method
for the fast global retrieval of atmospheric CH4, CO, CO2, H2O, and N2O total column
amounts from SCIAMACHY/ENVISAT-1 nadir radiances, J. Geophys. Res., 105, 15 231–
30
15 246, 2000a. 1948
Buchwitz, M., Rozanov, V. V., and Burrows, J. P.: A correlated-k distribution scheme for overlap-ping gases suitable for retrieval of atmospheric constituents from moderate resolution
ra-ACPD
5, 1943–1971, 2005 CO, CH4, and CO2 columns from SCIAMACHY M. Buchwitz et al. Title Page Abstract Introduction Conclusions References Tables Figures J I J I Back Close Full Screen / EscPrint Version Interactive Discussion
EGU
diance measurements in the visible/near-infrared spectral region, J. Geophys. Res., 105,
15 247–15 262, 2000b. 1948
Burrows, J. P., H ¨olzle, E., Goede, A. P. H., Visser H., and Fricke, W.: SCIAMACHY – Scanning Imaging Absorption Spectrometer for Atmospheric Chartography, Acta Astronautica, 35(7),
445–451, 1995. 1946
5
Deeter, M. N., Emmons, L. K., Francis, G. L., Edwards, D. P., Gille, J. C., Warner, J. X., Khat-tatov, B., Ziskin, D., Lamarque, J.-F., Ho, S.-P., Yuding, V., Attie, J.-L., Packman, D., Chen, J., Mao, D., and Drummond, J. R.: Operational carbon monoxide retrieval algorithm and
se-lected results for the MOPITT instrument, J. Geophys. Res., 108, 4399–4409, 2003. 1950
de Mazi `ere, M., Barret, B., Blumenstock, T., Buchwitz, M., de Beek, R., Demoulin, P., Fast, H.,
10
Gloudemans, A., Griesfeller, A., Griffith, D., Ionov, D., Janssens, K., Jones, N., Mahieu, E., Melleqvist, J., Mittermeier, R. L., Notholt, J., Rinsland, C., Schrijver, H., Schultz, A., Smale, D., Strandberg, A., Strong, K., Sussmann, R., Warneke, T., and Wood, S.: Comparison between SCIAMACHY scientific products and ground-based FTIR data for total columns of
CO, CH4, and N2O, in Proceedings of the Second Workshop on the Atmospheric Chemistry
15
Validation of ENVISAT (ACVE-2), ESA/ESRIN, Frascati, Italy, 3–7 May 2004, ESA SP-562
(on CD), 2004. 1945,1960
Emmons, L. K., Deeter, M. N., Gille, J. C., Edwards, D. P., Atti `e, J.-L., Warner, J., Ziskin, D., Francis, G., Khattatov, B., Yudin, V., Lamarque, J.-F., Ho, S.-P., Mao, D., Chen, J. S.,
Drum-mond, J., Novelli, P., Sachse, G., Coffey, M. T., Hannigan, J. W., Gerbig, C., Kawakami, S.,
20
Kondo, Y., Takegawa, N., Schlager, H., Baehr, J., and Ziereis, H.: Validation of Measure-ments of Pollution in the Troposphere (MOPITT) CO retrievals with aircraft in situ profiles, J.
Geophys. Res., 109, D03309, doi:10.1029/2003JD004101, 2004. 1950
Frankenberg, C., Platt, U., and Wagner, T.: Iterative maximum a posteriori (IMAP-)DOAS for
re-trieval of strongly absorbing trace gases: Model studies for CH4and CO2retrieval from
near-25
infrared spectra of SCIAMACHY onboard ENVISAT, Atmos. Chem. Phys., 5, 9–22, 2005,
SRef-ID: 1680-7324/acp/2005-5-9. 1946
Frankenberg, C., Platt, U., and Wagner, T.: Retrieval of CO from SCIAMACHY onboard EN-VISAT: Detection of strongly polluted areas and seasonal patterns in global CO abundances, Atmos. Chem. Phys. Discuss., 4, 8425–8438, 2004,
30
SRef-ID: 1680-7375/acpd/2004-4-8425. 1946
Gloudemans, A. M. S., Schrijver, H., Straume, A. G., Aben, I., Maurellis, A. N., Buchwitz, M.,
ACPD
5, 1943–1971, 2005 CO, CH4, and CO2 columns from SCIAMACHY M. Buchwitz et al. Title Page Abstract Introduction Conclusions References Tables Figures J I J I Back Close Full Screen / EscPrint Version Interactive Discussion
EGU
SCIAMACHY: Comparisons with TM3 and MOPITT, in: Proceedings of Second Workshop on the Atmospheric Chemistry Validation of ENVISAT (ACVE-2), ESA/ESRIN, Frascati, Italy,
3–7 May 2004, ESA SP-562 (on CD), 2004. 1946,1960
Heimann, M. and K ¨orner, S.: The Global Atmospheric Tracer Model TM3, Model Description and Users Manual Release 3.8a, No. 5, Max Planck Institute for Biogeochemistry
(MPI-5
BGC), Jena, Germany, 2003. 1957
Houweling, S., Breon, F.-M., Aben, I., R ¨odenbeck, C., Gloor, M., Heimann, M., and Ciais, P.:
Inverse modeling of CO2sources and sinks using satellite data: A synthetic inter-comparison
of measurement techniques and their performance as a function of space and time, Atmos. Chem. Phys., 4, 523–538, 2004,
10
SRef-ID: 1680-7324/acp/2004-4-523. 1945
Houweling, S., Kaminski, T., Dentener, F., Lelieveld, J., and Heimann, M.: Inverse modeling of methane sources and sinks using the adjoint of a global transport model, J. Geophys. Res.,
105(D21), 26 137–26 160, 1999. 1945
Krol, M. C., Houweling, S., Bregman, B., van den Broek, M., Segers, A., van Velthoven, P.,
Pe-15
ters, W., Dentener, F., and Bergamaschi, P.: The two-way nested global chemistry-transport zoom model TM5: Algorithm and applications, Atmos. Chem. Phys., 5, 417–432, 2005,
SRef-ID: 1680-7324/acp/2005-5-417. 1955
Rayner, P. J. and O’Brian, D. M.: The utility of remotely sensed CO2 concentration data in
surface inversions, Geophys. Res. Lett., 28, 175–178, 2001. 1945
20
Rothman, L. S., Barbe, A., Benner, D. C., Brown, L. R., Camy-Peyret, C., Carleer, M. R., Chance, K., Clerbaux, C., Dana, V., Devi, V. M., Fayt, A., Flaud, J. M., Gamache, R. R.,
Goldman, A., Jacquemart, D., Jucks, K. W., Lafferty, W. J., Mandin, J. Y., Massie, S. T.,
Nemtchinov, V., Newnham, D. A., Perrin, A., Rinsland, C. P., Schroeder, J., Smith, K. M., Smith, M. A. H., Tang, K., Toth, R. A., Vander Auwera, J., Varanasi, P., and Yoshino, K.: The
25
HITRAN molecular spectroscopic database: edition of 2000 including updates through 2001, J. Quant. Spectrosc. Radiat. Transfer, 82, 5–44, 2003.
Sussmann, R. and Buchwitz, M.: Validation of ENVISAT/SCIAMACHY columnar CO by FTIR profile retrievals at the ground truthing station Zugspitze, Atmos. Chem. Phys. Discuss., 5, 557–572, 2005,
30
SRef-ID: 1680-7375/acpd/2005-5-557. 1945,1960
Takahashi, T., Sutherland, S. C., Sweeney, C., Poisson, A., Metzl, N., Tilbrook, B., Bates,
ACPD
5, 1943–1971, 2005 CO, CH4, and CO2 columns from SCIAMACHY M. Buchwitz et al. Title Page Abstract Introduction Conclusions References Tables Figures J I J I Back Close Full Screen / EscPrint Version Interactive Discussion
EGU
flux based on climatological surface ocean pCO2, and seasonal biological and temperature
effects, Deep-Sea Res., 49, 1601–1622, 2002. 1958
Warneke, T., de Beek, R., Buchwitz, M., Notholt, J., Schulz, A., Velazco, V., and Schrems, O.:
Shipborne solar absorption measurements of CO2, CH4, N2O, and CO and comparison the
SCIAMACHY WFM-DOAS retrievals, Atmos. Chem. Phys. Discuss., 5, 847–862, 2005,
5
ACPD
5, 1943–1971, 2005 CO, CH4, and CO2 columns from SCIAMACHY M. Buchwitz et al. Title Page Abstract Introduction Conclusions References Tables Figures J I J I Back Close Full Screen / EscPrint Version Interactive Discussion
EGU
Table 1. Current estimates of precision and accuracy of the SCIAMACHY/WFM-DOAS vertical
column data products.
Gas Horizontal Estimated Estimated
resolution precision accuracy
[km2] (scatter) (bias) [%] [%] CO (v0.4) 30×120 10–20 10–30 (mostly positive) CH4(v0.4) 30×120 1–6 2–15 (mostly negative) CH4(v0.41) 30×120 1–4 2–5 CO2(v0.4) 30×60 1–4 2–5
ACPD
5, 1943–1971, 2005 CO, CH4, and CO2 columns from SCIAMACHY M. Buchwitz et al. Title Page Abstract Introduction Conclusions References Tables Figures J I J I Back Close Full Screen / EscPrint Version Interactive Discussion
EGU
Fig. 1. Number of orbits per day of the year 2003 processed by WFM-DOAS (blue lines). The
maximum number of orbits per day is about 14 (∼100%). The red shaded areas indicate the decontamination phases performed to get rid of the ice layer that grows on the near-infrared detectors of channels 7 and 8. Data gaps are due to decontamination but also due to other (mostly ground processing related) reasons.
ACPD
5, 1943–1971, 2005 CO, CH4, and CO2 columns from SCIAMACHY M. Buchwitz et al. Title Page Abstract Introduction Conclusions References Tables Figures J I J I Back Close Full Screen / EscPrint Version Interactive Discussion EGU a b CO SCIA/WFMD Apr 2003 < 1.20 1.40 1.60 1.80 2.00 2.20 2.40 2.60 2.80 3.00 3.20 > < 1.20 1.40 1.60 1.80 2.00 2.20 2.40 2.60 2.80 3.00 3.20 > VC [1018 /cm2 ] [email protected]−bremen.de WFMDv0.4/gridded/cldfree/err<60%/land CO MOPITT(land) Apr 2003 < 1.20 1.40 1.60 1.80 2.00 2.20 2.40 2.60 2.80 3.00 3.20 > < 1.20 1.40 1.60 1.80 2.00 2.20 2.40 2.60 2.80 3.00 3.20 > VC [1018 /cm2 ]
MOPITT data: HBremer@uni−bremen.de (plot: [email protected]−bremen.de)
c d CO SCIA/WFMD Aug 2003 < 1.20 1.40 1.60 1.80 2.00 2.20 2.40 2.60 2.80 3.00 3.20 > < 1.20 1.40 1.60 1.80 2.00 2.20 2.40 2.60 2.80 3.00 3.20 > VC [1018 /cm2 ] [email protected]−bremen.de WFMDv0.4/gridded/cldfree/err<60%/land CO MOPITT(land) Aug 2003 < 1.20 1.40 1.60 1.80 2.00 2.20 2.40 2.60 2.80 3.00 3.20 > < 1.20 1.40 1.60 1.80 2.00 2.20 2.40 2.60 2.80 3.00 3.20 > VC [1018 /cm2 ]
MOPITT data: HBremer@uni−bremen.de (plot: [email protected]−bremen.de)
e f CO SCIA/WFMD Sep 2003 < 1.20 1.40 1.60 1.80 2.00 2.20 2.40 2.60 2.80 3.00 3.20 > < 1.20 1.40 1.60 1.80 2.00 2.20 2.40 2.60 2.80 3.00 3.20 > VC [1018 /cm2 ] [email protected]−bremen.de WFMDv0.4/gridded/cldfree/err<60%/land CO MOPITT(land) Sep 2003 < 1.20 1.40 1.60 1.80 2.00 2.20 2.40 2.60 2.80 3.00 3.20 > < 1.20 1.40 1.60 1.80 2.00 2.20 2.40 2.60 2.80 3.00 3.20 > VC [1018 /cm2 ]
MOPITT data: HBremer@uni−bremen.de (plot: [email protected]−bremen.de)
Fig. 2. Monthly mean CO columns over land from SCIAMACHY/ENVISAT (left) and MOPITT/EOS-Terra (right). Only the columns over land are shown because the quality of the SCIAMACHY CO columns over water is low due to the low reflectivity of water in the near-infrared. For SCIAMACHY only data have been averaged where the CO fit error is less than 60% and where the PMD1 cloud identification algorithm indicates a cloud free pixel. For
MO-ACPD
5, 1943–1971, 2005 CO, CH4, and CO2 columns from SCIAMACHY M. Buchwitz et al. Title Page Abstract Introduction Conclusions References Tables Figures J I J I Back Close Full Screen / EscPrint Version Interactive Discussion
EGU
Fig. 3. The black diamonds show XCH4(v0.4) as measured by SCIAMACHY over the Sahara normalized by a constant reference value of 1750 ppbv as a function of day of the year 2003 (“methane bias curve”). The red diamonds (“Transmission (orig.)”) show independent measure-ments, namely the SCIAMACHY channel 8 transmission which changes due to the varying ice layer on the detector. This curve has been determined by averaging the signal of the solar measurements and normalizing it. The magenta (m) “Transmission (transformed)” curve has been obtained by a linear transformation of the red (r) curve, i.e., by computing m=A+B r. Applying the same coefficients A and B as used for the data before day 230 also to the data after day 230 results in the yellow curve which still shows an offset with respect to the black
methane bias curve. To get a better match, two sets of coefficients have been used, one for
the data before day 230 and another set for the data after day 230. The reason why different
coefficients are needed is most probably because the spatial distribution of the ice layer on the
ACPD
5, 1943–1971, 2005 CO, CH4, and CO2 columns from SCIAMACHY M. Buchwitz et al. Title Page Abstract Introduction Conclusions References Tables Figures J I J I Back Close Full Screen / EscPrint Version Interactive Discussion
EGU
a b
c d
Fig. 4. Column averaged mixing ratios of methane (XCH4) as measured by SCIAMACHY over land using WFM-DOAS v0.41 (left) compared to JRC/TM5 model data (right). For SCIAMACHY only the measurements from cloud free pixels have been averaged where the methane error is less than 10%. The model data have been averaged taking into account the daily sampling of the SCIAMACHY data. The model data have been scaled by a constant factor of 1.03 to
ACPD
5, 1943–1971, 2005 CO, CH4, and CO2 columns from SCIAMACHY M. Buchwitz et al. Title Page Abstract Introduction Conclusions References Tables Figures J I J I Back Close Full Screen / EscPrint Version Interactive Discussion
EGU
Fig. 5. Comparison of daily SCIAMACHY XCH4 measurements (versions 0.4, blue trian-gles, and 0.41, black diamonds) with TM5 model simulations. The top panel shows the bias (SCIAMACHY-model), the middle panel the standard deviation of the difference, and the bottom
ACPD
5, 1943–1971, 2005 CO, CH4, and CO2 columns from SCIAMACHY M. Buchwitz et al. Title Page Abstract Introduction Conclusions References Tables Figures J I J I Back Close Full Screen / EscPrint Version Interactive Discussion
EGU
Fig. 6. Comparison of SCIAMACHY XCO2(left) with TM3 model simulations (right). For
SCIA-MACHY all cloud free measurements over land have been averaged where the CO2 column
fit error is less than 10%. For TM3 monthly averaged XCO2-offsets are shown. These offsets
do not include the background concentration of CO2. Therefore, only the spatial and temporal
variability should be compared. Two different scales have been used, one for SCIAMACHY (±25 ppmv) and one for the model simulations (±6.85 ppmv), to consider the 3–4 times higher variability of the SCIAMACHY data compared to the model data.