Controlling Fluoride#Forming Reactions for Improved Rate
Capability in Lithium#Perfluorinated Gas Conversion Batteries
The MIT Faculty has made this article openly available. Please share how this access benefits you. Your story matters.
Citation Gao, Haining et al. “Controlling Fluoride#Forming Reactions for
Improved Rate Capability in Lithium#Perfluorinated Gas Conversion Batteries.” Advanced Energy Materials, 9, 21 (April 2019): 1900393 © 2019 The Author(s)
As Published 10.1002/AENM.201900393
Publisher Wiley
Version Author's final manuscript
Citable link https://hdl.handle.net/1721.1/127778
Terms of Use Creative Commons Attribution-Noncommercial-Share Alike
1
Controlling Fluoride-Forming Reactions for Improved Rate Capability in Lithium-Perfluorinated Gas Conversion Batteries
Haining Gao, Yuanda Li, Rui Guo and Betar M. Gallant* Y. Li, R. Guo, Prof. B. M. Gallant
Department of Mechanical Engineering, Massachusetts Institute of Technology, 77 Massachusetts Avenue, Cambridge, Massachusetts 02139, United States
E-mail: [email protected]
H. Gao
Department of Materials Science and Engineering, Massachusetts Institute of Technology, 77 Massachusetts Avenue, Cambridge, Massachusetts 02139, United States
Keywords: lithium-gas battery, gas conversion, lithium fluoride, anion receptor, rate capability
Nonaqueous metal-gas batteries based on halogenated reactants exhibit strong potential for future
high-energy electrochemical systems. The lithium-sulfur hexafluoride (Li-SF6) primary battery,
which utilizes a safe, noncombustible, energy-dense gas as cathode, demonstrates attractive
eight-electron transfer reduction during discharge and high attainable capacities (> 3000 mAh/gcarbon) at
voltages above 2.2 VLi. However, improved rate capability is needed for practical applications.
Here, we report two viable strategies to achieve this by targeting the solubility of the passivating
discharge product, lithium fluoride (LiF). Operating at moderately elevated temperatures, e.g.
50 °C, in DMSO dramatically improves LiF solubility and promotes sparser and larger LiF nuclei
on gas diffusion layer (GDL) electrodes, leading to capacity improvements of ~10x at 120 µA cm
-2. More aggressive chemical modification of the electrolyte by including a
tris(pentafluorophenyl)borane (TPFPB) anion receptor further promotes LiF solubilization; capacity increased even at room temperature by a factor of 25 at 120 μA cm-2, with attainable
capacities up to 3 mAh cm-2. This work shows that bulk fluoride-forming conversion reactions can
be strongly manipulated by tuning the electrolyte environment to be solvating towards F-, and that
2
1. Introduction
Continued demand for high-energy-density electrochemical power systems has drawn
increasing attention to conversion-based systems,[1] especially nonaqueous Li-gas batteries, which
have theoretical energy densities substantially higher (>5x) than Li-ion batteries.[2] While the
majority of attention has focused on the Li-oxygen (Li-O2) system due to its attractive energy
density (3450 Wh kgtheoretical-1, based on the weight of Li and O2), improving rate capability,[3] and
an earlier hope that it might be made rechargeable with continued development, significant
challenges persist.[4] Among these are impermissibly high overpotentials required on charge (> 1
V), even when catalysts are employed, and pervasive side reactions, which together limit the
electrochemical and chemical reversibility of the battery.
In light of these challenges, researchers have pursued two paths. The first of these has been
to investigate alternatives to the Li anode for use with O2 cathodes, for example sodium (Na)[5] and
potassium (K)[6], due to the improved reversibility of their formed alkali oxides on charge.[7]
However, replacing Li with Na or K substantially lowers the cell energy density, a main attraction
of the O2-based system in the first place. An alternative approach has focused instead on
development of different types of gas cathodes that are inspired by the Li-O2 system, yet are suited
for a broader set of applications. Examples include oxide gases such as SO2, which is currently a
primary battery chemistry but exhibits potential to be made rechargeable;[8] CO2-based batteries
that attempt to extract end-of-life value from CO2 while sequestering it in an electrochemical
device;[9]or fluoride gases such as sulfur hexafluoride (SF6) or nitrogen trifluoride (NF3) for use in
primary batteries, the latter of which have been developed recently in our group.[10] Although such
systems may not be suited a priori for reversible energy storage, exploring new chemistries
provides significant opportunity to develop new classes of high-capacity, high-energy conversion
3
or rechargeable batteries. In particular, perfluorinated gases, which are energy-dense, are typically
stable or even inert in the reactant state,[11] and therefore offer additional advantages in terms of
safety and storage compared to O2, e.g. for military or space applications. Thus, “beyond Li-O2”
batteries provide flexibility to the metal-gas family while filling in gaps in energy-power metrics
for broader applications.
Developing higher-energy electrochemical systems can be achieved by identifying
high-potential or high-capacity reactions, or ideally both. Identifying new reaction with high capacities
is non-trivial, given the inherent limitations in transition-metal redox (typically 1 e-/transition metal
for conventional intercalation cathodes), or in oxygen molecular redox (typically a one- or two-
electron transfer reaction at room temperature).[12]Although a 4-electron reaction has very recently
been achieved in Li-O2 system in molten salt-based electrolytes, higher temperatures (150 °C) were
required.[13] In contrast, halogenated molecules, with a highly-oxidized central atoms such as
carbon (e.g. CF4), nitrogen (NF3) or sulfur (SF6), open up new opportunities in the design of
lower-temperature multi-electron transfer reactions. High (ne->2) electron transfer numbers can be
theoretically proposed, and scale proportionally with the number of fluoride ligands. The discharge
reactions result in ligand abstraction and reaction with alkali metal ions, with concurrent reduction
of the central atom to a neutral or reduced state. Recently, we demonstrated that the full reductions
of two perfluorinated gases, NF3 (to N2(g) and LiF, nitrogen oxidation state change of 3) and SF6
(to Li2S/S and LiF, sulfur oxidation state change of 6 to 8), can be realized in Li-based cells, and
illuminated their discharge reaction mechanisms on carbon electrodes at room temperature.[10]
While high capacities were achieved (e.g., ~3600 mAh gC-1 at 75 mA gC-1 for SF6), roughly
comparable in scale to the Li-O2 system on similar Vulcan carbon cathode materials (~3000 mAh
gC-1 at ~100 mA gC-1),[14] the discharge potentials were several hundred millivolts lower than typical
4
exhibited poor rate capability. Thus, the future attractiveness of such systems depends on the ability
to improve the attainable energy density and increase the performance at higher currents. In this
work, we demonstrate that such improvements are possible.
One of the major challenges currently limiting the attainable energy density in metal-gas
systems in general is the eventual passivation of the electrode surface due to buildup of insulating
solids. In the Li-O2 system, premature “sudden death” is mainly caused by coverage of active
surfaces by Li2O2, an electronic insulator.[15] Therefore, to enable higher capacities, a central
strategy has been to increase the solubility of the reduction intermediate, the superoxide radical
anion O2-. This can be achieved intrinsically, either by utilizing electrolyte solvents with high
Guttman donor number (DN)[16] and/or acceptor number (AN);[17] or through incorporation of
chemically-specific additives such as redox mediators,[18] solution aggregation promotors such as
molecular sieves,[19] or electrode functionalities that promote solution-phase Li2O2 growth.[20]
Notably, such strategies are not unique to metal-gas systems, and have been employed as well in
solid-solid conversion reactions, for instance to mediate the passivating effects of bulk LiF
formation in Li-CFx batteries. Strategies, including optimizing electrolyte solvents (for example
using dimethyl sulfoxide (DMSO)),[21] and incorporating electrolyte additives (such as anion
receptors),[22] has been applied to improve the Li-CFx battery performance significantly by
promoting fluoride solvation.
In Li-fluorinated gas systems, a similar “sudden death” phenomenon occurs, caused by the
buildup and eventual passivation of LiF. Whereas both SF6 and NF3 reduction reactions were found
to exhibit high overpotentials (> 1 V) on discharge due to the difficulty of the first electron-coupled
activation and fluoride expulsion step,[10] the capacity was also dramatically curtailed at only
moderate current densities (~100 mA gC-1), which represented the more severe contribution to poor
5
the latter point, using the SF6 conversion reaction as a model fluoride-forming system. The nominal
cell discharge reactions are
Anode: 8Li → 8𝑒−+ 8Li+
Cathode: SF6+ 8𝑒−+ 8Li+ → 6LiF + Li2S
Cell reaction: SF6+ 8Li → 6LiF + Li2S , E°= 3.69 V vs. Li/Li+
with a theoretical energy density of 3922 Wh kg-1. In practice, a mix of Li2S, S, and reduced
polysulfides were found after discharge, reflecting impartial reduction of some sulfur species prior
to their dissolution and/or electrochemical isolation in the electrode.[10a] Regardless, LiF was by far
the majority product, formed at a 6-fold higher rate than sulfur-derived products, and thus is the
species that we target for capacity improvements in the present study.
Herein, we report three strategies to improve the rate capability of Li-SF6 batteries by
modifying the electrolyte solvent and reaction conditions to promote LiF solubility. First, we
explored the discharge performance of SF6 in Li cells in a wide range of commonly-utilized battery
solvents to identify trends that support high capacity. We find that DMSO with both a high DN and
acceptor number (AN), showed good LiF solubility as well as stability against polysulfide species,
in contrast to carbonates and ether-based solvents, both of which yield substantially lower
capacities. Utilizing room-temperature DMSO cells as a benchmark, we investigated the Li-SF6
discharge behavior at elevated temperatures of 50 °C to better understand the sensitivity of kinetics
and/or solubility to thermal activation. Finally, we investigate the prospect of incorporating a
commonly-utilized anion receptor, tris(pentafluorophenyl)borane (TPFPB), to promote LiF
solubilization at high discharge rates. With TPFPB, a more than 25-fold increase in capacity can be achieved at high currents of 120 μA cm-2.
6
We hypothesized that, analogous to Li-O2 systems, the electrolyte solvent might influence
the solubility of SF6 reduction intermediates (lower fluorides of SF6, F-, or LiF) and thus the growth
of LiF crystallites during discharge. To investigate this, the discharge behavior of Li-SF6 cells was
first examined in six typical solvents: DMSO, N,N-dimethylacetamide (DMA), diethylene glycol
dimethyl ether (diglyme), tetraethylene glycol dimethyl ether (TEGDME), ethylene
carbonate/diethyl carbonate (EC/DEC), and propylene carbonate (PC). Lithium perchlorate
(LiClO4) was chosen as the salt to avoid a possible additional fluoride source. To avoid possible
reaction between Li and electrolyte solvents, Li metal was stabilized in PC electrolyte before being
used as the anode.[23] Trends were first examined on porous Vulcan carbon (VC, ~100 m2 g-1)[24]
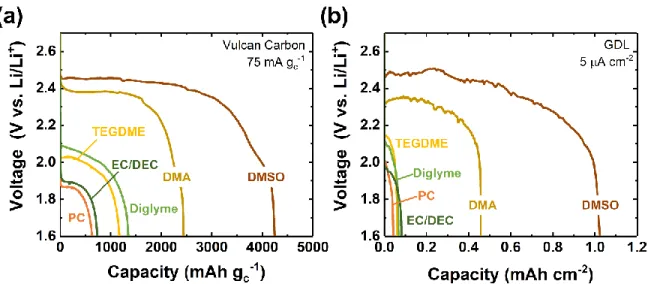
electrodes, comparable to those used previously. As shown in Figure 1, the solvent had a strong
effect on the discharge behavior. At 75 mA gC-1, the carbonates PC and EC/DEC exhibited limited
capacities of 630 and 735 mAh gC-1, respectively, and had low voltage plateaus of ~1.9 V vs. Li/Li+
(Figure 1a). These relatively low capacities can be attributed in part to the known reactivity of
polysulfides with carbonate-based electrolytes, which likely forms passivating decomposition
products on the electrode.[25] Meanwhile, ether-based electrolytes yielded significantly higher
capacities (~1345 mAh gC-1 for diglyme and ~1170 mAh gC-1 for TEGDME), and the discharge
voltages were also found to be approximately 100 mV higher, at ~2.0 – 2.1 V vs. Li/Li+. A more
dramatic improvement in both capacity and voltage was observed with both DMA (2445 mAh gC -1 at ~2.40 V vs. Li/Li+) and DMSO (4250 mAh g
C-1 at ~2.45 V vs. Li/Li+). This trend was also
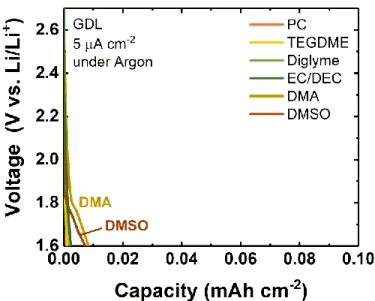
well-reproduced on gas diffusion layer (GDL) electrodes discharged at comparable low rates of 5 μA cm-2 (Figure 1b; all corresponding argon backgrounds exhibited negligible capacity, Figure
S1). Although GDL has relatively low surface area (~1 m2 g-1)[5a] and is not optimized for practical
batteries, in this study, GDL is valuable for standardizing the electrode porosity and surface area
7
morphology (discussed later in the text). Thus, GDL electrodes are utilized (unless otherwise noted)
in the remainder of the study.
Figure 1. Galvanostatic discharge profiles of Li-SF6 cells in various solvents, as
indicated, with a lower cutoff voltage of 1.6 V vs Li/Li+ on (a) Vulcan carbon or (b) gas diffusion layer (GDL) cathodes. Electrolytes contained 0.1 M LiClO4 (TEGDME,
DMSO, EC/DEC, PC and DMA) or 0.07 M LiClO4 (diglyme). For GDL electrodes,
capacity and current density are normalized to the GDL geometric area.
We considered three parameters to explain the performance trends of the solvents studied
herein: LiF solubility; solvent acceptor number (AN); and donor number (DN). However, as LiF is
only slightly soluble in water (1.33 g L-1 at 291 K),[26] and is considered virtually insoluble in
organic solvents,[27] the solubility in organic electrolytes has not been consistently reported
(although it is known to be higher in DMSO, 0.37 g L-1,[28] compared to e.g. PC or DEC; see Table
S1). Meanwhile, whereas LiF solubility is descriptive of the intrinsic ability of a solvent to stabilize
both F- and Li+, donor and acceptor number reflect the individual strength of solvent interaction
with Lewis acids (e.g. Li+) or bases (e.g. F-), respectively. Although the elemental electrochemical
steps of SF6 reduction are not currently known, SF6 has been reported to decompose by rapid
fluoride ion rejection[29] and our previous study of the perfluorinated gas analogue, NF
3, showed
electron-coupled fluoride expulsion to be the likely conversion mechanism.[10b] Thus, it is probable that “lone” metastable F- may be generated during discharge, with finite lifetimes in the electrolyte
8
before complexation with Li+ and subsequent precipitation. Indeed, a strong correlation between
DN and total achievable capacity was observed: ethers, having relatively low DN (16 for TEGDME
and 18 for diglyme),[30] showed lower SF6 discharge capacity, whereas DMSO (DN = 29.8) and
DMA (DN = 27.8)[30b] delivered the highest. For solvents with comparable DN, higher AN (DMA
= 13.6, DMSO = 19.3)[30b] also supported higher capacity. Such trends are similar to those observed
in Li-O2 batteries, where high DN solvents such as DMSO promote solution-phase growth of Li2O2
by strongly solvating Li+ and limiting its rate of reaction with superoxide.[31] Thus, we conclude
that similar effects govern the growth of LiF and lead to higher capacities in the SF6 system. Higher
DN solvents have also been reported to increase polysulfide solubility in Li-sulfur batteries, which
may aid here as a secondary effect against S/Li2S passivation.[32] As DN and AN are more widely
reported and experimentally accessible than LiF bulk solubility, these metrics may aide in future
prediction of additional solvents that support high-capacity SF6 discharge.
Comparisons of discharged electrodes were made to investigate whether the solvent
modulated the discharge product morphology. Figure 2a shows scanning electron microscopy
(SEM) images of cathodes discharged to a limited capacity of 0.05 mAh cm-2, which is low enough
to be reached in all solvents, at 5 μA cm-2. X-ray diffraction (XRD) performed on electrodes
discharged in all five solvents (Figure S2) confirmed that LiF was the only detectable crystalline
product, and therefore, in the following, we interpret the morphologies as being predominantly
reflective of LiF. From the images, it is evident that the cathodes for solvents that exhibit low
discharge capacity, i.e. rapid electrode passivation (EC/DEC, PC, diglyme, and TEGDME),
generally showed uniform LiF coverage consisting of many small LiF particles. In contrast, the
cathode in high DN solvents (DMSO and DMA) exhibited sparser particles with more available
carbon surface area, consistent with the ability to continue discharge to much higher capacities.
9
trend of increasing particle size with achievable discharge capacity is observed, which reflects the
ability to form more microscopically three-dimensional and thus less passivating particles in DMA
and DMSO. DMSO, which gave the highest capacity, showed significantly larger average particle
size (~90 nm) compared to all others (< 40 nm). Overall, it is evident that the LiF nuclei at low
capacity vary dramatically in different solvents, and their nanoscale morphologies underlie the
ability to undergo continued discharge to high capacities. Given the apparently unique ability of
DMSO to promote high capacities, we select it as the solvent for continued study.
Figure 2. (a) SEM images of cathodes discharged to a limited capacity of 0.05 mAh at
5 μA cm-2 in PC, EC/DEC, TEGDME, DMA, diglyme, and DMSO electrolyte. (b)
Total achievable discharge capacity (from Figure 1b) as a function of average particle size observed by SEM in different solvents at limited capacity (0.05 mAh cm-2). Average and error bars reflect statistics over at least 20 particles.
The rate capability at full capacity was next investigated in DMSO on GDL over a range of
current densities, as shown in Figure 3a. Between 5 and 120 μA cm-2, the discharge capacity
decreased by almost an order of magnitude, from approximately 1.0 to 0.1 mAh cm-2, and was
accompanied by a decrease in discharge potential of around 0.4 V, from 2.5 to 2.1 V vs. Li/Li+.
The high sensitivity of voltage to discharge rate is comparable with other metal-gas batteries
discharged on non-catalyzed carbon electrodes.[33] To confirm that the capacity was limited by LiF
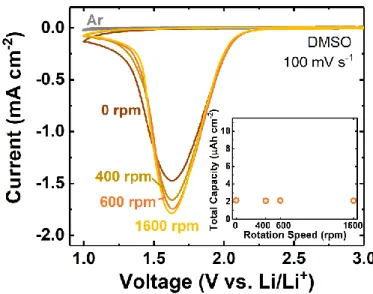
passivation and not transport in DMSO, Rotating Disk Electrode (RDE) measurements were
10
(Figure S3). Even at a rotation speed of 1600 rpm, limiting current behavior could not be reached
under cyclic voltammetry conditions at 100 mV s-1, and a comparable total reduction capacity of 2.1 μAh cm-2 was obtained in all cases regardless of rotation rate, due to rapid passivation once the
onset of SF6 reduction began. Negligible anodic current was detected on the forward scan,
indicating the non-rechargeability of the Li-SF6 system, in agreement with that observed in our
previous study.[10a] Furthermore, significant impedance increase detected during discharge (Figure
S4a) also provided evidence for electrode passivation. We therefore concluded that the reactions
under given electrochemical conditions (galvanostatic or cyclic voltammetry) are always limited
by LiF passivation, even though higher capacities are achievable in DMSO compared to other
11
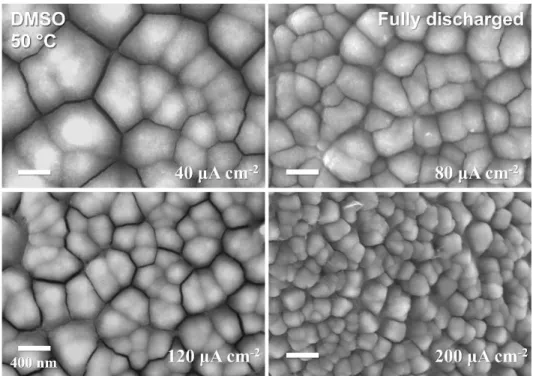
Figure 3. (a) Galvanostatic discharge profiles of Li-SF6 cells in DMSO electrolyte at
current densities of 5, 20, 40, 80 and 120 μA cm-2. SEM image of cathodes discharged
to (b) 0.1 mAh cm-2 and (c) fully discharged at different current densities (as indicated) in DMSO.
The structure of the LiF particles, in addition to being solvent-dependent, was also highly
rate-dependent. Limited-capacity morphologies at 0.1 mAh cm-2 are shown in Figure 3b for current densities up to 120 μA cm-2. At low rates of 5 μA cm-2, sparser and rounder nuclei (~110 nm) were
observed at 0.1 mAh cm-2; these gradually became more cube-shaped and smaller (~60 nm) at
increasing current densities. At an intermediate current density of 20 μA cm-2, a mix of spheres and
cubes was seen, indicating a transition between the two morphologies. These distinct morphologies
were retained up to full discharge capacities (Figure 3c). We note that similar results were observed
12
full capacity (Figure S5). However, the LiF particles were smaller in DMA than in DMSO,
consistent with a larger population of active nuclei and more rapid passivation in DMA.
Given the central role of the spherical LiF deposits in supporting higher capacities, we
investigated whether thermal effects can promote enhanced formation of this desired morphology.
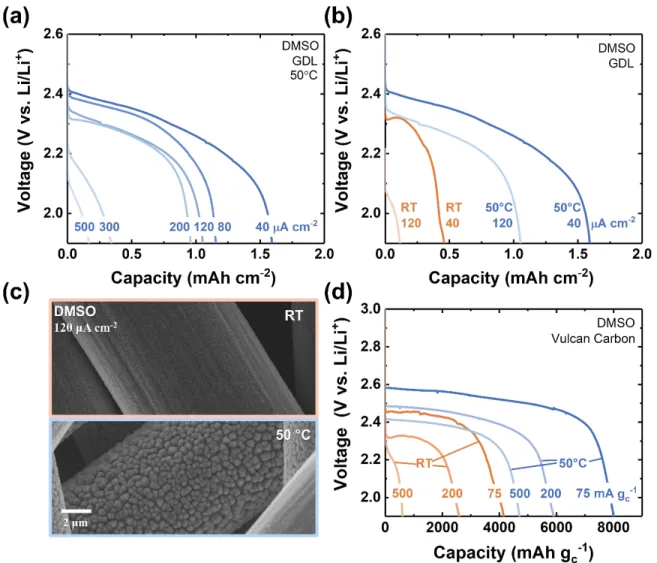
Discharge performance of Li-SF6 cells was evaluated at a moderately higher temperature of 50 °C,
as shown in Figure 4a, for current densities ranging from 40 to 500 μA cm-2. We confirmed that
the higher temperature did not modify the background currents under argon, as indicated in Figure
S6. The corresponding rate capability of Li-SF6 cells with DMSO electrolyte at room temperature
(RT) and 50 °C are compared in Figure 4b. At a relatively low current density of 40 μA cm-2, the
discharge capacity at 50 °C reached 1.8 mAh cm-2, more than four times higher than the capacity
observed at room temperature (~0.4 mAh cm-2). Meanwhile, at a higher current density of 120 μA
cm-2, whereas severe performance loss was already observed under room temperature conditions
(discharge voltage < 2.1 V vs. Li/Li+ and only ~ 0.1 mAh cm-2), at 50 °C the cell could retain a
capacity above 1.0 mAh cm-2 and a voltage of 2.3 V. Severe performance loss was only observed
at rates higher than 300 μA cm-2. Note that a trend of increasing temperature yielding higher
capacity and potential was also previously observed in Li-O2 and Li-NF3 batteries.[10b, 34] In the
Li-SF6 system, the improvement at higher temperature is related both to increased solubility of LiF
and, to likely lesser effect, lithium sulfide or polysulfide, as indicated by the modified morphologies;
but also to improved kinetics, as reflected in the higher average discharge potentials. These higher
voltages achieved at elevated temperature help to support the selective activation of fewer
nucleation sites while promoting their growth to substantially larger sizes (~350 nm, compared to
~50 nm at room temperature; Figure 4c and Figure S7). A temperature increase from 25 °C to
13
g L-1 to 0.60 g L-1, in DMSO,[28] in agreement with the electrochemical and morphological results
observed here.
Figure 4. Li-SF6 cells at 50 °C. (a) Galvanostatic discharge profile of Li-SF6 cells in
0.1 M LiClO4/DMSO electrolyte with GDL electrodes at current densities from 40 to
500 μA cm-2 (lower voltage cutoff of 1.9 V vs Li/Li+). (b) Comparasion of discharge
profiles at 50 °C and room temperature (RT) at current densities of 40 and 120 μA cm -2. (c) SEM image of a GDL cathode fully discharged at 120 μA cm-2 at 50 °C (lower)
and RT (upper). (d) Discharge profile of Li-SF6 cells in DMSO electrolyte with Vulcan
carbon electrodes at 75, 200 and 500 mA gC-1 at RT and 50 °C.
Figure 4d shows that these substantial performance gains, obtained on GDL, could also be
translated to the more practical Vulcan carbon electrodes. A nearly two-fold increase in capacity
(~ 8000 mAh gC-1 at 50 °C), as well as a ~0.1 V increase in discharge potential (from less than 2.5
14
remained greater than ~4500 mAh gC-1 at 500 mA gC-1. Overall, the results indicate that moderate
temperature increases can dramatically alter the LiF nucleation and growth process, resulting in
sizeable gains in performance and enabling high-rate performance. However, LiF passivation is
still ultimately the limiting factor, which is supported by the SEM images at full discharge along
with electrochemical impedance measurements, which show significantly larger resistances as
depth of discharge increased (Figure S4b). Thus, we next investigated an additional strategy to
further improve the capacity at room temperature based on chemically-specific promotion of LiF
solubility.
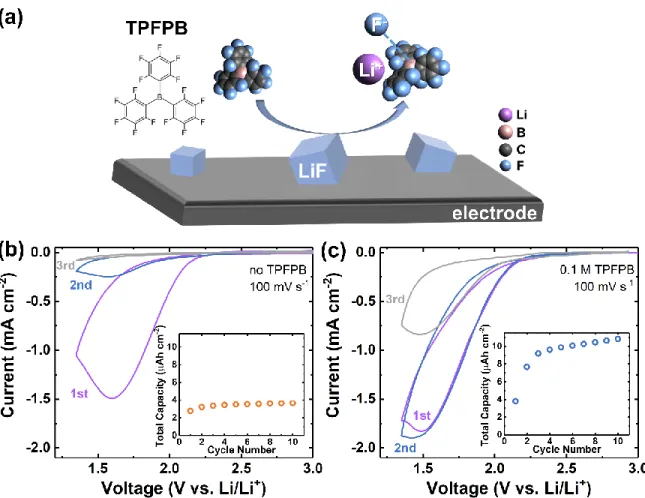
Tris(pentafluorophenyl)borane (TPFPB), with a molecular structure as shown in Figure
5a,[35] is among the family of borate-based anion receptors that contain electron-deficient Lewis
acid centers effective for binding F- and promoting LiF solubilization.[36]Thus, it has been used
previously as an additive in Li-ion batteries at low concentrations (typically < 0.1 M) to increase
the solubility of LiF formed from parasitic decomposition of fluorine-containing electrolyte salts,[37]
or to promote silicon[38] or graphite[39] anode stability. More recently, TPFPB has been used in
Li-O2 batteries to catalyze superoxide disproportionation.[40] However, to the best of our knowledge,
TPFPB has not been used previously in large concentrations as a participant in a bulk
forming reaction. Thus, we began by exploring the feasibility of using TPFPB at the high
fluoride-forming rates in Li-SF6 systems. To do so, passivation was initially exacerbated by using the
low-surface area, “planar” GC electrode in the RDE configuration, where passivation effects can be
15
Figure 5. (a) Schematic depicting the anion receptor, TPFPB, which promotes LiF
solvation by forming a complex with F- anions. Cyclic voltammetry traces and the total capacity (inset) of SF6-saturated electrolyte containing (b) 0.1 M LiClO4/DMSO, and
(c) 0.1 M TPFPB with 0.1 M LiClO4/DMSO at a scan rate of 100 mV s-1.
Figure 5b,c shows the first three CV scans in DMSO electrolyte at a fast scan rate of 100
mV s-1, without and with TPFPB additive at a concentration of 0.1 M. Note that when TPFPB was
used, the lower voltage cutoff was set as 1.35 V vs. Li/Li+ (instead of 1.0 V vs. Li/Li+, as in Figure
S3) to avoid parasitic reduction of TPFPB, which was found to be significant below ~1.3 V vs.
Li/Li+ (Figure S8). Without TPFPB (Figure 5b), the carbon electrode was nearly passivated on
the second scan, and the integrated reduction capacity (figure inset) reached a rapid plateau after
the 2nd cycle, at < 4 µAh cm-2. With TPFPB present, however, the peak current reached on the first
scan was modestly higher (~1.9 mA cm-2 vs. ~1.5 mA cm-2) and nearly comparable currents were
16
becoming more predominant. Consequently, the integrated reduction capacity (figure inset, Figure
5c) increased rapidly and reached a higher steady-state value greater than 10 µAh cm-2. Note that
these gains were achieved at a relatively high scan rate of 100 mV s-1, and are expected to be even
more pronounced at lower rates. Thus, having established the feasibility of using TPFPB to dissolve
passivation-scale amounts of LiF during SF6 reduction, we further investigated its effect under
more practical galvanostatic conditions in Swagelok cells with GDL electrodes.
The capacity of Li-SF6 cells was found to depend sensitively on the concentration of
TPFPB. Cells were characterized at a typical current density of 40 μA cm-2, which correponds to
an intermediate F- generation rate (assuming 8 e-/SF6) of 4.7×10⁻¹⁰ mol s-1 or 3.1 μM s-1 (based on
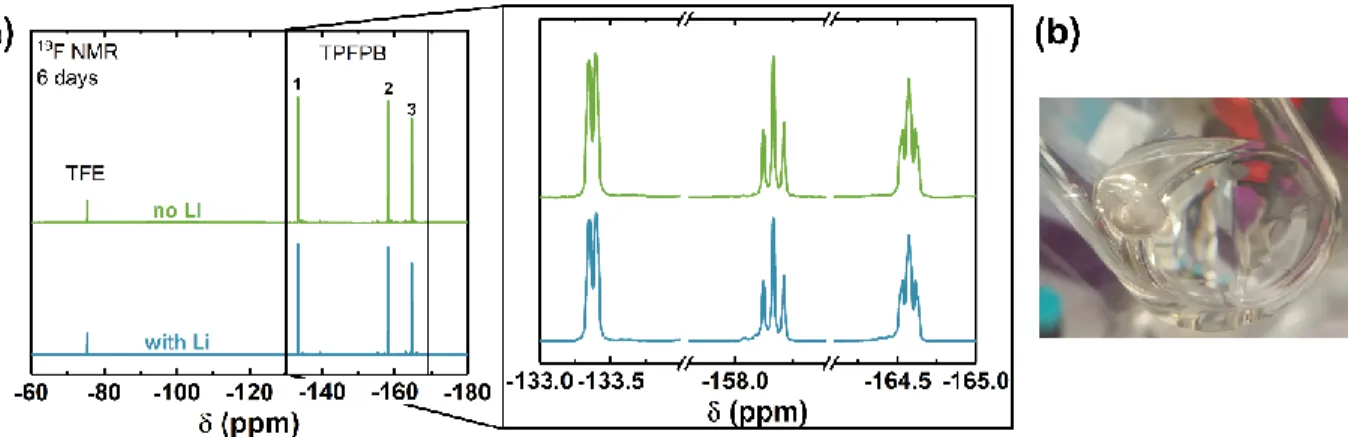
the electrolyte volume of 150 μL). Prior to discharge experiments, we confirmed that the Li,
pre-stabilized by soaking in PC electrolyte, was chemically stable against TPFPB by performing 19F
NMR analysis of electrolytes in contact with Li over long soaking times (six days), which indicated
negligible reactivity and no loss of TPFPB (Figure S9 and Table S2). As shown in Figure 6a, the
attainable capacity scaled monotonically with TPFPB concentration up to 3.0 mAh cm-2 at 400 mM,
indicating the strong contribution from TPFPB in solubilizing LiF (discharge under argon
headspace with TPFPB yielded negligible capacity, Figure S10). Meanwhile, higher TPFPB
concentrations yielded slightly lower discharge potentials (by ~50 mV) at 400 mM, due to increased
viscosity at higher concentrations. The capacity improvement, defined as the difference with and
without TPFPB at each current density, was calculated and compared to the theoretical capacity
gain assuming that each TPFPB molecule dissolves only one molecule of LiF, as might be expected
if the TPFPB becomes saturated after reaction (see SI for calculation details). As shown in Figure
6b, the actual capacity gain is significantly larger than this theoretical value at all currents. This
greater-than-predicted capacity improvement suggests that some amount of F- turnover occurs, or
17
its deposition in more energy-favorable sites via a solution-precipitation route that frees TPFPB for
solubilization of additional LiF. Assuming this mechanism, the turnover rate of TPFPB at
concentrations of 50, 200 and 400 mM could be calculated as 5.1, 2.2 and 1.6, respectively. This
indicates that the gains in capacity decreased with increasing TPFPB concentration, especially at
higher concentrations of 200 and 400 mM, where viscosity was significant and may have impeded
precipitation and turnover of TPFPB. We note that higher viscosity was also reflected in impedance
measurements, which indicated an order-of-magnitude increase in charge-transfer resistance when
400 mM TPFPB was added to the electrolyte (Figure S4c, compared with Figure S4a). We note
that the major crystalline discharge product in the discharged cathodes spanning the range of
additive concentrations used was confirmed to still be LiF, as indicated by XRD (Figure 6c).
Consistent with the above picture, the LiF formed in the presence of TPFPB was substantially more
three-dimensional and porous compared to the TPFPB-free case, as revealed in SEM images
(Figure 6d). At higher concentrations of 400 mM, the particles were still three-dimensional in
appearance, yet had smaller diameters than at 50 or 200 mM. We again attribute this to the high
viscosity at 400 mM, which may limit transport of bulky TPFPB from the electrode surface,
resulting in more rapid precipitation and smaller LiF particle growth. Interestingly, the inclusion
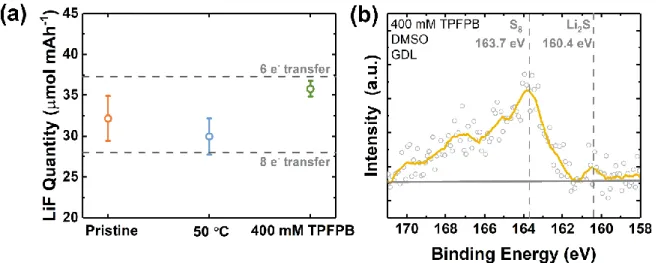
of TPFPB appeared to alter the discharge state of sulfur, which was predominantly present in
reduced form in previous work.[10a] Through quantitative 19F NMR analysis, the total amount of
fluoride formed can be compared with that expected, based on either a 6- or 8-electron transfer
reaction (Figure S11a). Whereas both room-temperature and 50 °C discharge in DMSO
quantitatively produced LiF consistent with a predominantly 8-electron transfer reaction, slightly
higher amounts of LiF were present with TPFPB with respect to the number of electrons transferred,
corresponding to a ~6-electron process. This could be confirmed by X-ray photoelectron
18
S-containins species present in the electrode, in contrast to our previous work.[10a] The detailed
elementary reaction steps require future efforts to elucidate in full and a future study is planned
dedicated to the influence of electrolyte on sulfur redox processes near the end of discharge.
Figure 6. (a) Galvanostatic discharge profiles of Li-SF6 cells at 40 μA cm-2. The
electrolyte was 0.1 M LiClO4/DMSO containing 0, 50, 200 or 400 mM TPFPB. (b)
Theoretical (dashed line) and observed (circles) average capacity gain at the corresponding TPFPB concentration. The averages and error bars represent statistics from more than three samples for each condition. (c) XRD pattern of the pristine GDL and cathodes fully discharged in electrolyte containing 50 and 400 mM TPFPB at 40 μA cm-2. (d) SEM images of cathodes fully discharged at 40 μA cm-2 in DMSO
electrolyte with different TPFPB concentrations (as indicated).
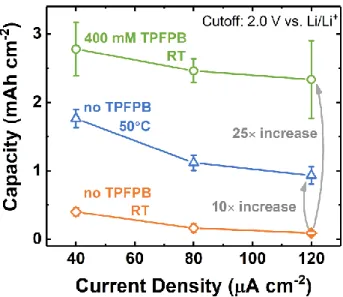
The rate capability improvements attainable with 400 mM TPFPB from 40 – 120 µA cm-2
are summarized and compared with the other two systems in this work. The individual rate
19
Figure 7, at moderate rates (40 μA cm-2), higher temperature increased the discharge capacity by
approximately five-fold, from 0.4 to 1.8 mAh cm-2. Meanwhile, TPFPB increased the capacity by
a factor of seven (to 2.8 mAh cm-2). The capacity gains were even larger at higher currents. For
example, at 120 μA cm-2, the capacity increased by an order of magnitude by elevating the cell
temperature to 50 °C, and by a factor of 25 when adding TPFPB. Although we did not explore
combining these two effects (higher temperature and TPFPB), it is likely that even higher capacities
could be obtained by capitalizing on both effects; however, special care will be needed to ensure
TPFPB stability at higher temperatures. Overall, these results indicate that tailoring the LiF
solubility presents a promising route to dramatically increase the energy density attainable at higher
rates, a key limitation in our original study. We note that TPFPB is not necessarily an optimized
choice among the many different choices of anion receptor available commercially,[41] and
therefore, further gains in improvement may be achievable, particularly if less-bulky anion
receptors can be identified to minimize viscosity increases at higher concentrations. Overall, these
improvements open the door for further development of bulk solid-forming reactions for sustained
20
Figure 7. Comparison of rate capability of Li-SF6 cells at 50 °C and RT with or without
TPFPB additive, obtained on GDL electrodes in 0.1 M LiClO4/DMSO electrolyte at a
cutoff voltage of 2.0 V vs. Li/Li+. The averages and error bars represent statistics from more than three samples for each condition.
3. Conclusions
We have reported viable strategies to dramatically improve the attainable capacity, and thus the
energy density, in Li-SF6 cells undergoing bulk fluoride-forming reactions. Both approaches
explored herein target the intrinsically low solubility of LiF, either by operating at moderately
elevated temperatures of 50 °C to improve solubility and favor sparser and larger LiF nuclei in the
initial stages of growth; or through more aggressive chemical modification of the electrolyte to
incorporate an anion receptor additive (TPFPB) that dissolves LiF. Both strategies can significantly
increase the achievable capacity by a factor of 10 and 25 respectively, at a high current density of
120 μA cm-2. Use of anion receptors, in particular, appears promising for applications where
operating at higher temperature may not be an option. Combining this approach with future efforts
to increase the discharge voltage, for instance by altering the electrode material to promote specific
SF6 adsorption and/or catalyze its reduction,[42] may lead to even closer realization of the high
21
4. Experimental Section
Chemicals and Materials: All chemicals, electrodes and cell-making materials were thoroughly dried and stored in an argon-filled glovebox (H2O content <1 ppm, O2 content <1 ppm, MBRAUN).
LiClO4 (99.99% trace metals basis, Sigma-Aldrich) and TPFPB (>97%, Alfa Aesar) were dried for
24 hours at 70 °C and 90 °C, respectively, in a Buchi glass oven. Diglyme (99.5%, Sigma-Aldrich),
TEGDME (99%, Sigma-Aldrich), PC (99.7%, Sigma-Aldrich), DMSO (> 99.9%, Sigma-Aldrich),
EC (99%, Sigma-Aldrich), DEC (> 99.9%, Sigma-Aldrich) and DMA (99.8%, Sigma-Aldrich)
were dried over fresh molecular sieves (Type 3 Å, Sigma-Aldrich) inside the glovebox at room
temperature for 24 hours prior to use. The molecular sieves and Whatman filter paper (Grade
QM-A, 2.2 μm pore size, 450 μm in thickness, Sigma Aldrich) were dried overnight at 120 °C under
active vacuum in a glass oven (Buchi).
Carbon Cathode Preparation: The Vulcan carbon (VC) cathodes were fabricated in-house by uniformly coating sonicated inks composed of VC (XC-72, Cabot Corporation), isopropanol, and
lithiated Nafion (LITHion dispersion, Ion Power, with a Nafion/VC weight ratio of 1:2) onto a
sheet of Celgard separator (Celgard 2325, 25 μm thickness, MTI Corporation). The obtained
VC-coated Celgard was dried at room temperature before being punched into circular disks (12 mm
diameter), with a typical VC loading of 0.27± 0.08 mgC cm-2 (error bar represents four
measurements). The as-received gas diffusion layer (GDL, Freudenberg H23, FuelCellStore) was
also punched into 12 mm diameter discs. The VC and GDL cathodes were subsequently dried under
active vacuum in a glass oven (Buchi) overnight at 70 °C and 120 °C, respectively.
Galvanostatic Discharge: Two-electrode Swagelok-type Li-SF6 cells were constructed in an argon
22
thick, 99.9% metals basis, Alfa Aesar), which was prestabilized by soaking in 0.1 M LiClO4 in PC
for more than three days before use.[23] The separator (13 mm diameter glass fiber filter paper) was
impregnated with 150 μL electrolyte solution. The LiClO4 concentration in DMSO, TEGDME
EC/DEC (50/50 v/v), PC and DMA electrolytes were 0.1 M, while the only exception was diglyme,
where the concentration was 70 mM owing to a lower salt solubility limit. SF6 gas (Airgas,
99.999% purity) was introduced into cells following their assembly by purging SF6 into the cell
headspace within the glovebox for approximately 3 min, pressurizing it to ~1.6 bar, and then sealing
the cell for subsequent measurement outside the glovebox.
Li-SF6 cells were rested at open circuit voltage (OCV) for 15 hours prior to testing. Typical open
circuit voltage (OCV) values of assembled cells ranged from 2.7 – 3.3 V (vs. Li/Li+). The
subsequent galvanostatic discharge measurements were carried out (BioLogic VMP3 potentiostat
or MPG2 workstation) at the specified current density with a voltage window ranging from open
circuit to a lower cutoff voltage of 1.6 - 2.0 V vs Li/Li+(as indicated). The lower cutoff voltage was
varied in different measurements to avoid the decomposition of electrolyte, particularly when the
anion receptor, TPFPB, was added. Results (current density and capacity) were normalized to the
geometric area of GDL or the weight of VC used. For galvanostatic discharge at 50 °C, the cells
were placed inside an incubator (Memmert GmbH + Co. KG). For cells using DMA electrolyte,
due to its reactivity with Li, pre-oxidized LiFePO4 (LFP) was used as anode. The LFP electrode (9
mm diameter, single-side coated on Al foil, MTI Corporation, 7.63 mg) was first charged at a
current density of 0.2 C for 15 min in a Li-LFP Swagelok-type cell with 1 M LiPF6 in EC/DEC
electrolyte (v/v = 1/1, battery grade, Sigma-Aldrich). After pre-delithiation, the electrode was
extracted from the cell and rinsed before used in LFP-SF6 cells. The LFP-SF6 cell voltage was
23
The capacity of LFP-SF6 DMA cells was in all cases < 1 mAh, below the capacity remaining in the
LFP electrodes (~1.23 mAh).
Rotating Disk Electrode (RDE) Measurements: Three-electrode electrochemical measurements were carried out in an argon-filled glovebox. All the electrodes and glass cells were purchased from
Pine Research Instruments. The reference electrode was constructed by immersing a silver wire
into a ceramic-fritted glass tube filled with 0.01 M AgNO3 and 0.1 M TBAClO4 in acetonitrile. For
the counter electrode, a Pt wire was inserted in a fritted glass compartment that was filled with
working electrolyte. A glassy carbon (GC) disk (0.196 cm2) was used as working electrode. Prior
to each measurement, the GC electrode was polished using de-ionized water-wetted polishing
papers (Thorlabs) in a sequence of 5, 3, 1, and 0.3 μm until a mirror finish was obtained, followed
by a rinsing step with de-ionized water, and was dried under active vacuum in a glass oven (Buchi)
at 70 °C overnight. The electrode was transferred into glovebox directly without exposure to air.
To determine the potential of reference electrode versus Li/Li+, a piece of Li foil was inserted into
the electrolyte solution and its potential relative to Ag/Ag+ was measured until stabilization. The
obtained value were: 0 VLi = -3.65 V vs. Ag/Ag+ in 0.1 M LiClO4 in DMSO; 0 VLi = -3.64 V vs.
Ag/Ag+ in 0.1 M TPFPB / 0.1 M LiClO4 in DMSO. After the Li/Li+ potential was established, the
working electrode was then immersed in the electrolyte and repeatedly cycled at 100 mV s-1 with
a passive argon headspace between 3 V and 1 V (vs. Li/Li+) until a stable capacitive background
current was obtained. The GC electrode was then replaced with a freshly-polished electrode, and
SF6 was bubbled into the electrolyte for at least 5 min prior to cyclic voltammetry (CV)
measurements. For rotating disk electrode measurements, the rotation rate of GC electrode was
24
Scanning Electron Microscopy (SEM): After discharge, the Li- SF6 cell was disassembled inside
the glovebox and the cathode was extracted, rinsed with 1,2-dimethoxyethane and dried in the
argon glovebox prior to SEM characterization. The sample, which was sealed in a glass vial in the
glovebox, was then quickly transferred into the SEM chamber for the measurement to minimize
exposure to ambient. All the SEM characterizations were conducted on a Zeiss Merlin
High-resolution SEM operating at an accelerating voltage of 5 kV and beam current of 100 pA.
X-ray Diffraction (XRD): The pristine and rinsed discharged cathodes were all stored inside the glovebox. Prior to XRD measurements, the samples were sealed in an air-sensitive sample holder
in the glovebox to minimize atmospheric contamination. XRD patterns were collected on a PANalytical X’Pert Pro multipurpose diffractometer with a copper anode (Cu Kα). All scans for
cathode characterization were performed from 5° < 2θ < 90° at a typical scan speed of 0.5° min-1.
Reference data for LiF: space group: 𝐹𝑚3̅𝑚, JCPDS: 00-004-0857.
Spectroscopic Measurements: 19F Nuclear Magnetic Resonance (NMR) measurements were
performed using a Bruker Advance Neo 400 MHz NMR spectrometer. Samples dissolved in
deuterated solvents (D2O (Sigma-Aldrich) or DMSO-d6 (Sigma-Aldrich)) with
2,2,2-trifluoroethanol (TFE, Sigma-Aldrich) or trifluoroacetic acid (TFA, Sigma-Aldrich) as reference.
Samples were then transferred into capped NMR tubes (Wilmad, 528-PP-7) or coaxial tubes
(Wilmad, 517-complete) for NMR analysis. X-ray photoelectron spectroscopy (XPS) analysis was
conducted on a PHI VersaProbe II X-ray Photoelectron Spectrometer. The samples were
transferred to XPS with minimum exposure to the air. The binding energies were calibrated by F
1s peak of LiF at 685.0 eV.
Supporting Information
25
Acknowledgements
The authors acknowledge funding from MIT Lincoln Laboratory in support of this research. This work made use of the MRSEC Shared Experimental Facilities at MIT, supported by the National Science Foundation under award number DMR-14-19807. We also wish to thank Eric Morgan at Lincoln Laboratory for helpful discussions.
Received: ((will be filled in by the editorial staff)) Revised: ((will be filled in by the editorial staff)) Published online: ((will be filled in by the editorial staff))
References
[1] a) J. Cabana, L. Monconduit, D. Larcher, M. R. Palacin, Adv. Mater. 2010, 22, E170; b) J.
Kim, H. Kim, K. Kang, Adv. Energy Mater. 2018, 1702646.
[2] a) D. Aurbach, B. D. McCloskey, L. F. Nazar, P. G. Bruce, Nat. Energy 2016, 1; b) J. Lu,
L. Li, J. B. Park, Y. K. Sun, F. Wu, K. Amine, Chem. Rev. 2014, 114, 5611.
[3] X. Gao, Y. Chen, L. Johnson, P. G. Bruce, Nat. Mater. 2016, 15, 882.
[4] a) L. Ma, T. Yu, E. Tzoganakis, K. Amine, T. Wu, Z. Chen, J. Lu, Adv. Energy Mater.
2018, 8, 1800348; b) Y. C. Lu, B. M. Gallant, D. G. Kwabi, J. R. Harding, R. R. Mitchell, M. S.
Whittingham, Y. Shao-Horn, Energy Environ. Sci. 2013, 6.
[5] a) P. Hartmann, C. L. Bender, M. Vračar, A. K. Dürr, A. Garsuch, J. Janek, P. Adelhelm,
Nat. Mater. 2013, 12, 228; b) P. Adelhelm, P. Hartmann, C. L. Bender, M. Busche, C. Eufinger, J. Janek, Beilstein J. Nanotechnol. 2015, 6, 1016.
[6] X. Ren, Y. Wu, J. Am. Chem. Soc. 2013, 135, 2923.
[7] a) I. Landa-Medrano, R. Pinedo, X. Bi, I. Ruiz de Larramendi, L. Lezama, J. Janek, K.
Amine, J. Lu, T. Rojo, ACS Appl. Mater. Interfaces 2016, 8, 20120; b) B. D. McCloskey, J. M.
Garcia, A. C. Luntz, J. Phys. Chem. Lett. 2014, 5, 1230; c) N. Xiao, X. Ren, W. D. McCulloch,
26
[8] H. D. Lim, H. Park, H. Kim, J. Kim, B. Lee, Y. Bae, H. Gwon, K. Kang, Angew. Chem.,
Int. Ed. 2015, 54, 9663.
[9] a) X. Li, S. Yang, N. Feng, P. He, H. Zhou, Chin. J. Catal. 2016, 37, 1016; b) Y. Qiao, J.
Yi, S. Wu, Y. Liu, S. Yang, P. He, H. Zhou, Joule 2017, 1, 359; c) S. Xu, S. K. Das, L. A.
Archer, RSC Adv. 2013, 3, 6656; d) A. Khurram, M. He, B. M. Gallant, Joule 2018, 2, 2649.
[10] a) Y. Li, A. Khurram, B. M. Gallant, J. Phys. Chem. C 2018, 122, 7128; b) M. He, Y. Li,
R. Guo, B. M. Gallant, J. Phys. Chem. Lett. 2018, 9, 4700.
[11] K. Seppelt, Chem. Rev. 2015, 115, 1296.
[12] a) X. Ren, K. C. Lau, M. Yu, X. Bi, E. Kreidler, L. A. Curtiss, Y. Wu, ACS Appl. Mater.
Interfaces 2014, 6, 19299; b) C. L. Bender, P. Hartmann, M. Vračar, P. Adelhelm, J. Janek, Adv. Energy Mater. 2014, 4, 1301863; c) B. D. McCloskey, R. Scheffler, A. Speidel, G. Girishkumar, A. C. Luntz, J. Phys. Chem. C 2012, 116, 23897.
[13] C. Xia, C. Y. Kwok, L. F. Nazar, Science 2018, 361, 777.
[14] Y. C. Lu, D. G. Kwabi, K. P. C. Yao, J. R. Harding, J. Zhou, L. Zuin, Y. Shao-Horn,
Energy Environ. Sci. 2011, 4, 2999.
[15] a) V. Viswanathan, K. S. Thygesen, J. Hummelshøj, J. K. Nørskov, G. Girishkumar, B. D.
McCloskey, A. C. Luntz, J. Chem. Phys. 2011, 135, 214704; b) Z. Lyu, Y. Zhou, W. Dai, X. Cui,
M. Lai, L. Wang, F. Huo, W. Huang, Z. Hu, W. Chen, Chem. Soc. Rev. 2017, 46, 6046.
[16] L. Johnson, C. Li, Z. Liu, Y. Chen, S. A. Freunberger, P. C. Ashok, B. B. Praveen, K.
Dholakia, J. M. Tarascon, P. G. Bruce, Nat. Chem. 2014, 6, 1091.
[17] N. B. Aetukuri, B. D. McCloskey, J. M. Garcia, L. E. Krupp, V. Viswanathan, A. C.
27
[18] a) H. D. Lim, B. Lee, Y. Zheng, J. Hong, J. Kim, H. Gwon, Y. Ko, M. Lee, K. Cho, K.
Kang, Nat. Energy 2016, 1, 16066; b) J. B. Park, S. H. Lee, H. G. Jung, D. Aurbach, Y. K. Sun,
Adv. Mater. 2018, 30, 1704162.
[19] W. Yu, H. Wang, J. Hu, W. Yang, L. Qin, R. Liu, B. Li, D. Zhai, F. Kang, ACS Appl.
Mater. Interfaces 2018, 10, 7989.
[20] Z. Liu, L. Ma, L. Guo, Z. Peng, J. Phys. Chem. Lett. 2018, 9, 5915.
[21] a) N. Watanabe, R. Hagiwara, T. Nakajima, H. Touhara, K. Ueno, Electrochim. Acta
1982, 27, 1615; b) C. Pang, F. Ding, W. Sun, J. Liu, M. Hao, Y. Wang, X. Liu, Q. Xu,
Electrochim. Acta 2015, 174, 230.
[22] X. Cui, J. Chen, T. Wang, W. Chen, Sci. Rep. 2014, 4, 5310.
[23] Z. Peng, S. A. Freunberger, Y. Chen, P. G. Bruce, Science 2012, 337, 563.
[24] Y. C. Lu, H. A. Gasteiger, Y. Shao-Horn, Electrochem. Solid-State Lett. 2011, 14, A70.
[25] a) J. Gao, M. A. Lowe, Y. Kiya, H. D. Abruña, J. Phys. Chem. C 2011, 115, 25132; b) T.
Yim, M. S. Park, J. S. Yu, K. J. Kim, K. Y. Im, J. H. Kim, G. Jeong, Y. N. Jo, S. G. Woo, K. S.
Kang, Electrochim. Acta 2013, 107, 454.
[26] C. B. Stubblefield, R. O. Bach, J. Chem. Eng. Data 1972, 17, 491.
[27] D. A. Wynn, M. M. Roth, B. D. Pollard, Talanta 1984, 31, 1036.
[28] N. Xin, Y. Sun, M. He, C. J. Radke, J. M. Prausnitz, Fluid Phase Equilib. 2018, 461, 1.
[29] L. Zámostná, T. Braun, Angew. Chem. 2015, 127, 10798.
[30] a) U. Mayer, V. Gutmann, W. Gerger, Monatshefte für Chemie/Chemical Monthly 1975,
106, 1235; b) V. Gutmann, Electrochim. Acta 1976, 21, 661.
[31] a) L. Johnson, C. Li, Z. Liu, Y. Chen, S. A. Freunberger, P. C. Ashok, B. B. Praveen, K.
28
Electrochem. Soc. 2015, 162, A3021; c) D. Xu, Z. L. Wang, J. J. Xu, L. L. Zhang, X. B. Zhang, Chem. Commun. 2012, 48, 6948.
[32] R. D. Rauh, F. S. Shuker, J. M. Marston, S. B. Brummer, J. Inorg. Nucl. Chem. 1977, 39,
1761.
[33] S. Lau, L. A. Archer, Nano Lett. 2015, 15, 5995.
[34] B. Liu, W. Xu, J. Zheng, P. Yan, E. D. Walter, N. Isern, M. E. Bowden, M. H. Engelhard,
S. T. Kim, J. Read, ACS Energy Lett. 2017, 2, 2525.
[35] a) G. Erker, Dalton Trans. 2005, 11, 1883; b) S. Döring, G. Erker, R. Fröhlich, O. Meyer,
K. Bergander, Organometallics 1998, 17, 2183.
[36] a) L. F. Li, H. S. Lee, H. Li, X. Q. Yang, K. W. Nam, W. S. Yoon, J. McBreen, X. J.
Huang, J. Power Sources 2008, 184, 517; b) X. Sun, H. S. Lee, X. Q. Yang, J. McBreen,
Electrochem. Solid-State Lett. 2001, 4, A184.
[37] a) Z. Chen, K. Amine, J. Electrochem. Soc. 2006, 153, A1221; b) X. Sun, H. S. Lee, X. Q.
Yang, J. McBreen, Electrochem. Solid-State Lett. 2002, 5, A248.
[38] G. B. Han, J. N. Lee, J. W. Choi, J. K. Park, Electrochim. Acta 2011, 56, 8997.
[39] M. Herstedt, M. Stjerndahl, T. Gustafsson, K. Edström, Electrochem. Commun. 2003, 5,
467.
[40] a) D. Zheng, Q. Wang, H. S. Lee, X. Q. Yang, D. Qu, Chemistry 2013, 19, 8679; b) Q.
Wang, D. Zheng, M. E. McKinnon, X. Q. Yang, D. Qu, J. Power Sources 2015, 274, 1005.
[41] V. P. Reddy, M. Blanco, R. Bugga, J. Power Sources 2014, 247, 813.
[42] X. Y. Yang, J. J. Xu, D. Bao, Z. W. Chang, D. P. Liu, Y. Zhang, X. B. Zhang, Adv.
29
Significant improvement of rate capability of Li-SF6 cells is achieved by controlling the
formation of LiF. Two viable strategies, moderately elevating temperature to 50 °C or using an anion receptor (TPFPB) as additive in electrolyte, can increase attainable capacity by a factor of 10 or 25, respectively, at high current density (120 μA cm-2).
Keyword: Batteries
H. Gao, Y. Li, R. Guo and Prof. B. M. Gallant*
Controlling Fluoride-Forming Reactions for Improved Rate Capability in Lithium-Gas Conversion Batteries
30
Copyright WILEY-VCH Verlag GmbH & Co. KGaA, 69469 Weinheim, Germany, 2016.
Supporting Information
Controlling Fluoride-Forming Reactions for Improved Rate Capability in Lithium-Gas Conversion Batteries
Haining Gao, Yuanda Li, Rui Guo, and Betar M. Gallant*
Additional Experimental Methods
Electrochemical impedance spectroscopy (EIS): EIS analysis was conducted on two-electrode Swagelok cells. A potential perturbation of 5 mV was applied in a frequency range from 1 MHz to
100 mHz at open circuit voltage.
Quantifcation of LiF yield: The amount of LiF generated after discharge was determined using the following procedure: the cathode and separator of the discharged cell were extracted and soaked in
3 mL D2O overnight to dissolve solid LiF. A portion of this solution was transferred into a capped
NMR tube with 136 mM 2,2,2-trifluoroethanol (TFE) added as an internal reference. The
concentration of LiF was obtained by comparing the integrated peak area of TFE and LiF in the 19F
31
Calculation of TPFPB-induced theoretical capacity gain:
Total mole of TPFPB (𝑛TPFPB) in a volume 𝑉 [L] of electrolyte ( 𝑉 = 150 × 10−6 L ) at a
concentration of 𝑐 [M]: 𝑛TPFPB= 𝑐 × 𝑉
Total mole of LiF (𝑛LiF) dissolved by TPFPB (assuming each TPFPB molecule dissolves only one
molecule of LiF): 𝑛LiF = 𝑛TPFPB
The solubilization of each LiF molecule corresponds to one electron transferred during discharge,
so the total additional charge transfer (𝑄, [C]) corresponding to 𝑛LiF mol of LiF: 𝑄 = 𝐹 × 𝑛LiF (F
denotes Faraday constant, 96485 C mol-1).
Thus the theoretical capacity gain is: 𝑄 = 𝐹 × 𝑐 × 𝑉 ÷ 3.6 [C/mAh]
For example, at concentration of 𝑐 = 0.05 M, 𝑄 = (96485 𝐶
𝑚𝑜𝑙) × (0.05 𝑀) × (150 ×
32
Figure S1. Galvanostatic discharge of Li/Gas Diffusion Layer (Li/GDL) cells in different
electrolyte solvents (PC, EC/DEC, TEGDME, diglyme, DMA and DMSO) under an argon headspace at a current density of 5 μA cm-2. The electrolyte was 0.1 M LiClO
4 (with the exception
of 0.07 M in diglyme) and the cutoff voltage was 1.6 V vs. Li/Li+.
Table S1. Donor Number (DN), acceptor number (AN) and reported LiF solubility
(at room temperature, unless otherwise indicated) of different solvents.
Solvent DN[2] AN[2a, 3] LiF solubility(g L-1)
PC 15.1 18.3 0.13[4] EC 16.4 22.2 5.52[4] (40 °C) DEC 16 6.2 <0.01[5] Diglyme 18[6] 9.9 TEGDME 16.6 10.5[7] DMA 27.8 13.6 DMSO 29.8 19.3 0.37[8]
33
Figure S2. X-ray diffraction (XRD) patterns of fully discharged Vulcan Carbon (VC) cathodes in
different electrolyte solvents containing 0.1 M LiClO4 (with the exception of 0.07 M in diglyme)
at a current density of 75 mA gC-1. The cutoff voltage was 1.6 V vs. Li/Li+, (capacity = 3975, 2860,
1430, 1065, and 800 mAh gC-1 for cells discharged with DMSO, DMA, diglyme, EC/DEC, and PC
electrolyte respectively).
Figure S3. Rotating disk electrode (RDE) measurement of Li-SF6 cells with DMSO electrolyte.
The total integrated capacity of the 1st reduction cycle at various rotation speeds (0, 400, 600, 1600
rpm) is shown in the inset. The scan rate is 100 mV s-1, with a lower cutoff voltage of 1 V vs. Li/Li+. For all rotation rates investigated, negligible current can be detected after the 1st cycle in DMSO electrolyte. The argon background (at 1600 rpm, which was representative of all argon scans over different rotation rates) is shown in gray.
34
Figure S4. Nyquist plots of Li-SF6 cells with 0.1 M LiClO4/DMSO electrolyte at different depths
of discharge at (a) room temperature (RT), (b) 50 °C, and (c) with 400 mM TPFPB additive at RT. The corresponding discharge states at which impedances were measured are indicated in the inset.
Figure S5. Scanning electron microscopy (SEM) images of gas diffusion layer (GDL) cathodes in
Li-SF6 cells after full galvanostatic discharge in DMSO or DMA electrolyte (as indicated). The
current density in both cases was 5 μA cm-2 (capacity = 1.3 and 0.6 mAh cm-2 for cells discharged
35
Figure S6. Galvanostatic discharge of Li/GDL cells at 50 °C in 0.1 M LiClO4/DMSO electrolyte
under an argon headspace and a current density of 40 μA cm-2, with a cutoff voltage of 1.9 V vs.
Li/Li+.
Figure S7. Scanning electron microscopy (SEM) images of gas diffusion layer (GDL) cathodes in
Li-SF6 cells fully discharged in DMSO electrolyte at 50 °C at current densities of 40, 80, 120 and
200 μA cm-2 (capacity = 1.8, 1.0, 1.0, and 0.9 mAh cm-2 respectively). The scale bar = 400 nm in
36
Figure S8. (a) Cyclic voltammetry of 0.1 M LiClO4/DMSO electrolyte containing 0.1 M TPFPB
under an argon headspace at a scan rate of 100 mV s-1. (b) Comparison of 1st scan in Figure S8a
(as background measurement: TPFPB under Argon), Figure 5b (SF6 in DMSO electrolyte without
37
Figure S9. (a) 19F NMR of 400 mM TPFPB in 0.1M LiClO4/DMSO electrolyte with/without
PC-stabilized Li soaked for six days. To avoid possible reaction between TPFPB and the reference (2,2,2-Trifluoroethanol, TFE), the measurements were conducted using coaxial NMR tubes. The inner tube was filled with 136 mM TFE in DMSO-d6 with the outer tube containing the electrolyte.
(b) Photograph of PC-stabilizd Li after soaked in DMSO electrolyte containing 400 mM TPFPB
for six days, showing negligible reactivity.
Table S2. Calculation of TPFPB concentration from NMR result in Figure S9, from a nominal
added concentration of 400 mM. (Integrals were normalized to that of reference peak. The volume ratio between outer and inner tube is 5.82.)* The case with ‘No Li’ is included to show the typical measurement error occurring without TPFPB present.
Integral TPFPB concentration (mM)
Peak 1 Peak 2 Peak 3 Total
No Li 35.13 15.40 32.72 83.25 389
With Li 35.59 15.96 33.33 84.88 396
* The volume ratio was calibrated by using two different references with known concentration: 136 mM TFE and 129 mM trifluoroacetic acid (TFA) in DMSO-d6, in inner and outer tubes respectively.
38
Figure S10. Galvanostatic discharge of Li/GDL cells in 0.1 M LiClO4/DMSO electrolyte
containing 0.4 M TPFPB under an argon headspace. The cutoff voltage was 1.9 V vs. Li/Li+.
Figure S11. (a) Quantification of LiF formed after galvanostatic discharge at 50 °C and RT with
or without TPFPB additive, in 0.1 M LiClO4/DMSO electrolyte at 40 μA cm-2. Dashed lines
indicate theoretical values of LiF formed per mAh of discharge capacity, which correspond to 28.0 and 37.3 μmol mAh-1 for 8 e- transfer (Li + SF
6 = Li2S + LiF) and 6 e- transfer (Li + SF6 = S + LiF)
assumptions respectively. The averages and error bars represent statistics from more than three samples for each condition. (b) S 2p high-resolution XPS spectra of a fully discharged cathode (capacity = 3.0 mAh cm-2) at 40 μA cm-2 in 0.1 M LiClO
39
Figure S12. Rate capability of Li-SF6 cells with (a) 400 mM and (b) 200 mM of the TPFPB
additive in 0.1 M LiClO4/DMSO electrolyte. Galvanostatic discharge was conducted at a current
density of 40, 80, or 120 μA cm-2 with GDL electrodes and a cutoff voltage of 2.0 V vs. Li/Li+.
The relatively large noise in the voltage profiles is caused by room temperature variation during discharge, as TPFPB was found to increase the thermal sensitivity of cells. We verified that all cells made at the same time showed exactly the same trend in voltage fluctuation, and that the noise could be eliminated if the test were performed in a constant temperature incubator.
References
[1] Y. Li, A. Khurram, B. M. Gallant, J. Phys. Chem. C 2018, 122, 7128
[2] a) U. Mayer, V. Gutmann, W. Gerger, Monatshefte für Chemie/Chemical Monthly 1975, 106, 1235; b) V. Gutmann, Electrochim. Acta 1976, 21, 661.
[3] P. J. Michelsen, Degree Thesis, Rochester Institute of Technology, 12, 1990.
[4] J. Jones, M. Anouti, M. Caillon-Caravanier, P. Willmann, D. Lemordant, Fluid Phase Equilib. 2009, 285, 62.
[5] J. Jones, M. Anouti, M. Caillon-Caravanier, P. Willmann, P.-Y. Sizaret, D. Lemordant, Fluid Phase Equilib. 2011, 305, 121.
[6] L. Lutz, W. Yin, A. Grimaud, D. Alves Dalla Corte, M. Tang, L. Johnson, E. Azaceta, V. Sarou-Kanian, A. Naylor, S. Hamad, J. Phys. Chem. C 2016, 120, 20068.
[7] K. Abraham, ECS Trans. 2012, 41, 27.