Dietary patterns and risk of elevated C-reactive protein concentrations
12 years later
Chantal Julia
1,2*, Nathalie Meunier
3, Mathilde Touvier
1, Namanjeet Ahluwalia
1, Vincent Sapin
4,
Isabelle Papet
3,5, Noe¨l Cano
3, Serge Hercberg
1,2, Pilar Galan
1and Emmanuelle Kesse-Guyot
1 1Unite´ de Recherche en Epide´miologie Nutritionnelle (UREN), U557 Inserm/INRA/Cnam/Universite´ Paris 13, 74 rue Marcel Cachin, F-93017 Bobigny Cedex, France2Public Health Department, Assistance Publique Hoˆpitaux de Paris (AP-HP), Hoˆpital Avicenne, Bobigny, France
3Clermont Universite´, Universite´ d’Auvergne, Unite´ de Nutrition Humaine, BP 10448, F-63000 Clermont-Ferrand, France 4Laboratoire de Biochimie Me´dicale, Centre de Biologie, CHU Gabriel Mompied, Rue Montalembert, F63000
Clermont-Ferrand, France
5INRA, UMR 1019, UNH, CRNH Auvergne, F-63000 Clermont-Ferrand, France
(Submitted 23 May 2012 – Final revision received 21 November 2012 – Accepted 21 November 2012 – First published online 10 January 2013)
Abstract
Inflammation mediates several chronic diseases. Micronutrients can act on inflammation, either through modulating cytokine production or by scavenging by-products of activated white cells. Identifying dietary patterns (DP) reflecting these mechanisms and relating them to inflammation is of interest. The objective of the study was to identify DP specifically associated with intakes of nutrients potentially involved in inflammatory processes in a middle-aged population and investigate long-term associations between these DP and C-reactive protein (CRP) status assessed several years later. Subjects included in the Supplementation in Vitamins and Mineral Antioxidants 2 cohort study, having available data on dietary assessment carried out in 1994 – 5 and CRP measurement in 2007 – 9, were included in the analysis. DP were extracted with reduced rank regression (RRR), using antioxidant micronutrients and PUFA as response variables. Associations between CRP measurements . 3 mg/l and extracted DP were then examined with logistic regression models providing OR and 95 % CI. A total of 2031 subjects (53·2 % women, mean follow-up duration: 12·5 years) were included in the analyses. Of the four extracted DP, a DP with high loading values of vegetables and vegetable oils, leading to high intakes of antioxidant micronutrients and essential fatty acids, was significantly and negatively associated with risk of elevated CRP (OR 0·88; 95 % CI 0·78, 0·98). Conversely, a DP reflecting a high n-6:n-3 fatty acid intake ratio was positively and significantly associated with elevated CRP (adjusted OR 1·15; 95 % CI 1·00, 1·32). DP extracted with RRR provide support for further exploration of relationships between dietary behaviour and inflammation.
Key words:Dietary patterns: C-reactive protein: Reduced rank regression: Inflammation
Inflammation has been implicated in the pathways of numerous diseases(1). Besides chronic inflammatory conditions, such as rheumatoid arthritis or inflammatory bowel diseases, where inflammation is the primary mechanism of disease activity, low-grade chronic inflammation could be involved in the risk of obesity(2), cancer(3)and atherosclerosis(4).
Regardless of the origin or the site of chronic inflammation, the response is stereotypical and involves overproduction of cytokines, chemokines, eicosanoids and matrix metalloprotei-nases(1,5). IL-6 and TNF-a are released by activated leucocytes
at the site of inflammation and this in turn can stimulate systemic cytokine production. For instance, IL-6 induces
C-reactive protein (CRP) by the liver(6). Elevated concentrations of cytokines act to amplify the inflammatory process, leading to tissue damage and clinical symptoms(1).
Besides, activated macrophages, monocytes and granulocytes produce free oxygen radicals(7). Over time, chronic inflam-mation results in the accumulation of oxidant species, gradu-ally weakening the antioxidant defence systems(8).
Some micronutrients can act on inflammation, either by modulating primary mechanisms of cytokine production or through secondary processes by scavenging by-products of activated leucocytes. PUFA are implicated in the production of inflammatory mediators, eicosanoids, which include
* Corresponding author: C. Julia, fax þ 33 148 388 931, email [email protected]
Abbreviations: CRP, C-reactive protein; DP, dietary pattern; PCA, principal component analysis; RRR, reduced rank regression; SU.VI.MAX2, Supplementation in Vitamins and Mineral Antioxidants 2.
qThe Authors 2012
British
Journal
of
Nutrition
https://www.cambridge.org/core . IP address: 118.70.52.165 , on 24 Jun 2021 at 18:05:05, subject to the Cambridge Core terms of use, available at
https://www.cambridge.org/core/terms
.
thromboxane, PG and leukotrienes. The principal source for eicosanoids is arachidonic acid and its precursor, linoleic acid. Diets rich in linoleic or arachidonic acid have the potential to increase inflammatory signals. n-3 PUFA can serve as alternate sources for eicosanoids, leading to the production of altered eicosanoids with less inflammatory capacity(9). Diets rich in n-3 PUFA display anti-inflammatory
capacities, all the more if n-6 PUFA intake is low. Conver-sely, diets rich in n-6 and low in n-3 PUFA promote inflam-mation(10).
The response to oxidant stress, such as the one observed in inflammatory processes, involves micronutrients such as vitamins C and E and carotenoids(11,12). Vitamin C is involved
in scavenging free oxygen radicals and protection against lipid peroxidation due to its high reducing power. Vitamin E is a potent chain-breaking antioxidant interrupting lipid peroxi-dation and preventing the propagation of free radical-initiated reactions(13). Carotenoids exhibit immunomodulatory
activi-ties, stimulate the phagocytic and bacteria-killing ability of peripheral blood neutrophils and peritoneal macrophages(14). Traditional analysis in nutritional epidemiology, typically studying relationships between single nutrients and disease, does not allow us to capture the complexity of a subject’s diet, as nutrients are not consumed individually, but in combi-nation in the food matrix(15). Comprehensive approaches involving the assessment of dietary patterns (DP) have, there-fore, stirred considerable interest in the scientific community, as they represent meaningful combinations of food consump-tion in the populaconsump-tion(15).
Several studies have investigated the role of DP in inflammation processes(16 – 30), either using a priori-based approaches, through existing dietary score (describing Mediterranean diet) or a ‘dietary inflammatory index’(16 – 18), or exploratory analysis, such as principal components analysis (PCA)(19 – 22,26,29,31,32). Besides, some have proposed DP associated with biological markers of inflammation to be intermediate factors of CVD or diabetes(20,23,25,30). However, to the best of our knowledge, no study has evaluated the long-term associations between DP reflecting pro- or anti-inflammatory nutrient intake and inflammation status assessed by serum CRP concentration.
The objective of the present study was to identify DP explaining variation in intakes of nutrients potentially involved in inflammatory processes in a middle-aged popu-lation and investigate the long-term associations between those DP and CRP status assessed several years later.
Methods
Study population
The study population was selected from the participants in the Supplementation in Vitamins and Mineral Antioxidants 2 (SU.VI.MAX2) study. The SU.VI.MAX study is a randomised, double-blind, placebo-controlled, primary prevention trial designed to evaluate the effect of supplementation of antioxidant vitamins and minerals at nutritional doses on the incidence of CVD and cancer(33). Subjects were enrolled in
1994 – 5 for a planned 8-year intervention trial. In 2007 – 9, subjects were invited to enroll into an additional follow-up study defining the SU.VI.MAX2 study(34). Subjects who accepted underwent a clinical examination and had blood drawn for biological tests. In the SU.VI.MAX2 study, a sub-sample selected on the basis of geographical criteria for oper-ative and logistical aspects was included in the CRP study.
Both the SU.VI.MAX and the SU.VI.MAX2 studies were approved by the Ethics Committee for Studies with Human Subjects of the Paris-Cochin Hospital (nos. 706 and 2364, respectively) and the Comite´ National Informatique et Liberte´ (nos. 334641 and 907094, respectively). All subjects gave a written informed consent to participate in the study. This trial is registered under the trial registration code: clinical-trials.gov: NCT00272428.
All subjects included in the CRP study were eligible for the present study, irrespective of whether they belonged to the placebo or the supplementation group of the initial SU.VI.-MAX trial. Subjects having less than three dietary records in the first 2 years of the SU.VI.MAX study (1994 – 6) and subjects having missing data on anthropometric measurements (at baseline or at the beginning of the SU.VI.MAX2 study), socio-demographic, physical activity and tobacco use vari-ables were excluded from the analyses.
Data collection
Dietary data assessment. Dietary assessment was carried out via repeated 24 h records (1994 – 6), collected by computerised questionnaires using the Minitel Telematic Network loaded with study-specific software, as described before(33). The Mini-tel was a small terminal widely used in France as an adjunct to the telephone. Days of the week for these records were ran-domised and fixed for each subject so that each day of the week and all seasons were covered. A validated instruction manual was used for coding food portions, including more than 250 generic items, corresponding to 1000 specific foods. A French food composition table was used to calculate nutrient contents(35). Foods were classified into forty-three food groups (See Supplemental Table 1, available online).
Inflammation measurement. Blood samples were drawn from the participants in the SU.VI.MAX2 study (2007 – 9), immediately centrifuged and frozen at 2 808C and stored. CRP concentrations were measured using an immunoturbidi-metric assay (reagent: Tina quant C-reactive protein (latex) assay), with a detection limit of 1 mg/l for CRP. Intra-assay and inter-assay CV were 0·61 and 2·87 %, respectively.
Covariate assessment. Socio-demographic (marital status (single/cohabiting), educational level (primary, secondary or superior)), physical activity (subjects were asked to report if they regularly practised physical activity (yes or no) and if yes, if they practised the equivalent of $ 1 h walking/d (yes or no), herein coded as: irregular, , 1 h equivalent walking/ d or $ 1 h equivalent walking/d) and smoking status (never smoked, former smoker or current smoker)) data were obtained through self-administered questionnaire at baseline (1994 – 6).
British
Journal
of
Nutrition
https://www.cambridge.org/core . IP address: 118.70.52.165 , on 24 Jun 2021 at 18:05:05, subject to the Cambridge Core terms of use, available at
https://www.cambridge.org/core/terms
.
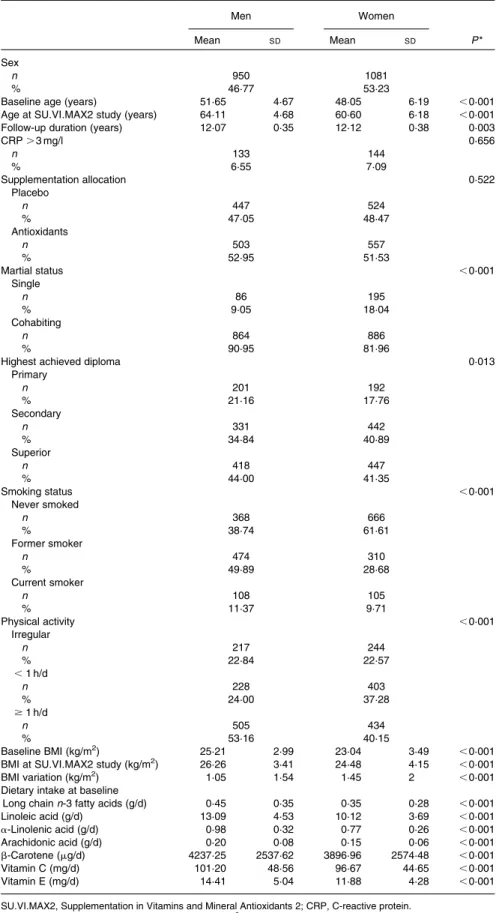
Table 1. Characteristics of the study population
(Mean values and standard deviations; number of subjects and percentages)
Men Women
Mean SD Mean SD P *
Sex
n 950 1081
% 46·77 53·23
Baseline age (years) 51·65 4·67 48·05 6·19 ,0·001
Age at SU.VI.MAX2 study (years) 64·11 4·68 60·60 6·18 ,0·001
Follow-up duration (years) 12·07 0·35 12·12 0·38 0·003
CRP . 3 mg/l 0·656 n 133 144 % 6·55 7·09 Supplementation allocation 0·522 Placebo n 447 524 % 47·05 48·47 Antioxidants n 503 557 % 52·95 51·53 Martial status ,0·001 Single n 86 195 % 9·05 18·04 Cohabiting n 864 886 % 90·95 81·96
Highest achieved diploma 0·013
Primary n 201 192 % 21·16 17·76 Secondary n 331 442 % 34·84 40·89 Superior n 418 447 % 44·00 41·35 Smoking status ,0·001 Never smoked n 368 666 % 38·74 61·61 Former smoker n 474 310 % 49·89 28·68 Current smoker n 108 105 % 11·37 9·71 Physical activity ,0·001 Irregular n 217 244 % 22·84 22·57 ,1 h/d n 228 403 % 24·00 37·28 $1 h/d n 505 434 % 53·16 40·15 Baseline BMI (kg/m2) 25·21 2·99 23·04 3·49 ,0·001
BMI at SU.VI.MAX2 study (kg/m2) 26·26 3·41 24·48 4·15 ,0·001
BMI variation (kg/m2) 1·05 1·54 1·45 2 ,0·001
Dietary intake at baseline
Long chain n-3 fatty acids (g/d) 0·45 0·35 0·35 0·28 ,0·001
Linoleic acid (g/d) 13·09 4·53 10·12 3·69 ,0·001 a-Linolenic acid (g/d) 0·98 0·32 0·77 0·26 ,0·001 Arachidonic acid (g/d) 0·20 0·08 0·15 0·06 ,0·001 b-Carotene (mg/d) 4237·25 2537·62 3896·96 2574·48 ,0·001 Vitamin C (mg/d) 101·20 48·56 96·67 44·65 ,0·001 Vitamin E (mg/d) 14·41 5·04 11·88 4·28 ,0·001
SU.VI.MAX2, Supplementation in Vitamins and Mineral Antioxidants 2; CRP, C-reactive protein. *P obtained from t tests for continuous variables and x2tests for categorical variables.
British
Journal
of
Nutrition
https://www.cambridge.org/core . IP address: 118.70.52.165 , on 24 Jun 2021 at 18:05:05, subject to the Cambridge Core terms of use, available at
https://www.cambridge.org/core/terms
.
Anthropometric measurements were taken at a clinical examination 1 year after inclusion into the SU.VI.MAX study (1995 – 7) and at the SU.VI.MAX2 study (2007 – 9). The weight was measured in subjects in light clothing and with no shoes to the nearest 0·1 kg, and the height was measured to the nearest cm with a wall-mounted stadiometer in the same conditions.
Statistics
BMI was calculated as the weight (in kg) divided by the square of height (in m) and obesity was defined as BMI $ 30 kg/m2. DP were extracted using reduced rank regression (RRR)(36). RRR derives patterns from predictors to maximise the explained variation of a pre-defined set of responses. Responses chosen for RRR were nutrients that have been consistently associated with inflammation in the literature, i.e. PUFA (linoleic acid, a-linolenic acid, arachidonic acid, EPA, docosapentanoic acid and DHA) and antioxidant micronutrients (b-carotene, vitamin C and vitamin E). Food group consumption and nutrient intake used as predictors were energy-adjusted using the residual method(37). Sensitivity analysis using different numbers of response variables (especially different regrouping sets for fatty acids and tests including or excluding dietary fibres) indicated that the greatest explanation of the total variation in foods and in responses was obtained using linoleic acid, a-linolenic acid, arachidonic acid, very-long-chain n-3 PUFA (EPA, docosapenta-noic acid and DHA combined), b-carotene, vitamin C and vitamin E. Results of sensitivity analyses are available online, in Sup-plemental Table 2. Factors explaining more than 5 % of the total explained variation in responses were retained in the anal-ysis. Extracted DP scores were used as they appeared in the RRR. CRP was categorised as # 3 and . 3 mg/l, according to the evidence in CVD risk(38), and logistic regression models were applied to estimate OR (95 % CI) of high levels of inflam-mation across tertiles of DP scores. P for trend across DP was computed using DP scores as continuous variables. We first ran models testing crude associations, then models were adjusted in three ways: (1) sex, baseline age, educational level (primary/secondary/university), marital status (single/ cohabiting), baseline smoking status (never smoker/former smoker/current smoker), baseline physical activity (irregular/ ,1 h equivalent walking/d/$ 1 h equivalent walking/d),
energy intake and number of dietary records available (initial supplementation allocation group had no effect on high levels of CRP, but for consistency, the variable was included in the adjustment procedure); (2) model 1 þ BMI at inclusion; (3) model 2 þ change in BMI during the follow-up. Interactions were tested between extracted DP and supplementation allocation group (antioxidant v. placebo) in the SU.VI.MAX study, obesity status at baseline, obesity status at SU.VI.MAX2 study and variation of obesity status with time.
Sensitivity analyses were performed in order to test the robustness of the present results. Data were re-analysed after excluding subjects with a history of cancer or CVD (myo-cardial infarction or stroke) during the dietary data collection period and obese subjects at baseline. All analyses were carried out using SAS software (version 9.1; SAS Institute, Inc.)
Results
Of the 6850 subjects enrolled in the SU.VI.MAX2 study, 3476 were included in the CRP study. Of these, 861 were excluded for insufficient number of dietary records, 502 for missing data on anthropometric measurements at baseline, forty-three for missing data on socio-demographic variables and thirty-nine for missing data on tobacco use or physical activity. The final sample, therefore, included 2031 subjects.
Characteristics of included subjects are displayed in Table 1. In particular, 53·2 % were women. Mean baseline age was 51·6 (SD4·7) years for men and 48 (SD6·2) years for women, with a mean follow-up duration of more than 12 years. In all, 52·2 % subjects were allocated to antioxidant supplementation in the initial trial. There were no differences between placebo and antioxidant groups in baseline characteristics (data not tabu-lated). Compared with those included in the sample, subjects excluded for insufficient dietary records or missing data were more frequently single. Included subjects did not differ other-wise from the excluded ones.
Mean number of dietary records available for each subject was 10.12 (SD 3.0), with a mean of 7.02 (SD2.7) records on week days and 3.10 (SD 2.0) on week-end days. Seasonality was accounted for at the individual level, as a mean of 4.57 (SD 1.6) records per subject were available for the
May – October period, while 5.55 (SD2.0) records per subject
were available for the November – April period.
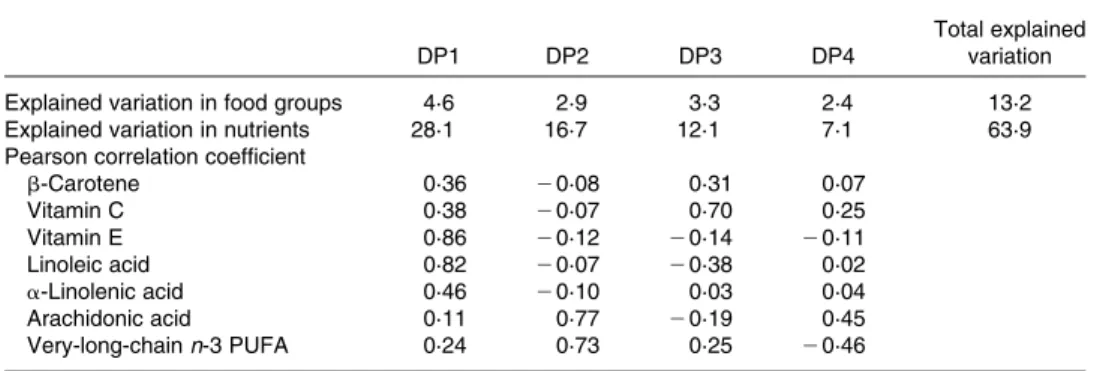
Table 2. Explained variations of nutrients and food groups by extracted dietary pattern (DP)* (n 2031)
DP1 DP2 DP3 DP4
Total explained variation
Explained variation in food groups 4·6 2·9 3·3 2·4 13·2
Explained variation in nutrients 28·1 16·7 12·1 7·1 63·9
Pearson correlation coefficient
b-Carotene 0·36 20·08 0·31 0·07 Vitamin C 0·38 20·07 0·70 0·25 Vitamin E 0·86 20·12 20·14 20·11 Linoleic acid 0·82 20·07 20·38 0·02 a-Linolenic acid 0·46 20·10 0·03 0·04 Arachidonic acid 0·11 0·77 20·19 0·45 Very-long-chain n-3 PUFA 0·24 0·73 0·25 20·46
* DP obtained with reduced rank regression using antioxidant nutrients and PUFA as response variables in the procedure.
British
Journal
of
Nutrition
https://www.cambridge.org/core . IP address: 118.70.52.165 , on 24 Jun 2021 at 18:05:05, subject to the Cambridge Core terms of use, available at
https://www.cambridge.org/core/terms
.
Four factors were extracted with RRR, explaining 63·9 % of total variation of response variables and 13·2 % of variation of food groups. Correlation between extracted DP and nutrients intake and food groups loadings on the DP are presented in Tables 2 and 3. The first pattern (DP1) was positively correlated to intake of antioxidant micronutrients (vitamin C, vitamin E and b-carotene) and essential fatty acids (linoleic and a-linolenic acids). Food groups loading highly positively on this pattern were vegetables, olive oil and other vegetable oils and groups loading highly negatively were butter, wine and refined grains. The second pattern (DP2) was positively correlated to intake of arachidonic acid and very-long-chain n-3 PUFA. Food groups loading highly positively on this pattern were fatty fish, seafood, processed meat, organ meat, eggs and poultry. The third pattern (DP3) was positively correlated to intake of vitamin C, b-carotene and very-long-chain n-3 PUFA
and negatively correlated to intake of linoleic acid, arachidonic acid and vitamin E. Food groups loading highly positively on this pattern were fruits and fruit juices and groups loading highly negatively on this pattern were vegetable oils poor in n-3 PUFA. The fourth pattern (DP4) was positively correlated to intake of arachidonic acid and vitamin C and negatively cor-related to intake of long-chain n-3 PUFA and vitamin E. This pattern reflected a high n-6:n-3 PUFA intake ratio. Food groups loading highly positively on this pattern were processed meat, eggs and poultry and group loading highly negatively on this pattern was fatty fish (Tables 2 and 3).
Logistic regression showed that high CRP concentrations were negatively associated with DP1 and positively associ-ated with DP4 assessed 13 years before in crude and multi-variate models (Table 4). Associations between DP1 and high CRP concentrations were even strengthened after adjust-ing further on BMI and BMI change (models 2 and 3), whereas associations between DP4 and high CRP were wea-kened after adjusting for BMI and change in BMI. DP2 and DP3 were not significantly associated with high concen-trations of CRP.
Interactions between extracted DP and initial supplemen-tation allocation group, obesity status at baseline, obesity status at SU.VI.MAX2 study or change in obesity status during follow-up were not significant. Exclusion of subjects having developed cancer or CVD during the 2-year period of dietary data collection or obese subjects at baseline did not substantially modify results (data not shown).
Discussion
In the present study, RRR was used to determine meaningful combinations of food intake that would explain as much of the variation of potentially pro- or anti-inflammatory nutrient intake as possible. Moreover, we were able to identify major food consumption patterns associated with inflammation: a DP rich in vegetables and vegetable oil (DP1), leading to a high intake of antioxidant micronutrients and essential fatty acids, showed preventive features against subsequent elevated CRP; conversely, a diet poor in fatty fish and rich in other animal products (DP4), leading to a high n-6:n-3 PUFA intake ratio, exhibited pro-inflammatory characteristics.
The negative association between a DP rich in vegetables and vegetable oil and inflammation is consistent with results from studies using PCA of food consumption in relation to inflammation(39). Such studies have observed that DP correlated with high intakes of vegetables, fruits, fish and vegetable oils are negatively associated with CRP concen-trations(20,21,26,29,31).
For instance, in the Nurses’ Health Study, the ‘prudent pattern’ that positively correlated with consumption of fruit, vegetables, fish, poultry and whole grains was negatively associ-ated with CRP and IL-6 concentrations in quintiles(26). In the Multi-Ethnic study for Atherosclerosis, a DP with high loading values of vegetables, fish and soup (‘vegetables and fish’) was negatively, but not significantly, associated with CRP concen-trations and with other inflammatory biomarkers (E-selectin and IL-6)(29). In a healthy Italian population, Centritto et al.(20)
Table 3. Loadings of food groups in dietary pattern (DP)* scores (n 2031)†
DP1 DP2 DP3 DP4
Animal fat other than butter Beer
Breakfast cereals 0·137
Butter 20·174
Cake, cookies and pastries Cheese Coffee Condiments 0·182 Desserts Dried fruit Eggs 0·286 0·405 Fruits 0·189 20·151 0·467 Dairy products 0·206 Fatty fish 0·155 0·632 0·239 20·514 Fruit juice 0·463 0·239 Legumes
Reduced-fat dairy products
Lean fish 0·104 0·144 20·216 Margarines 0·181 20·105 20·132 Meat 20·154 0·134 Milk Nuts 0·211 20·141 Olive oil 0·359 20·105 Organ meat 0·268 0·279 Pizza Potatoes Poultry 0·263 0·332 Processed meat 0·280 20·212 0·325 Refined grains 20·200 20·122 20·158 Soft drinks Seafood 0·327 20·114 Salty snacks Soups 0·111 20·115 0·171 Spirits 20·103
Sugar and sweets Tea
Vegetables 0·430 0·205 0·136
Vegetable oil poor in n-3 0·529 20·340 Vegetable oil rich in n-3 0·185
Water 0·139
Whole grains 20·118 0·156
Wine 20·162 0·128 20·138
* DP obtained with reduced rank regression using antioxidant nutrients and PUFA as response variables in the procedure; loading values in the range of 20.10 to 0.10 are not presented in the table.
† See Supplementary Table S1 (available online) for food groupings.
British
Journal
of
Nutrition
https://www.cambridge.org/core . IP address: 118.70.52.165 , on 24 Jun 2021 at 18:05:05, subject to the Cambridge Core terms of use, available at
https://www.cambridge.org/core/terms
.
found that a pattern with high loading values for vegetables, olive oil, legumes, soups, fruit and fish (‘olive oil and veg-etables’) was significantly negatively associated with CRP con-centrations, even after adjustment for BMI.
DP described earlier share ‘healthy components’ with our DP1, such as certain food group loadings (vegetables or vegetable oils, in particular), but the DP extraction procedure is intended to investigate the observed correlated food group consumption, maximising explained variation of food intake(36). As such, PCA-derived DP reflecting a ‘prudent’
or ‘healthy’ diet usually combines high intakes of fruits, vegetables, whole grains and fish, and it is not possible to determine which food groups mostly drive the negative association with inflammation. This might possibly explain why some PCA-derived patterns fail to associate significantly with inflammatory biomarkers in the literature. RRR procedure allows for analysing associations between food group consumption and inflammation beyond simple correlations as would PCA, stressing which component of a ‘healthy’ diet would directly relate to inflammation. The present results argue that vegetables and vegetable oil are probably responsible for the association between these ‘healthy’ patterns and inflammation.
The positive association between a diet with a high n-6:n-3 PUFA intake ratio and inflammation is not unexpected: the balance between n-6 and n-3 PUFA is of major importance in the production of inflammatory mediators(10). The fact
that the association of DP4 with high CRP is weakened after adjusting for BMI and BMI change, however, suggests that the effect of a high n-6:n-3 PUFA intake ratio on inflammation is probably mostly mediated by adiposity. Dietary fat composition has direct effects on adiposity and adipocyte metabolism(40). In rodent models, dietary fat composition alters expression of neuropeptide genes involved in weight regulation(41); diets rich in n-6 PUFA promote adiposity(42), whereas diets rich in n-3 PUFA reduce adiposity(43,44). The n-6:n-3 PUFA intake ratio in pregnant women has been found to make an impact on the adiposity of the child, and diets rich in n-6 PUFA increase adiposity in adults(45,46).
It is interesting to underline the fact that, whereas DP were significantly associated with elevated CRP, initial supplemen-tation in the SU.VI.MAX trial study was not. This finding could be explained by three mechanisms: first, supplemen-tation was conducted at nutritional doses. It is therefore possible that the associations between nutrient intake (taken as supplements) and inflammation would need a higher dosage to be proven. Second, the initial SU.VI.MAX trial ended in 2002, and subjects were not advised to take supplements at the disclosure of the results. It is therefore also possible that the improvement in nutritional status obtained with supplementation did not last up to the end of the follow-up, leaving associations with dietary intake perceptible. Third, it is possible that the global nutritional
Table 4. Increased C-reactive protein (CRP) according to quartiles of extracted dietary patterns (DP)* (n 2031) (Odd ratios and 95 % confidence intervals)
Tertile 1 Tertile 2 Tertile 3 Continuous
OR OR 95 % CI OR 95 % CI P for trend OR 95 % CI P DP1 n 105 83 80 Univariate 1 0·76 0·56, 1·04 0·73 0·53, 0·99 0·045 0·90 0·80, 1·00 0·055 Model 1† 1 0·77 0·56, 1·05 0·73 0·53, 1·00 0·048 0·90 0·80, 1·00 0·051 Model 2‡ 1 0·75 0·55, 1·03 0·69 0·49, 0·95 0·022 0·88 0·78, 0·98 0·025 Model 3§ 1 0·76 0·55, 1·05 0·69 0·50, 0·97 0·028 0·89 0·79, 0·99 0·039 DP2 n 83 97 88 Univariate 1 1·20 0·87, 1·64 1·07 0·78, 1·47 0·688 1·05 0·93, 1·18 0·46 Model 1† 1 1·22 0·88, 1·67 1·04 0·75, 1·44 0·823 1·04 0·92, 1·18 0·55 Model 2‡ 1 1·09 0·79, 1·51 0·93 0·67, 1·29 0·641 0·98 0·87, 1·12 0·79 Model 3§ 1 1·01 0·73, 1·41 0·87 0·62, 1·21 0·388 0·96 0·85, 1·09 0·52 DP3 n 95 81 92 Univariate 1 0·83 0·61, 1·14 0·96 0·71, 1·31 0·810 1·00 0·88, 1·14 0·99 Model 1† 1 0·83 0·60, 1·15 0·95 0·69, 1·30 0·734 1·00 0·88, 1·14 0·99 Model 2‡ 1 0·87 0·63, 1·20 1·04 0·75, 1·44 0·819 1·04 0·91, 1·18 0·59 Model 3§ 1 0·90 0·65, 1·26 1·10 0·79, 1·52 0·588 1·06 0·93, 1·21 0·41 DP4 n 79 88 101 Univariate 1 1·13 0·82, 1·56 1·33 0·97, 1·82 0·078 1·19 1·04, 1·36 0·012 Model 1† 1 1·14 0·82, 1·59 1·32 0·96, 1·82 0·085 1·20 1·04, 1·37 0·010 Model 2‡ 1 1·09 0·78, 1·52 1·21 0·87, 1·67 0·250 1·15 1·00, 1·32 0·046 Model 3§ 1 1·10 0·79, 1·55 1·19 0·86, 1·65 0·306 1·13 0·98, 1·30 0·090
* DP obtained with reduced rank regression using antioxidant nutrients and PUFA as response variables in the procedure.
† Model 1 adjusted for sex, baseline age, level of education (primary/secondary/university), marital status (single/cohabiting), smoking status (never smoker/former smoker/current smoker), baseline physical activity (irregular/, 1 h equivalent walking/d/$ 1 h equivalent walking/d), energy intake, number of dietary records available and supplementation allocation group (antioxidant v. placebo).
‡ Model 2 adjusted for model 1 variables þ baseline BMI.
§ Model 3 adjusted for model 2 variables þ change in BMI during follow-up.
British
Journal
of
Nutrition
https://www.cambridge.org/core . IP address: 118.70.52.165 , on 24 Jun 2021 at 18:05:05, subject to the Cambridge Core terms of use, available at
https://www.cambridge.org/core/terms
.
profile of food groups rather than the antioxidant compounds per se would be responsible of the observed effect.
To our knowledge, long-term associations between DP extracted using RRR and CRP concentrations examined in a longitudinal design have not been previously investigated. Inflammatory biomarkers are usually considered as intermedi-ary factors between nutrition and CVD or diabetes. Therefore, studies using RRR to extract DP introduce CRP in combination with other risk factors for these diseases as response variables in the procedure, in order to analyse associations with prospective onset of CVD or diabetes(20,23,25,27).
Introducing nutrients as response variables in the RRR procedure allowed us to explore the possible mechanisms through which food group consumption could act on inflammatory processes. RRR identified the components of a potential anti-inflammatory diet, relating them to current knowledge in the field. RRR in this perspective, therefore, contributes to new insights on the anti- or pro-inflammatory potential of the diet.
The present study is, however, subject to limitations. First, CRP was measured with a standard procedure, with a detection limit at , 1 mg/l, not allowing us to investigate low-grade inflammation. Second, CRP was not measured at baseline, and therefore subjects with high inflammation pre-existing at baseline could not be excluded. The present results could, therefore, reflect pre-existing associations between DP and CRP. However, sensitivity analysis excluding subjects susceptible to having a high CRP at baseline (subjects having declared cancer or CVD in the initial years of the study or obese subjects at baseline) did not significantly alter the present results.
Strengths of the present study include the use of detailed repeated dietary records (24 h records), allowing for an accurate and reliable analysis of nutrient intake, use of valid and original statistical analyses, investigation of the long-term associations between nutrition and inflammation and test of the robustness of the results in sensitivity analysis.
In conclusion, the present results show that DP specifically explaining variation in intakes of potentially pro- and anti-inflammatory nutrients can accurately predict high levels of inflammatory biomarkers several years later. However, the present results need to be reproduced in other populations in order to confirm our conclusions on the beneficial effects of a diet rich in vegetables and vegetable oils on inflammation.
Supplementary material
To view supplementary material for this article, please visit http://dx.doi.org/10.1017/S0007114512005636
Acknowledgements
The SU.VI.MAX2 study was funded by the ANR (no. ANR-05-PNRA-010), DGS (Ministry of Health) and was also supported by Me´de´ric, Sodexo, Ipsen, MGEN and Pierre Fabre. Mederic and MGEN are French health insurance organisations that are complementary to the national health insurance system. Ipsen and Pierre Fabre are private pharmaceutical companies.
They provided financial support for the overall implemen-tation of the research project. Sodexo, a catering company, provided financial support for several teamwork events with researchers and study participants. Since French public research is independent, the sponsors were not involved in the analysis or interpretation of the findings. The authors report no conflicts of interest. C. J. developed the overall research plan, conducted research, performed statistical analyses, wrote the paper and had primary responsibility for final content. E. K.-G. participated in project conception, development of overall research plan, critically reviewed the manuscript and supervised research. N. M., M. T., N. A., V. S., I. P. and N. C. provided essential material and critically reviewed the manuscript. E. K.-G., S. H. and P. G. designed the SU.VI.MAX2 study, provided essential material and critically reviewed the manuscript. All authors read and approved the final manuscript.
References
1. Calder PC, Albers R, Antoine JM, et al. (2009) Inflammatory
disease processes and interactions with nutrition. Br J Nutr 101, Suppl. 1, S1 – 45.
2. Hotamisligil GS (2006) Inflammation and metabolic
disorders. Nature 444, 860 – 867.
3. Coussens LM & Werb Z (2002) Inflammation and cancer.
Nature 420, 860 – 867.
4. Libby P (2002) Inflammation in atherosclerosis. Nature 420,
868 – 874.
5. Rangel-Huerta OD, Aguilera CM, Mesa MD, et al. (2012)
Omega-3 long-chain polyunsaturated fatty acids supplemen-tation on inflammatory biomakers: a systematic review of randomised clinical trials. Br J Nutr 107, S159 – S170.
6. Luster AD (1998) Chemokines-chemotactic cytokines that
mediate inflammation. N Engl J Med 338, 436 – 445.
7. Kehrer JP (1993) Free radicals as mediators of tissue injury
and disease. Crit Rev Toxicol 23, 21 – 48.
8. Hensley K, Robinson KA, Gabbita SP, et al. (2000) Reactive
oxygen species, cell signaling, and cell injury. Free Radic Biol Med 28, 1456 – 1462.
9. Calder PC (1998) Fat chance of immunomodulation.
Immunol Today 19, 244 – 247.
10. Simopoulos AP (2008) The importance of the omega-6/
omega-3 fatty acid ratio in cardiovascular disease and other chronic diseases. Exp Biol Med (Maywood) 233, 674 – 688.
11. Conner EM & Grisham MB (1996) Inflammation, free
radicals, and antioxidants. Nutrition 12, 274 – 277.
12. Nordberg J & Arner ES (2001) Reactive oxygen species,
antioxidants, and the mammalian thioredoxin system. Free Radic Biol Med 31, 1287 – 1312.
13. Sies H (1997) Oxidative stress: oxidants and antioxidants.
Exp Physiol 82, 291 – 295.
14. Chew BP (1993) Role of carotenoids in the immune
response. J Dairy Sci 76, 2804 – 2811.
15. Hu FB (2002) Dietary pattern analysis: a new direction in
nutritional epidemiology. Curr Opin Lipidol 13, 3 – 9.
16. Carter SJ, Roberts MB, Salter J, et al. (2010)
Relation-ship between Mediterranean Diet Score and atherothrombo-tic risk: findings from the Third National Health and Nutrition Examination Survey (NHANES III), 1988 – 1994. Atherosclerosis 210, 630 – 636.
17. Chrysohoou C, Panagiotakos DB, Pitsavos C, et al. (2004)
Adherence to the Mediterranean diet attenuates inflammation
British
Journal
of
Nutrition
https://www.cambridge.org/core . IP address: 118.70.52.165 , on 24 Jun 2021 at 18:05:05, subject to the Cambridge Core terms of use, available at
https://www.cambridge.org/core/terms
.
and coagulation process in healthy adults: The ATTICA Study. J Am Coll Cardiol 44, 152 – 158.
18. Cavicchia PP, Steck SE, Hurley TG, et al. (2009) A new
diet-ary inflammatory index predicts interval changes in serum high-sensitivity C-reactive protein. J Nutr 139, 2365 – 2372.
19. Anderson AL, Harris TB, Tylavsky FA, et al. (2012) Dietary
patterns, insulin sensitivity and inflammation in older adults. Eur J Clin Nutr 66, 18 – 24.
20. Centritto F, Iacoviello L, di GR, et al. (2009) Dietary patterns,
cardiovascular risk factors and C-reactive protein in a healthy Italian population. Nutr Metab Cardiovasc Dis 19, 697 – 706.
21. Esmaillzadeh A, Kimiagar M, Mehrabi Y, et al. (2007) Dietary
patterns and markers of systemic inflammation among Iranian women. J Nutr 137, 992 – 998.
22. Fung TT, Rimm EB, Spiegelman D, et al. (2001) Association
between dietary patterns and plasma biomarkers of obesity and cardiovascular disease risk. Am J Clin Nutr 73, 61 – 67.
23. Heidemann C, Hoffmann K, Spranger J, et al. (2005) A
dietary pattern protective against type 2 diabetes in the European Prospective Investigation into Cancer and
Nutri-tion (EPIC) – Potsdam Study cohort. Diabetologia 48,
1126 – 1134.
24. Hlebowicz J, Persson M, Gullberg B, et al. (2011) Food
patterns, inflammation markers and incidence of cardio-vascular disease: the Malmo Diet and Cancer study. J Intern Med 270, 365 – 376.
25. Hoffmann K, Zyriax BC, Boeing H, et al. (2004) A dietary
pattern derived to explain biomarker variation is strongly associated with the risk of coronary artery disease. Am J Clin Nutr 80, 633 – 640.
26. Lopez-Garcia E, Schulze MB, Fung TT, et al. (2004)
Major dietary patterns are related to plasma concentrations of markers of inflammation and endothelial dysfunction. Am J Clin Nutr 80, 1029 – 1035.
27. Meyer J, Doring A, Herder C, et al. (2011) Dietary patterns,
subclinical inflammation, incident coronary heart disease and mortality in middle-aged men from the MONICA/ KORA Augsburg cohort study. Eur J Clin Nutr 65, 800 – 807.
28. Nanri H, Nakamura K, Hara M, et al. (2011) Association
between dietary pattern and serum C-reactive protein in Japanese men and women. J Epidemiol 21, 122 – 131.
29. Nettleton JA, Steffen LM, Mayer-Davis EJ, et al. (2006)
Diet-ary patterns are associated with biochemical markers of inflammation and endothelial activation in the Multi-Ethnic Study of Atherosclerosis (MESA). Am J Clin Nutr 83, 1369 – 1379.
30. Schulze MB, Hoffmann K, Manson JE, et al. (2005) Dietary
pattern, inflammation, and incidence of type 2 diabetes in women. Am J Clin Nutr 82, 675 – 684.
31. Nanri A, Moore MA & Kono S (2007) Impact of C-reactive
protein on disease risk and its relation to dietary factors. Asian Pac J Cancer Prev 8, 167 – 177.
32. Villegas R, Xiang YB, Cai H, et al. (2012) Lifestyle
determinants of C-reactive protein in middle-aged, urban Chinese men. Nutr Metab Cardiovasc Dis 22, 223 – 230.
33. Hercberg S, Galan P, Preziosi P, et al. (2004) The SU.VI.MAX
Study: a randomized, placebo-controlled trial of the health effects of antioxidant vitamins and minerals. Arch Intern Med 164, 2335 – 2342.
34. Kesse-Guyot E, Fezeu L, Jeandel C, et al. (2011) French
adults’ cognitive performance after daily supplementation with antioxidant vitamins and minerals at nutritional doses: a post hoc analysis of the Supplementation in Vitamins and Mineral Antioxidants (SU.VI.MAX) trial. Am J Clin Nutr 94, 892 – 899.
35. SU.VI.MAX (2006) Table de composition des aliments
(Food Composition Table). Paris: Economica.
36. Hoffmann K, Schulze MB, Schienkiewitz A, et al. (2004)
Application of a new statistical method to derive dietary patterns in nutritional epidemiology. Am J Epidemiol 159, 935 – 944.
37. Willett W & Stampfer MJ (1986) Total energy intake:
implications for epidemiologic analyses. Am J Epidemiol 124, 17 – 27.
38. Pearson TA, Mensah GA, Alexander RW, et al. (2003)
Markers of inflammation and cardiovascular disease:
application to clinical and public health practice: a statement for healthcare professionals from the Centers for Disease Control and Prevention and the American Heart Association. Circulation 107, 499 – 511.
39. Calder PC, Ahluwalia N, Brouns F, et al. (2011) Dietary
factors and low-grade inflammation in relation to overweight and obesity. Br J Nutr 106, Suppl. 3, S5 – 78.
40. Fernandez-Quintela A, Churruca I & Portillo MP (2007)
The role of dietary fat in adipose tissue metabolism. Public Health Nutr 10, 1126 – 1131.
41. Dziedzic B, Szemraj J, Bartkowiak J, et al. (2007) Various
dietary fats differentially change the gene expression of neuropeptides involved in body weight regulation in rats. J Neuroendocrinol 19, 364 – 373.
42. Massiera F, Saint-Marc P, Seydoux J, et al. (2003) Arachidonic
acid and prostacyclin signaling promote adipose tissue development: a human health concern? J Lipid Res 44, 271 – 279.
43. Poudyal H, Panchal SK, Diwan V, et al. (2011) Omega-3
fatty acids and metabolic syndrome: effects and emerging mechanisms of action. Prog Lipid Res 50, 372 – 387.
44. Kopecky J, Rossmeisl M, Flachs P, et al. (2009) n-3 PUFA:
bioavailability and modulation of adipose tissue function. Proc Nutr Soc 68, 361 – 369.
45. Donahue SM, Rifas-Shiman SL, Gold DR, et al. (2011)
Prena-tal fatty acid status and child adiposity at age 3 y: results from a US pregnancy cohort. Am J Clin Nutr 93, 780 – 788.
46. Ailhaud G, Guesnet P & Cunnane SC (2008) An
emerging risk factor for obesity: does disequilibrium of poly-unsaturated fatty acid metabolism contribute to excessive adipose tissue development? Br J Nutr 100, 461 – 470.
British
Journal
of
Nutrition
https://www.cambridge.org/core . IP address: 118.70.52.165 , on 24 Jun 2021 at 18:05:05, subject to the Cambridge Core terms of use, available at
https://www.cambridge.org/core/terms
.