Publisher’s version / Version de l'éditeur:
Geotechnique, 10, 1, pp. 19-32, 1960-06-01
READ THESE TERMS AND CONDITIONS CAREFULLY BEFORE USING THIS WEBSITE. https://nrc-publications.canada.ca/eng/copyright
Vous avez des questions? Nous pouvons vous aider. Pour communiquer directement avec un auteur, consultez la
première page de la revue dans laquelle son article a été publié afin de trouver ses coordonnées. Si vous n’arrivez pas à les repérer, communiquez avec nous à [email protected].
Questions? Contact the NRC Publications Archive team at
[email protected]. If you wish to email the authors directly, please see the first page of the publication for their contact information.
NRC Publications Archive
Archives des publications du CNRC
This publication could be one of several versions: author’s original, accepted manuscript or the publisher’s version. / La version de cette publication peut être l’une des suivantes : la version prépublication de l’auteur, la version acceptée du manuscrit ou la version de l’éditeur.
Access and use of this website and the material on it are subject to the Terms and Conditions set forth at
Vertical ground movements near elm trees
Bozozuk, M.; Burn, K. N.
https://publications-cnrc.canada.ca/fra/droits
L’accès à ce site Web et l’utilisation de son contenu sont assujettis aux conditions présentées dans le site
LISEZ CES CONDITIONS ATTENTIVEMENT AVANT D’UTILISER CE SITE WEB.
NRC Publications Record / Notice d'Archives des publications de CNRC:
https://nrc-publications.canada.ca/eng/view/object/?id=95e8731f-23cb-41e7-8804-747301eafee0 https://publications-cnrc.canada.ca/fra/voir/objet/?id=95e8731f-23cb-41e7-8804-747301eafee0
Ser
TH1
N2lr2
no.
99
c . 2
NATIONAL
RESEARCH
COUNCIL
CANADA
DIVISION OF BUILDING RESEARCH
VERTICAL GROUND MOVEMENTS NEAR ELM TREES
BY
M. BOZOZUK AND K. N. BURN
R E P R I N T E D F R O M
GEOTECHNIQUE. VOL. X NO. 1, MARCH 1960. P. 19- 32.
PRICE 25 CENTS
B U I L D I N G ,;FSEAWCH '
/
-
LIBRARY
-
R E S E A R C H PAPER N O . 99
O F THE
DIVISION OF BUILDING RESEARCH g&PI()NAL RESEARCH C O u N C t L
OTTAWA JUNE 1960
This p u b l i c a t i o n
i s
being d i s t r i b u t e d b y t h e Division of Building Research of t h e N a t i o n a l Research Councilas
a c o n t r i b u t i o n towards b e t t e rb u i l d i n g i n Canada.
I t
should not b e reproducedi n
whole o r i n p a r t , without permission of t h e o r i - g i n a l p u b l i s h e r . The D i v i s i o n would be glad t o b e of a s s i s t a n c e i n o b t a i n i n g such permission.P u b l i c a t i o n s of t h e Division of B u i l d i n g Research may be obtained by m a i l i n g t h e a p p r o p r i a t e
remittance, ( a 3ank, Express, o r Post Office Money
Order o r a cheque made payable a t p a r i n Ottawa, t o t h e Receiver General of Canada, c r e d i t N a t i o n a l Research Council) t o t h e Natior-a1 Research Council,
Ottawa. Stamps a r e not acceptable.
A coupon system has been in.troduced t o
make payments f o r p u b l i c a t i o n s r e l a t i v e l y simple, Coupons a r e a v a i l a b l e i n denominations of
5 ,
25, and9
c e n t s , and may be obtained by making a r e - m i t t a n c e a s i r d i c a t e d above. These couponsmay
be used f o r t h e purchase of a l l N a t i o n a l Research Council p u b l i c a t i o n s i n c l u d i n g s p e c i f i c a t i o n s o f t h e Canadian Government S p e c i f i c a t i o n s Board.ANALYZED
VERTICAL GROUND MOVEMENTS NEAK ELM TREES
SYNOPSIS
Vertical ground movements were investigated On a fait une enquete relative aux mouvements near a line of high elm trees growing in Leda clay verticaus du sol sous une rangee de grands ormes
soil, a marine deposit found extensively in the situBe dans les basses terres de I'Outaouais et du St-Laurent. Ces terres marines sont des argiles d u Ottawa St Lawrence Lowlands. The amplitude of type - ~ ~
on
d a ~constat& ~ . lJamplitude des these movements was found to be a function of mouvements depend de la profindeur, &e llBloizne- depth, horizontal distance from trees, and seasonal merit horizontafpar rappoPt aux arbres et des con-weather conditions. Based on results obtained for ditions climatiques. A partir des donnkes recueillies lors de I'annBe de grande sbcheresse 1955 on a itabli the record dry year of 1955, a chart was prepared un diagramme qui peut servir au calcul des fonda- which could be used as a guide for the design of tions devant 6tre Btablies prks de grands ormes et foundations near high e l ~ n trees in these clays. d a n ~ des S O ~ S argileux. On a egalement Btabli un
These ground movements were also related to "soil ~p~~~ ~ ~ u i ~ m ~ ~si,,:c:i m ~ ~ m ~ ~ t ~ \ ~ t
moisture depletion", a quantity computed from coefficient dtant calculB & Dartir de certaines weather records. An analysis of the ground move- observations climatologiques. On a fait une analyse merits over a period (1954-57) was and a des mouvements du sol observes de 1954 3. 1957 et on dBcrit une mBthode permettant de calculer ces method for computing them from weather records mouvements 2 partir d e certaines donnees clima- is given. tologiques.
INTRODUCTION
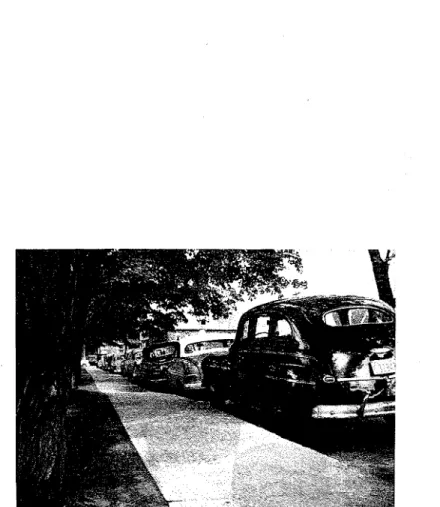
Pavements, sidewalks, and shallow foundations in regions of clay subsoils usually show evidence of vertical surface movements. Much of this movement is of a seasonal nature and appears to be related t o natural soil moisture changes caused by variations in weather and vegetal cover. Near large trees, for example, with their deep root systems and huge water demands, non-uniform seasonal moisture changes may be expected to occur t o great depths. Large non-uniform surface movements may consequently be expected from the corresponding shrinking or swelling of the soil, resulting in considerable damage t o shallow foundations. Fig. 1 illustrates typical movements of this nature.
-problems resulting from seasonal movements in Canadian clays have been reported by Torchinsky (1953)l and by Baracos and Bozozuk (1957). Similar problems exist in England where Ward (1947) and Skempton (1954) have suggested that fast-growing trees should not be located closer to shallow foundations than the height of the mature trees. The effects on shallow foundations due to both shrinking and swelling clays in Australia have been discussed by Isaacs (1952) and Tasker (1954). The predominant problem in South Africa is associated &th the effects of swelling of the clays after structures are built on them, as reported by Jennings (1953) and Collins (1957).
I n order to study what happens in the soil adjacent to large trees; that is, within a radius equal to the tree height, the Soil Mechanics Section of the Division of Building Research, National Research Council of Canada, in 1954 began a programme of measurement of the vertical ground movements near a line of high elm trees, growing in clay soil, and of correlating these movements with seasonal weather conditions. Ground-movement gauges were installed a t various depths and distances from the trees and weather records were collected. Graphs have been prepared showing the variation in ground movements with depth and distance from trees, and the relationship between ground movements and soil moisture conditions. Finally,
1 See references on p. 31 19
20 &I. B O Z O Z U I E A N D K . N . B U R N
an equation has been developed which relates ground movements t o soil moisture conditions a t tlie site.
T H E S I T E
The location of the studies is in a drained grassy area on the grounds of t h e Building Research Centre, Montreal Road, Ottawa. Gauges were installcd adjacent t o a single line of elm trees which range from 45 to 60 ft high. The subsoil is a marine clay, called Leda clay, which is common in the Ottawa and St Lawrence River valleys, the geotechnical properties of which have becn discussed by Eden and Crawford (1957). The upper 12-15 f t , where the significant movements occur, is desiccated and highly fissured with the following range of index properties: Yo Water content . . . 30-80 Liquid limit . . . 60-75 Plastic limit
.
.
.
.
.
.
.
.
.
.
.
25-35 Plasticity index . . . 30-50 Shrinkage limit.
.
.
.
.
.
.
.
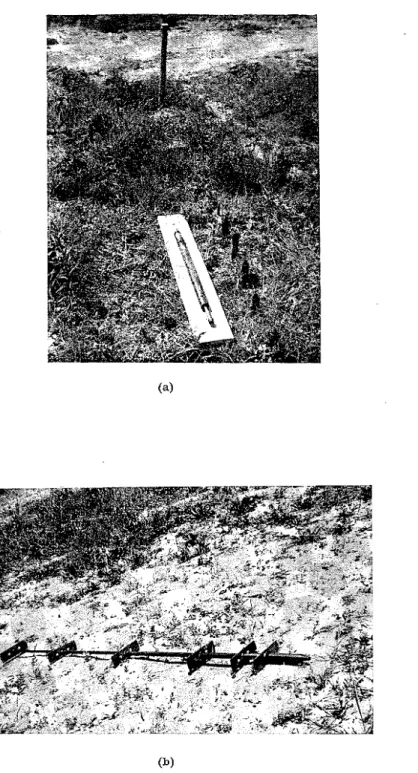
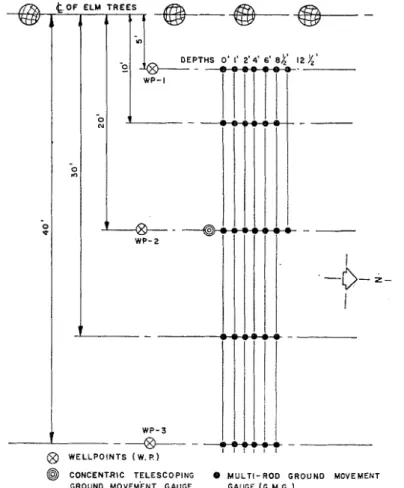
25-30 INSTRUMENTATIONThe iilstrumcntation coilsisted of thirty-two multi-rod ground-movement gauges, one set of concentric telescoping ground-movement gauges, and three well-points located as shown in Fig. 2. The multi-rod gauges (Ward, 1953) shown in Fig. 3(a) are made up of :-in.-dia. pipe, capped a t the lower cnd and set in cased holes t o predetermined depths varying from 0 to 12; ft. Groups of thcse gauges were placed at distances of 5, 10, 20, 30, and 40 ft from the trees. Periodic level surveys of the projecting rods were carried out to measure ground movcments a t various depths.
The concentric telescoping ground-movement gauges shown in Fig. 3(b) (Baracos and Marantz, 1953) coilsist of a series of various length tubes telescoping over each other, with the shorter, larger-diameter tubes on t h e outside. Each tube is fitted with a 3-
x
10-in. horizontal plate which constitutes the foot of the gauge. They are installed in an elliptically shaped hole in sequence from the bottom, around a 15-ft-deep centre rod by turning the plates horizontally into undisturbed soil. The holc is then baclrfilled with soil as close as possible t o its n a t ~ ~ r a l density. Relativc ground mo\~emcnts are obscrved by measuring from the centre rod to the tops of the tubes.Considerable difficulty was experienced in obtaining a good continuous rccord of ground movements from the time the gauges wcre installed until the end of 1957. The most serious problems were caused by the gauges freezing-up in the winter. I n spite of the care taken t o lreep the space between the rod and casing filled with grease, some casings filled with water, froze in the winter, and heaved the gauges from their locatioils b y unknown amounts. Thc foot of the multi-rod gauge has a bearing area of only
2
sq. in. During the wet summer of "1956, the soil appeared to soften allowing the rods to "punch" into the soil under the weight of a survey rod. The concentric gauges were even less satisfactory as thcy began t o jam, due apparently to rusting. It was possible, however, t o malre reasonable corrections b y studying thc timc-vertical movement curves of groups of gauges.
The initial elevations from which the ground movements were measured wcre taken as the highest elevations measured late in the fall and early in the wintcr of 1954-55. Because of the above-noted difficulties, however, the results had become unreliable by the end of 1957. Fortunately, an excellent set of readings was obtained for 1955. Since this was a year of extreme movements the inorc important conclusions of this report are based on these records. Three well-points, located 5,20, and 40 ft from the trees, were set in holes drilled to a depth of 12 ft. Water levels were measured b y the use of a weighted tape and flashlight. The
Fig. 3. Ground-movement gauges used to measure the vertical movements near the elm trees :
(a) multi-rod ground-movement gauge assembly, near installed units; (b) telescoping ground-movement gauge
V E R T I C A L G R O U N D I I I O V E M E N T S N E A R E L M T R E E S 21 well-points, installed late in the summer of 1955, proved to be too shallow to follow the ground- water table t o its maximum depth. Because of the comparatively large volume of water required in the stand pipes t o record changes in water levels, there is some question as to the validity of such measurements in clays. Therefore no correlation of these readings with other measurements was possible.
CLIMATE, SOIL AIOISTURE CONDITIONS, AND GROUND MOVEMENTS
Ottawa is situated in a temperate zone having a mean annual precipitation of 35 in. Most of the significant ground movements occur during the summer months when, as shown by an investigation of rainfall records from May t o September, 1926 t o 1956, precipitation ranges from a minimum of 9.9 in. t o a maximum of 23.3 in. Table 1 compares the 1954-57 summer precipitation and temperatures with the 30-year mean values.
Table 1
Comparison of May-September temperatures and precipitation in Ottawa
Mav 1 2.47 54.5 1 2.66 53.7 1 2.21 58.5 1 2.43 49.7 1 1.63 53.9 Month 30-year mean* Rain Temp. ( i n ) (OF) June J U ~ Y Augu>t Average mean
1
temp. (OF) 62.5 ~ e p t e m b e r Total rain (in.)* 30-year mean, from Central Experimental Farm Records, 1926-56.
i Rain = total monthly precipitation, inches.
1 Tm = mean monthly temperature, O F .
1954
1
1955Raint Tm$ Rain Tm
(in.) (OF)
1
(in.) (OF). - . - ..
3.52 64.3 3.61 64.4 1.65 67.5 2.33 64.0 3.39 68.9 1 5 9 66.3 0.76 74.7
1
3.53 1 . 1 2.56 66.8 3.38 64.2 2.87 71.5 5.32 65.0To correlate seasonal weather conditions with ground inoven~ents, it is necessary to calcu-
1956 1957 Rain Tm Rain Tm (in.) (
1
( i n ) (OF) 6.52 66.7 1.26 6 9 8 0.61 64.9 3.23 58.0/
4.91 55.61
2.38 58.2 15.17I
16.15j
9.87late the soil moisture conditions from weather records. Most soil water is thought to be charged by precipitation, and discharged through evaporation from the ground surface and by transpiration from plants. Some of the factors which affect this evapotranspiration are temperature, wind velocity, duration of sunlight, type of vegetation, relative humidity, and availability of soil moisture. The method used t o evaluate the evapotranspiration is that proposed by Thornthuraite (194S), which includes most of the above factors. - -
I t is assumed that the soil a t the site is fully charged with water after the snow has melted and the frost has left the ground, since the ground-water table is then always at t h e surface. Subsequent soil moisture conditions can be obtained by comparing the water available from precipitation with the water lost by evapotranspiration. At a certain time, usually in May, the rate of water loss by evapotranspiration begins t o exceed the water supplied by precipita- tion. This excess in inches of water is cumulatcd as a measure of soil moisture conditions, as shown in Fig. 4(a) and is termed " soil moisture depletion
".
It differs from Thornthwaite's"soil moisture deficiency" in that no "soil moisture storage" is considered. Calculated in this way, it compares favourably with the measured loss of soil moisture determined from soil borings, as s h o r n in Table 2. However, the computed soil moisture depletion cannot truly
0.91 53.9
1
5.37 60.122 M . B O Z O Z U K A N D K . N. B U I i N
represent soil moisture conditions both at a tree and at some distance from it, but it does represent average conditions and provides a common basis for extending test results to other locations.
In Fig. 4 a reasonable correlation between vertical ground movements and soil moisture conditions is shown. The movements at distances of 5 and 40 ft from the elm trees are plotted against soil moisture depletion of the area for the period 1954-57. During the winter months the soil moisture depletion was zero and relatively little ground movements were observed.
@ CONCENTRIC TELESCOPING O M U L T I - R O D GROUND MOVEMENT GROUND MOVEMENT GAUGE, GAUGE ( G . M . G . ]
Fig. 2. Instrumentation near the elm trees
Movements began when the soil started losing moisture and reached maximum values at maximum soil moisture losses. I n 1956 the maximum soil moisture depletion was 5.1 in., resulting in vertical ground movements of 0.67 and 0-25 in. at the respective distances of 5 and
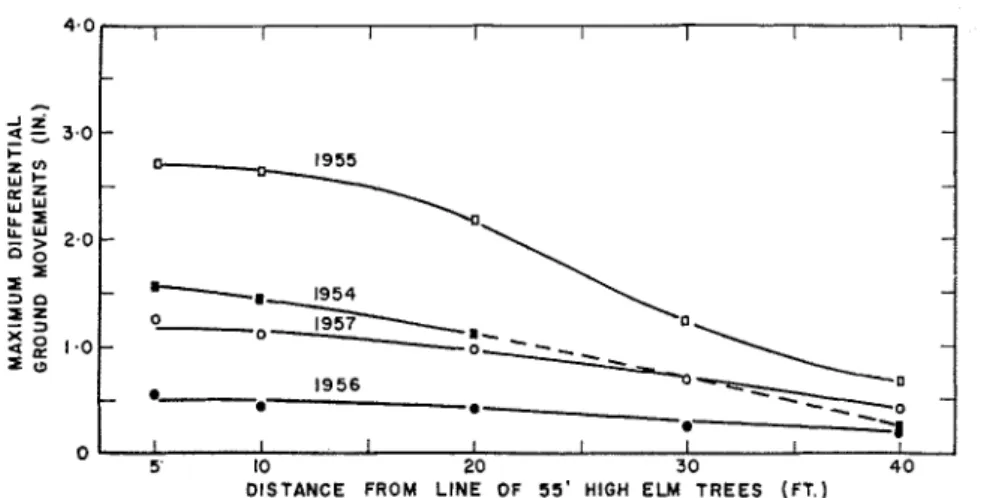
40 ft from the trees at a depth of 1 ft. In 1954 and 1957 the soil moisture depletion was 8 6 and 7.7 in., respectively, producing correspondingly greater vertical ground movements. However, in 1955 a maximum soil moisture depletion of 15.5 in. was reached. The ground movements were observed to be 2-70 and 0.63 in. at the respective locations, illustrating that the magnitude of the ground movements depended upon seasonal weather conditions. The variations in maximum differential ground movements from 1954 t o 1957, at a depth of 1 ft, are shown in Fig. 5.
V E R T I C A L G R O U N D J I O V E M E N T S N E A R E L M T R E E S 23
The ground-water table also reflected the seasonal weather conditions. From 21 July to
27 September, 1955, it was more than 12 ft deep. In 1956 and 1957, the lowest observed water-table was 4 ft 2 in. and 10 ft 3 in. deep, respectively. At the end of the rainy season each autumn or early winter, and at the end of thaw in early spring, it was observed to be at the ground surface.
GROUND MOVEMENT VARIATIONS WITH DEPTH AND DISTANCE
During 1955, the computed soil moisture depletion was 15.5 in. of water. This was the driest year since 1931, when the depletion was 13.4 in. The maximum ground movements at
w - -
0
I2 - -
3 4 la1 SOIL MOISTURE CONDITIONS COMPUTED
I - FROM WEATHER RECORDS -
3 16 I
i O 20.5
4 ( c l GROUND MOVEMENTS
2 1.0 1 4 0 FT. FROM 5 1 FT. H I G H ELM TREES)
0
-
Z-
-
V)I
9 2 0 3z
3Fig. 4. Seasonal variations in moisture conditions and vertical ground movements in Leda clay soil at the Division of Building Research, National Research Council, Ottawa
-
I --
DEPTH SYMBOL 1- - 4 ( b l GROUND MOVEMENTS - 4'-
1 2 . k ' --- -
(a) Soil moisture conditions computed from weather records; (b) Ground movements (5 ft from 55-ft-high elm trees); (c) Ground movements (40 ft from 55-ft-high elm trees)
various depths during 1955 are shown in relation to distance from the trees in Fig. 6. Within a horizontal distance of 20 ft from the trees, the movements at or near the ground surface were quite large. The movements diminished rapidly with distance until a t 40 ft they were rep- resentative of the values in a grass plot nearby. They also diminished with depth but even at a depth of 129 ft, movements greater than in. were observed 20 ft from the trees.
From the curves of Fig. 6, a chart was prepared showing the variation in ground movements with depth in relation to the ratio of distance from the trees to height of trees. Shown in Fig. 7, it could be used as an aid in designing lightly loaded, shallow foundations in Leda clay soils near large elm trees. Knowing any two of the three variables: ( a ) depth of foundation; (b) allowable ground movements; (c) distance between tree and structure, it is easy t o solve for the third.
I t should be noted that these curves apply to one particular situation only and will there- fore suffer from the usual discrepancy associated with the extrapolation of empirical data. They do, however, portray extreme conditions and may therefore be a useful guide in design. Field observations have illustrated good correlation for actual cases in Ottawa.
24 M . B O Z O Z U K A N D K . N . B U I ~ X
RELATIONSHIP BETWEEN GROUND MOVEMENTS AND SOIL MOISTURE CONDITIONS
To understand more fully the causes of ground movements and to permit of the applicatio~l of observations in one area to problems in another, an attempt has been made to obtain a relationship between ground movements and soil moisture conditions. The observed ground
Table 2
Comparing loss of soil moisture by field measurement with soil moisture depletion
Dates Distance from trees: ft Depth: ft d e n s ~ t y "14. of soil: lb/cu. ft SMD' in. April-19 September, 1955
.
.
Change in % moisture content1
sum 14.8 Loss of soil water: in.-
-
-April-20 July, 1955. .
.
.
1
sum 10.0 April-29 October, 1956. .
.
sum 4.8 24.0 2.8 0.9* S M D = Soil moisture depletion calculated from weather records.
A'ote: The soil borings did not extend t o the maximum depths a t whicli ground movements were ob- served. However, neglecting the loss of soil moisture from these greater depths where the moisture content changes appear t o be small would result in only a slight increase in the totals shown.
movements at various depths werc plotted against the empirical soil moisture depletion in inches of watcr as shown in Fig. $(a) for a location 5 ft from the trees. As it was impossible to show all the points, they are also given in Table 3. The ground movcments appeared to follow a shallow curve at first changing abruptly to a series of stcep curves. The location of these intercepts appearcd to depcnd on depth, that is at the greater depths it occurred a t greater losses of soil moist~ue. Although the esact nature of thc ground inovcmcnts are not understood, it is deduced that the shallow curve reprcsenting "minor" ground movements is the result of elastic compressioil due to the increase in effective stresses in thc soil as the ground-water table lowers. The steep curves showing much greater movements, with equal increments of soil moisture depletion, are thought to be caused by soil shrinkage and are
V E R T I C A L G R O U N D M O V E M E N T S N E A R E L M T R E E S
Table 3
Settlements in inches near elm trees, 1955
S M D = Soil moisture depletion in inches of water. Dis. = Horizontal distance from trees in feet.
2 8 ---- 0.45 0.12 0.00 0.00 _ _ _ _ 0.00 --- -0.04 ---- 0.01 0.00 0.02 0.00
----
0.04 0.00 0.03 ---- 0.05----
0.03 - 0.05 0.03 0.03 0.02 ---- 0.03 Gaugc 16-3 0.01 0.00 0.00 0.00 0.00 0.00 0.00 0.00 0.00--
0.00 0.00 0.01 0.01 0.00 0.00 0.00 0 1 2 Date D e gD is. h : y 5 10 20 30 40 5 10 20 30 40 5 10 20 30 1 0 11-5 1.18 0.13 0.08 0.02 0.11 0.05 0.10 0.00 --- 0.12 0.00 0.05 0.00 0.00 0.01 0.00 0.01 --- -0.00 --- 0.00 PP--- -0.00 0.00 inoperative 6 -- 8 ,l 124 1 0.00----
0.00 ---- 0.00-
0.00 0.00 0.00----
0.00 0.00 0.00 0.00 0.01 0.00 5 10 20 30 40 5 10 20 30 40 5 20I
0.02 9-61
3.38 0.50 0.25 0.32 0.21 0.26 0.25 0.17 0.14 0.11 0.13---
0.18 0.19 0.12 0.07 0.07 0.06 0.07 0.08 0.12 10 20 30 40 24-6 1.72 0.82 0 . 6 2 l . 0 4 --- 0.37 0 4 2 0.36 0.58 P------- -0.53 0.37 0.29 0 . 2 2 0 0 . 3 8 0.18 C _ _ - - -0.53 0.31 0.19 0.13 0.29 0.26 0.18 0.24-
0.06 0.06 0.08 0.06 0.06 0.05 0.05 0.07 0.05 0.08 0.02 0.01 0.00 0.00 0.01 0.00 0.00 0.00 0.00 0.01 0.03 0.00 0.00 0.00 0.01 O M 0.18 0.17 0.18 0.10 - - - _ _ _ -0.12 0.17 0.17 0.16 0.10 0.13 0.12 7-7/
7.27-
-
-
-1.21 0.92 0.65 0.55 0.95 0.90 0.71 - _ _ _ _ _ _ 0.53 0.8S 0.86 0.61 0.37 0.23 0.46 0.53 0.37 0.34 - 0.02 0.03 0.02 0.03 0.05 -- 0.03 0.02 0.02 0.04 --- 0.00--
0.03 0.01 12-8 11.89 2.21 2.02 1.72 1.10 0.67 2.03 1.91 --- 1.57 0.90 0.59 1.95 1.86 1.40 0.72 0.11 --------
1.45 --- 1.07 0.59 ----
19-7 - _ _ _ _ 9.39 1.62 1.12 1.16 - _ _ _ 0.81 --- 0.66 ----pp 1.32 1.26 1.02 0.70 -----P 0.18 1.24 1.21 -----P 0.90 --- -0.50 - - _ _ _ 0.29 0 . 9 2 l . 6 2 0.82 0.60 ---- -0.38 - 0.38 0.32 0.29 0.16 0.17 _ _ _ _ - _ _ . - - _ _ _ 0.25 0.21 ___ - p - __ __ __ __ _p 0.16 --- 0.14 0.17 0.18 ~ ~ - - - - ~ ~ ~ -1.36 1.19 0.83 0.35 0.17 0.92 0.82 0.48 0.29 0.18 0.24 0.07 -----P 0.68 ppp-p 0.59 0.13 - - _ _ _ 0.17 0.12 0.36 ----pp 0.31 0.23 0.12---
0.12 -----ppp 0.16 0.23 16-9 14.74 2.76 2.65 "-21 1.37 0.76 2.60 2.52 2.09 1.20 0.61---
2.52 2.47 1.94 1.01 0.44 2.22 2.03 1.57 0.83-
3-10 15.19 2.86 2.77 2.29 1.37 0.76 2.70 -- 2.64 2.16 1.22 0.64 2.63 2.59 1.99 1.07 0.47 2.34 2.15 1.67 0.89 1.92 1.74 1.30 0.52 0.19 1.46 1.32 0.85 0.36 0.18 0.40 0 ~ l o 0 ~ 1 6 2.06 1.87 1.39 0.58 0.24 1.62 1.48 0.95 0.41 0.24 0.56 0.13 0.16 0.5526 M . B O Z O Z U I < A N D K . N . B U R N
called "major" ground-movement curves. For any given distance from the trees, when the ground movements had passed from "minor" to the "major" stage, the curves attained similar slopes, becoming parallel t o each other. This indicates t h a t the relationship between settlement and soil moisture depletion had then become constant. The settlement was naturally observed to decrease with increasing distances from the trees.
2.0 I- 1.0
-
0 ---
1956-
-0A.
I I I I I I I , 10 20 30 4 0DISTANCE FROM LINE OF 5 5 ' HIGH ELM TREES (FT.)
Fig. 5. Maximum vertical ground movements at I-ft depth near 55-ft-high elm trees in Leda clay soil, 1954-57
DISTANCE FROM TREES ( FT.)
Fig. 6. Variation with depth of the maximum differential ground movements near the 55-ft-high elms in 1955
If, for a given depth, the variations in ground movements with distance from the trees are 1
plotted against soil moisture depletion, curves as shown for the 2-ft depth in Fig. 8(b) are obtained. When the depletion is small, the amount of settlement is small, falling into the "minor " category. In the "shrinkage " range, the curves have different slopes depending on distance from the trees, but converge towards a common intercept at the "shallow" curve. The location of the intercept depends on depth, and is a constant for all distances from the trees for this site. This supports the contention t h a t the water t h a t is lost from the soil above a particular depth causes a lowering of the ground-water table resulting in a n "elastic"
V E R T I C A L G R O U N D M O V E M E N T S N E A R E L M T R E E S 27
compression of the soil below. Additional moisture losses are drawn from the soil below the particular depth resulting in "shrinkage" of the soil and an increased rate of settlement.
Combining curves of the type shown above and using statistical analysis the best average "minor " and "major" ground-movement curves are obtained showing the relationship between ground movement and soil moisture depletion near the trees as illustrated for two depths in Fig. 8(c). With a complete set of curves it is possible to determine graphically the ground movements at all depths and distances from the trees for any soil moisture condition.
M O V E M E N T S SHOWN IN
INCHES
!
4
0
1 1 J
0 . 2 0 :4 0 . 6 0 . 8 1.0 R A T I O : R = DISTANCE FROM TREES
H H E I G H T O F TREES
S T H I S CHART WAS BASED ON MEASUREMENTS NEAR 5 5 FT. HIGH ELM TREES IN 1955 FOR A SOIL MOISTURE DEPLETION OF 15.2" OF WATER
Fig. 7. Variation in vertical ground movements near trees in Leda clay soils at the National Research Council, Ottawa
Plotting the intercepts of the "minor" and "major" ground-movcment curves against depth of gauge in Fig. 9 gives a curve which shows the soil moisture depletion limits for "minor" ground movements. If soil moisture losses at a given depth exceed the limiting values indicated by the curve, thc ground movements would come into the "shrinkage " range
due to the removal of soil moisture from below that depth. The curve is therefore a rep- resentation of the amount of free water stored to the various depths at the site. Attempts are being made to correlate this curve with ground-water table changes.
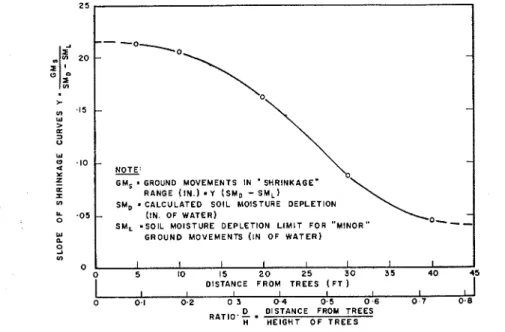
If the slopes of the"major" ground-movement curves, that is, vertical-ground-movement/ soil-moisture-depletion are plottcd against distance from trees or against the ratio of distance
M . B O Z O Z U K A N D K . N . B U R N 2 . 0 , , . \ , , , , , , , , , I , 0 2 4 6 8 10 12 14 16 S O I L - M O I S T U R E D E P L E T I O N (IN. OF WATER) S O I L - M O I S T U R E D E P L E T I O N (IR OF WATER1
Fig. 8 (a) Effect of soil moisture depletion on ground movements a t the indicated depths, 5 f t from the elm trees, 1955;
(b) Effect of soil moisture depletion on ground movements a t indicated distances from the trees, a t a depth of 2 ft, 1955;
(c) Computed relationship between ground movements and soil moisture depletion f o r depths 0 and 6 ft, 1955.
V E R T I C A L G R O U N D M O V E M E N T S X E A R E L M T R E E S
Fig. 9. Soil moisture depletion limits ( S M L ) for "minor" ground movements
to tree height, the slopes decrease with distance as shown in Fig. 10. They would also vary for different soils, type of vegetation and location. Ward (1953), in measuring vertical ground movements in grass plots, obtained different values for the ratio of change in soil moisture storage to corresponding vertical ground movements at three different locations in England. 16 0 1 0 1 1 1 1 1 1 1 1 1 I I I I
-
--
- O y 0 2 0 - .I5-
A.
. I 0 - NOTE: (IN. OF WATER)\
GMS = GROUND MOVEMENTS IN ' SHRINKAGE'
RANGE (IN.) . Y ( S M D
-
s M L )SMD
.
CALCULATED SOlL MOISTURE DEPLETION. 0 5
-
GROUND MOVEMENTS (IN OF W A T E R )
SM, .SOIL MOISTURE DEPLETION L I M I T FOR "MINOR"
S M D = S O l L M O I S T U R E D E P L E T I O N (IN. O F W A T E R ) 2
-
t'
4 --
W a2
6 - a ~r 0 s 8 - I- n W -a 0 1 0 - N 12 1 4 0 I I I I I I I II
5 10 15 2 0 2 5 3 0 3 5 4 0 45DISTANCE FROM TREES 1 F T 1
I I I I I I I I
0 0.1 0 . 2 0 3 0 . 4 0.5 0 . 6 0 7 0 . 8
RATIO, D
.
DISTANCE FROM TREESH HEIGHT O F T R E E S - -
-
-
- - - O\ --
\
M L = 1.655 t 0,887 £ --
-
R A N G E O F "MINOR" O \ G R O U N D M O V E M E N T S \-
is, W H E R E GM, ~ 0 . 0 2 2 S M o \ \-
\ - - '\ \-
-
-
1 1 1 1 1 1 1 1 ' 1 1 1 1 1 1 0 2 4 6 8 1 0 12 1 4Fig. 10. Variation in slope of "shrinkage" curves with horizontal distance from 55-ft-high elm trees
30 M . B O Z O Z U I < A S D K . S . B U R S 3
With the curves of Figs 9 and 10, it is possible to calculate the ground movements at ally depth, distance from trees, and soil moisture conditions at this site. Substituting equations for these curves and combining them algebraically, it is possible to develop a statistical solu- tion for ground movements from the soil moisture conditions (see the Appendix).
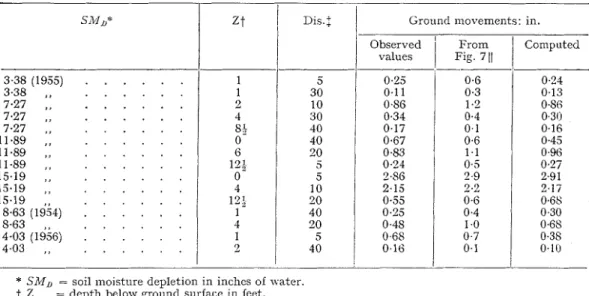
Table 4 was prepared in order to compare the ground movements computed from the chart in Fig. 7 and from the curves of Figs 9 and 10, or their statistical equivalents, with observed ground movements for various soil moisture conditions. The values computed from the curves agreed closely with the observed ground movements for various values of soil moisture deplc- tion in 1954 and 1955. The greatest errors occurred in 1956, the wet year. The values obtained from Fig. 7 agreed quite well with those observed a t the high values of soil moisture depletion. At the low values the calculated ground movements were generally larger than the observed. This results from the incorrect assumption that ground movements were directly proportional to soil moist~u-e depletion.
Table 4
Comparison of computed ground movements, and those obtained from the chart in Fig. 7, with observed values
Ground movements: in.
* S M D = soil moisture depletion in inches of water.
7 Z = depth below ground surface in feet.
:
Dis. = horizontal distance froni trees in feet.11 Assuming the ground movements are in proporti011 t o the soil moisture conditions based on the 1955 moisture depletion of 15.2 in. of water on which the chart mas prepared.
CONCLUSIONS
1. The multi-rod gauges used to measure the vertical ground movemeilts near the trees gave fairly good results in the first 2 years, but became unreliable after 4 years. This was due mainly to frost action and to the punching of the rods into the soil. The concentric-type
gauges were less satisfactory. (
2. The chart showing the maximum variations in vertical ground movements near large elm trees in Leda clay soil for 1955 can be used as an aid in the design of shallow foundations and for estimating tree-planting distances for similar site and climatic conditions. As 1955 was an extremely dry year, the fourth hottest on record and driest sincc 1926, the values represent severe conditions.
3. Vertical ground movements, the magnitude of which depends on depth and prosimity t o trees, call be related to "soil moisture depletion", a quantity bascd on weather records.
V E R T I C A L G R O U K D M O V E M E N T S N E A R E L M T R E E S 3 1 These movements appear to occur in two stages. I t is thought that "minor" illovements result when, owing to moisture loss above a paticular levcl in the ground, there is a change in the effective wcight of the soil resulting in an elastic compression of the soil below t h a t level. Shrinkage movements on the othcr hand result from volume changes due to loss of water from the soil below the level of observation.
4. A method of computing ground movements using weather records is give11 and sup- ported by gro~md-movement observations at a particular site.
5. The report is based on measurements taken at one location only. These measurcmcnts will be checlted by a new installation using an improvcd type of ground-movement gauge. Soil moisture contents will be measured and special piezometers will be used to measure ground-water table variations. I t is hoped that, following these checks, new illstallations can be made in other parts of Canada in order to extend this study of g ~ o u n d movements to other conditions of climate, soils, and type of vegetation.
ACKNOWLEDGEMENT
The Authors are indebted to C. B. Crawford, head of the Soil Mechanics Section of the Division of Building Research, for his assistance and direction in this study. The Paper is a contribution from the Division of Building Research, Kational Research Couilcil of Canada, and is published with the approval of the Director of the Division.
REFERENCES
BARACOS, il., a ~ z d M. Bozozurc, 1957. "Seasonal movement in some Canadian claps." Proc. F O Z L Y ~ I L Itzt. Conf., Soil Mech., 1 : 264-265.
BARACOS. -4.. and 0. MARANTZ. 1953. "Vertical ground movements." Proc. Sixtlb Cn?zadin?~ Sozl ilfecl~. Conf., t,Vi?l?zipeg. Nnt. ~ e s . C O Z L ~ Z C . A S S O C . Czee on Soil and S?zo-w ilfeclzanics, Tech. ~ V I ~ J J L . NO. 27, pp. 29-36.
COLLINS, L. E., 1957. "Some observations on the movement of buildings on expansive soils in Vereeniging and Odendaalsrus." Synzposiz~nz O J L expa?zsive Clays, Pt I , Soz~th African Instrz civ. E?zgrs. 7 : 273-255. EDEN, W. J., a?zd C. B. CRAWFORD, 1957. "Geotechnical properties of Leda clay in the Ottawa area."
Proc. Fourth I n t . Conf. Soil iMecA., 1 : 22-27.
ISAACS, D. V., 1952. "Footings for houses, flats and schools." Cornn~orlwealth E x p . Bldg Stat., S9ecial Report No. 8 , Sydney, Australia.
JENNINGS, J. E., 1953. "The heaving of buildings on desiccated clay." PYOG. Third Irzt. C O I Z ~ . S o i l AfecI~.,
1 : 390-396.
SICEMPTON, A. W., 1954. ".2 foundation failure due t o clay shrinl<agc caused b y poplar trees." Proc. I?zstn cio. E*zgvs, 1 : 3 : 66-83.
TASKER, H. E., 1954. "Dcsign of footings for use in Adelaide." Conzvzor~wealtk E x p . Bldg Stat., Special
Refiort No. 16, Sydney. Australia.
THORXTHWAITE, C. W., 1948. "An approach toward a rational classification of climate." Geogr. Rev.,
38 : 55-94.
TORCHINSKY, B. B., 1953. "Foundation movements on highly plastic clays." Proc. S i x t h Ca?zadia~l Soil Mech. Conf., LViizr7.ipeg. A-(it. Res. C O Z ~ C . A S S O C . Cttee on Soil and Snow Mechanics, Tech. Menz. No. 27, pp. 37-45.
WARD, W. I-I., 1947. "The effects of fast-growing trees and shrubs on shallow foundations." J . Inst. Landscape rlrcl~itects, 11 : 7-16.
WARD, W. H., 1953. "Soil movement and weather." Proc. Thivd I n t . Conf. Soil Mech., 1 : 277-288.
Appendix A
3IATHELIATICXL EXPRESSIONS FOR COAlPUTING GROUND iVIOVEBIENTS FROM SOIL MOISTURE DEPLETIONS
Ground movements near trees occur in two stages. When moisture is lost from above a particular level in the ground, there is a change in t h e effective weight of t h e soil resulting in a n elastic compression of the soil below, causing the "minor" ground movements. "Major" movements result from soil shrinkage caused by loss of water from the soil below the level of observation.
T h e curve in Fig. 9 gives the soil moisture depletion limits (SiML) for the minor ground movements and is represented by:
S M L = 1 . 6 j j
+
0.837 Z ..
.
.. .
.
.
. . . .
.
(1)Minor ground movements (GM,) occur when the computed soil moisture depletion (SMo) is less than SML, and is given by:
GMe = 0.022 SMo
. . . .
(2) The major ground movements (GM,) are given by:GMs = ~ ( S M D
-
SML). . .
(3)when SMD is greater than SML determined by equation (1). y is the slope of the ground-movement curves in the shrinkage range which vary with horizontal distance from the trees as illustrated in Fig. 10. An approximate equation of this curve, valid only within the limits of field instrumentation, is given by:
where D = distance from trees (feet) H = height of trees (feet).
The total ground movement (GM1) a t a given depth for a soil moisture depletion greater than SIML from (I)
is given by the sum of equations (2) and (3). That is: GMt = GM,
+
GM8A