HAL Id: hal-02550731
https://hal.archives-ouvertes.fr/hal-02550731
Submitted on 25 Jan 2021HAL is a multi-disciplinary open access archive for the deposit and dissemination of sci-entific research documents, whether they are pub-lished or not. The documents may come from teaching and research institutions in France or abroad, or from public or private research centers.
L’archive ouverte pluridisciplinaire HAL, est destinée au dépôt et à la diffusion de documents scientifiques de niveau recherche, publiés ou non, émanant des établissements d’enseignement et de recherche français ou étrangers, des laboratoires publics ou privés.
Possible control of plasma transport in the near-Earth
plasma sheet via current-driven Alfvén waves (ƒ � ƒ H+ )
O. Le Contel, A. Roux, S. Perraut, R. Pellat, Ø. Holter, A. Pedersen, A. Korth
To cite this version:
O. Le Contel, A. Roux, S. Perraut, R. Pellat, Ø. Holter, et al.. Possible control of plasma transport in the near-Earth plasma sheet via current-driven Alfvén waves (ƒ � ƒ H+ ). Journal of Geophys-ical Research Space Physics, American GeophysGeophys-ical Union/Wiley, 2001, 106 (A6), pp.10817-10827. �10.1029/2001JA900013�. �hal-02550731�
JOURNAL OF GEOPHYSICAL RESEARCH, VOL. 106, NO. A6, PAGES 10,817-10,827, JUNE 1, 2001
Possible control of plasma transport in the near-Earth
plasma sheet via current-driven
Alfvn
waves (f _ fn+)
O. Le Contel
•, A. Roux
•
and A. Korth 4S Perraut • R. Pellat • 0 Holter 3 A. Pedersen 3 Abstract. Two time periods, each covering both quiet and disturbed conditions (growth phase, breakup, and postbreakup phase), are studied. Electric and magnetic field measurements, carried out in the near-Earth plasma sheet (NEPS), are used to
calculate
the two components
(radial
and azimuthal)
of the electric
E x BIB • drift.
These calculations are compared with independent estimates of the ion flow direction deduced from ion flux measurements. During active periods, the two flow directionscoincide to a large degree. Evidence is given for two regimes of transport: (1) During the growth phase, and after the active phase, the electric field (radial and azimuthal)
and hence the azimuthal and radial flow velocities are small in the near-equatorial
region. This is interpreted as the consequence of an electrostatic field that tends to shield the induced electric field associated with time-varying external conditions. (2) During active phases (breakup and pseudobreakup), however, large-amplitude
bursts
in E x B/B e radial and azimuthal
components
(interpreted
as flow bursts),
with typical velocities
of the order of 100 km s -1, are observed.
The direction
of
these flow bursts is somewhat arbitrary, and in particular, for the two substorm events described here, sudden reversals in the flow direction are observed. Thesefast flow bursts coincide with intense low-frequency electromagnetic fluctuations: current-driven Alfv•n waves (CDA waves) with frequency f _• f•r+, the proton gyrofrequency. CDA waves produce "anomalous" collisions on timescales shorter than the electron bounce period, thus violating the second adiabatic invariant for electrons. As a consequence, the electrostatic shielding is destroyed, which leads to
enhanced radial transport. Thus the transport in the NEPS seems to be controlled by a microscopic current-driven instability.
1. Introduction
The process by which the plasma is transported in the Earth's plasma sheet is critical for an understanding of
plasma sheet dynamics. There is as yet no consensus
about its nature. It is often assumed that the magneto- sphere is in a steady state, with a static magnetospheric
electric field (derived from a scalar potential) driving a
steady earthward "convective" flow, in particular dur-
ing the substorm growth phase. Using Geotail data, Nakamura et al. [1994] have conducted a survey of slow
and fast flows. While slow flows (IV I < 300 kms -•)
1Centre d'Etude des Environnements Terrestre et Planetaires,
V•lizy, France.
2Commissariat • l'l•,nergie Atomique, Paris, France. 3Department of Physics, University of Oslo, Oslo, Norway. 4Max-Planck-Institut fiir Aeronomie, Katlenburg-Lindau,
Germany.
Copyright 2001 by the American Geophysical Union.
Paper number 2001JA900013.
0148- 0227/01 / 2001J A900013509.00
were observed most of the time, with no preferred direc-
tion, transient
bursts
of fast flows
(IVI > 300 kms-1),
are essentially radial with a higher occurence rate earth-ward (at least inside
of 25 Re, Re being the Earth
radius). Angelopoulos
et al. [1992]
have
also
analyzed
these fast flow bursts and termed them bursty bulk flows (BBFs), suggesting that most of the radial flux transport in the plasma sheet could be accomplished by
these short-duration, intense flow bursts. These mea-
surements are consistent with what Kennel [1995] called
a bimodal plasma sheet flow, to stress the difference between the morphology of fast and slow flows. The standard convection models, based on constant elec-
trostatic electric fields, do not describe this complex
bimodal regime and are not consistent with the corre-
sponding high temporal variability. Thus "one wonders
if steady
uniform
convection
has
ever
been
found"
[Ken-
nel, 19915, p. 22]. In the present paper we show that
there are two regimes of transport in the near-Earth
plasma sheet (NEPS), and that the level of ultra low- frequency (ULF) fluctuations, at frequencies of the or- der of the proton gyrofrequency, seems to control the
transition between these regimes.
10,818 LE CONTEL ET AL' POSSIBLE CONTROL OF PLASMA TRANSPORT
The
correlation
between
ULF waves
at f _• fH+ and
• •0o
breakup
has been
reported
by Lui et el. [1990,
1992],
• so
Perreut
et eL [1993]
and Shinohere
et el. [1998]
Lui et
_• •o
al. suggested
that
the
waves
they
observed
on
AMPTE/
• •
CCE
result
from
a cross-field
streaming
instability.
Shi-
• -2o
-40nohara
et al. invoked
a lower
hybrid
drift instablity
to
•l
interpret the Geotail data.
In the present paper we investigate the plasma trans- port in the NEPS, by employing data from several in-
struments on board the geostationary satellite GEOS 2.
In section
2 we
compare
the
direction
of the
electric
drift
•
velocity
with
the direction
of the ion velocity
deduced
0.$
from
the
azimuthal
asymmetry
of the
ion
flux.
We
also
<• 0
investigate
the relation
between
the various
substorm
-0.$
phases and the presence/absence of a substantial earth- '•
ward plasma flow across the magnetic field. The rela-
tion between flow bursts and the level of ULF electro-
magnetic fluctuations at frequencies of the order of the
proton gyrofrequency is considered in section 3. In sec-
tion
4 we
propose
a new
interpretation
for the existence
•
of two regimes
of transport
and an explanation
for the
0.$
relation
between
the power
in ULF fluctuations
and
the
•
0
plasma transport. -0.$ 20:10
2. Relation Between Fast Flows and
Substorms
2.1. Observations in the NEPS
GEOS 2 carried complementary instruments for wave and particle measurements. For the present study we use particle data from the energetic particle instrument
(ions from 27 to 400 keV [Korth et el., 1978]), together
with data from the wave instrument, and the fluxgate
magnetometer (for a detailed description of these in- struments, see Knott [1975]). Electric field measure-
ments were made with a double probe consisting of two spheres supported by two wire booms which were sep- arated by 42 m. The magnetic fluctuations were mea-
sured with a triaxial search-coil magnetometer. In the ULF range studied here, one electric and three magnetic
components were measured continuously, in wave form,
from 0 to 11 Hz. Signals lasting much more than one
spin period (6 s) can be considered as quasi-stationary
during one spacecraft rotation; hence two components
of the electric field in the spin plane (essentially the
equatorial V, D plane, V being directed radially out-
ward and D eastward) can be deduced [Pedersen et eL, 1985]. The spin axis is essentially along the H axis, perpendicular to the V, D plane which approximately
coincides with the plane of rotation of the electric field antenna. For the present study we have selected two
time periods' (1) January 25, 1979, from 2010 UT to
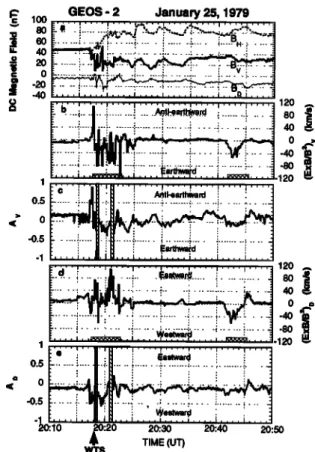
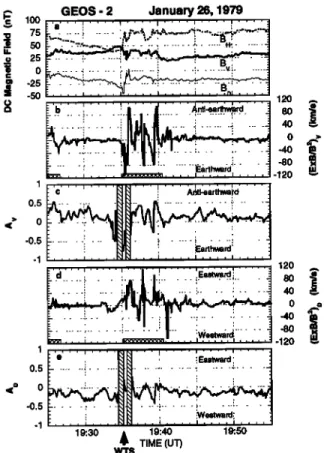
2050 UT (Figure la), and (2) January 26, 1979, from 1925 UT to 1955 UT (Figure 2a). Figures la and 2a
display the three magnetic components BE, By, and
BD. The substorm onset time at GEOS 2 is defined
by the start of the increase in the magnetic BE compo-
GEOS - 2 January 25, 1979 '•' ' • .... ! .... •'•,' ' :.: .... .'.•4' ' ' ' ' ' ':-• .... ... ! ... ;i•;.;:',*.' I- - :. -, :-. • ::. ~ .::- !-- -'-'--'--J,.,.zl•:-- -!-:'---,,, ;, i .... , .... , .... •.,,, .... , .... • ... 120
...
! . i .: ; " : ....
i
0
-120 I- .... I ' '.'1•' I •1' ' , I .... I .... I .... I .... I .... - ... i ... •;¾•,•;•' ... i ... i ... • .... , .... , .... • .... , .... , .... , .... • ... 120 [..d....• ... '•l, ... : ... •,.,.•,•..• ... • ... • ... J so -80 .12o 20:20 20:30 20:40 20:50 • TIME (UT) WTSFigure 1. January 25, 1979: composite view showing
(a) three components
(By, BD, BE) of the magnetic
field, (b) the radial V component of the electric drift, (c) Av, the azimuthal asymmetry in the energetic ions flux projected along V, (d) the azimuthal D component of the electric drift (e) Av, the azimuthal asymmetry in the energetic ions flux projected along D. Figures lc
and le display shaded areas which indicate problematic
data (see
text for more
details
(subsection
2.5)).
nent. The increases occur at 2018 UT for event 1 and
at 1935 UT for event 2. The change in the magnetic configuration is also characterized by fast variations in
the other magnetic components. For event I the By component starts decreasing at about 2017 UT, I min
before the start of the increase in BE (2018 UT). For event 2 there is an intensification in the By (to more
positive) and BD (to more negative) components, at
about 1933-1934 UT, about I or 2 min before the sharp
increase in BE (1935 UT). The general field and parti- cle behavior for these two events is described by Roux
et al. [1991] (event 1), and by Pertaut et el. [2000] (both
events).
2.2. Observations Near the GEOS 2 Magnetic Footprint
The two periods quoted above were selected because
all-sky camera pictures from two ground stations, Kevo
and Kilpisj/•rvi, respectively, located east and west of
the magnetic footprint of GEOS 2 (as calculated from Tsyganenko T87 model for Kp = 3), were available
LE CONTEL ET AL.' POSSIBLE CONTROL OF PLASMA TRANSPORT 10,819 •, GEOS - 2 January 26, 1979 • 1001:'a' ' ' ' .... ' .... "o 75 ... • ... '.*---".'-•-"-%",-,,---'• ... J.-• .... -"'• •_ • ... ._• o • -25 • -50 1 0.5 0 -0.5 -1 1 0.5 0 -0.5 -1 120
-40
-80 -120 120•o
-80 -12019:30 •
TIME (UT)19:40
19:50
WT$Figure 2. Same as Figure 1 for January 26, 1979.
with a 20 s time resolution (see Roux et el. [1991] for event I and Perreut et el. [2000] for event 2). By com-
bining the optical observations from these two stations,
it could be shown that before 2017:40 UT there was
only a quiet arc in the (clear) sky for event 1. The ex- plosive intensification of the first arc occurred at about
2018 UT (see arrow on the bottom of Figure 1), and de- veloped as a westward traveling surge (WTS). Event 2,
at 1935:20 UT, is more complex because it was preceded by a weaker substorm at about 1917 UT. However, a tail-like configuration was recovered at 1930 UT, and a quiet arc was observed on the ground from 1930 UT to 1935:20 UT. The explosive intensification occurred be- tween 1935:20 UT and 1936 UT (see arrow on the bot-
tom of Figure 2), when a newly formed WTS reaches
the GEOS 2 footprint. The coincidence between the start of the brightenings of the WTSs, on the ground, and the magnetic signatures of the current disruption at GEOS 2 suggests that GEOS 2 was very close to the
substorm onset regions. 2.3. Electric Drift Velocity
With the double probe on GEOS 2, the direction and
the amplitude of the electric field, projected onto the spin plane, can only be obtained for signals with char-
acteristic time of variation longer than the spin period.
During the most active phase of substorm breakup, however, this standard method may fail because the
level of fluctuations within a spin period may become
as large as, or even larger than, that of the quasi-steady
electric field. For these short time intervals it was nec-
essary to estimate the quasi-dc E field by filtering out
higher frequency fluctuations.
The electric drifts thus obtained are shown in Fig- ures I and 2 for the two events under consideration, respectively. Figures lb and 2b show the radial com- ponents, and Figures l d and 2d show the azimuthal components of the electric drift. The drift velocities are small before and after the two substorms events, except for short periods around 2043 UT for event 1 and around 1926 UT for event 2, respectively. We will return to these two short periods in section 3. Apart from these two short periods, large values of the elec- tric drift velocity are only found during the breakup, that is, between 2017 UT and 2022 UT for event 1, and between 1935 UT and 1941 UT, for event 2. In both cases, flow reversals are observed. For event 1 the drift changes from antiearthward to earthward and from westward to eastward around 2018 UT, when the first WTS is observed. Around 2021 UT the velocity is directed strongly earthward and eastward, when a sec-
ond discrete auroral form is observed near the GEOS 2
footprint [Roux et el., 1991]. For event 2 the electric drift changes from earthward to antiearthward (with a weaker eastward component) around 1936 UT, and
keeps reversing sign until 1941 UT. For both events
the maximum electric drift velocities are of the order
of 100 kms -•.
2.4. Azimuthal Asymmetry in the Ion Flux The full determination of the ion velocity requires an
integration over the whole distribution function; it is,
however, not possible for the present events to carry out
this computation, because the azimuthal distribution of low-energy ions is not available. Yet, some information
can be extracted from the modulation in the flux of en-
ergetic ions perpendicular to the magnetic field [Walker
et el., 1976; Mitchell et el., 1986]. In a detector head mounted perpendicular to the magnetic field on a spin-
ning spacecraft, the azimuthal asymmetry (AA here- after) can be due to (1) an E x B drift flow or (2) an
ion pressure gradient. Both effects result in azimuthal flux modulation of the integral ion flux while the space- craft rotates. When the differential fluxes (as function
of the energy) are available, the two effects can be dis- tinguished because they have different energy depen-
dence for the AA. Since the effect of the electric drift
is energy independent, the modulation is more easily
observed for energies below the thermal energy, which for ions is typically 10-20 keV at the GEOS 2 orbit.
Conversely, the AA associated with a pressure gradient (and hence with a diamagnetic current) varies with the particle energy because it depends on the ratio rL/Lp
between the ion Larmor radius rL and the pressure gra-
10,820 LE CONTEL ET AL.' POSSIBLE CONTROL OF PLASMA TRANSPORT
ion velocity, the AA driven by a pressure gradient is a priori more easily detectable for the most energetic ions. Thus it is possible, in principle, to distinguish between the two effects on the basis of the energy dependence of
the AA [Mitchell et el., 1986]. On GEOS 2 the AA in
the differential flux of energetic ions was measured from
27 to 400 keV, with a time resolution of I min. Thus the distinction between the two types of drift can be made. In the present paper, however, we are concerned with perturbations with a timescale shorter than I min.
Therefore we have used the integrated flux (above 27
keV), which is measured every 5.5 s. Yet, we will see
in section 2.5 that it is possible to identify the source
of the asymmetry by comparison with measurements of
the electric field.
Some of the previous studies, based on the guiding
center approach, investigated the asymmetry of the en- ergetic ion flux in the D direction to determine the motion of the trapping boundary [Welker et el., 1976; Seuveud end Winckler, 1980] or the location of the
acceleration region [Ohteni et el., 1992]. The guid-
ing center approach, however, does not allow a study
of motions which are too fast; the characteristic time
T½ •_ 2rL/Vav (vav, being the average velocity of the
flow) has to be longer than the time resolution of the
measured flux. With an average energy of ions of 30 keV and the time resolution of the ion integral flux being 5.5 s, we obtain an upper limit for the velocity equal to 90
km s -1 . The electric drift, measured here, can reach 120
km s -1 and therefore exceeds the above limit. Further-
more, it is difficult to study the radial plasma motion
from the AA of the ion flux in the D direction, due
to the important effects of the radial pressure gradient as discussed above. Indeed, by studying the substorm
growth phase from the same kind of data, Pu et el.
[1992] showed that the diamagnetic velocity associated
with the ion pressure gradient is generally directed west-
ward and dominates the effect of the electric drift. Con-
versely, they found that the pressure gradient in the D direction (east/west) is small and gives a negligible diamagnetic velocity. Similarly, the magnetic-curvature
drift, which amounts to several kilometers per second in the D direction, is negligible in the V direction.
Aboard GEOS 2 the ion flux, integrated between 27
and 400 keV for pitch angles •_ 90 ø (between 60 ø and 120ø), is measured in 18 bins of 20 ø each, with a time
resolution of 5.5 s. We have projected the ion flux measured perpendicular to the magnetic field in each azimuthal bin along the V and D directions, respec- tively, and summed the corresponding contributions within each spin. We refer to the fluxes of particles
coming from positive and negative V (D) direction as Fv+ and Fv- (F•)+ and F•)_), respectively. We de- fine the asymmetry in the V (D) direction as Av -
- +
+ Fv_) /2]).
Figures lc and le show Av and Av, the AA in the flux of energetic ions projected in the radial and az-
imuthal directions, respectively, before, during, and af- ter the substorm on January 25, 1979. During the
growth phase, from 2010 UT to 2017 UT (the growth phase started at 1930 UT), there is a weak AA antiearth-
ward and westward. As discussed above, this AA is likely to be due to a spatial gradient in the energetic ion pressure, at least for the westward component that could correspond to an earthward pressure gradient
(i.e., more ions with guiding centers earthward than antiearthward). The typical scale of this gradient is Lp -,• 5 - 10 rL, corresponding to a few thousand kilo- meters [Pu et el., 1992]. Taking into account that the
magnetic field configuration is highly stressed during the substorm growth phase, such a gradient is expected, and supports the westward directed tail current. Dur-
ing the active period (2017 UT to 2022 UT), Av and
AD are highly variable both in magnitude and direc- tion, and are I order of magnitude larger than during the growth phase. The largest values are along V, with a reversal in the direction at about 2018 UT. During the active period the AA varies from -0.5 to 0.9.
Figures 2c and 2e show the radial and azimuthal pro- jections of the AA for event 2. During the growth phase
(before 1935 UT), Av and AD are more disturbed for
event 2 than event 1. This is to be expected because for
event 2 another substorm occurred earlier at 1917 UT.
As for event 1, after 1935 UT, Av, and to a lesser extent AD, present oscillations with large amplitudes typically
5 times larger (for Av) than during the growth phase.
In the next section we compare the AA variation in the V and D directions with the drift velocity deduced from
E field measurements.
2.5. Comparison Between Electric Drift and
Ion Flow Directions Deduced From Azimuthal
Asymmetry
Assuming that the ion distribution function is a shifted Maxwellian with an average velocity v•v, the AA is re- lated to the ratio Vav/Vth. The sign of the asymmetry gives the direction of the flow and can be compared
with the measured electric drift. Figures I and 2 show
that the AA of the integral ion flux, projected along V (Figures lc and 2c), exhibits the same variations as
the V component of the drift during the active phases
(Figures lb and 2b). The AA along D (Ao) is more
disturbed and seems to be shifted westward, as com-
pared to the corresponding electric field component, for
both events I and 2 (see Figures ld, le, 2d, and 2e). As
suggested above, this shift is likely to result from earth- ward directed pressure gradients. The laxge-amplitude
fluctuations of AD during the active phase, however, show the same kind of behavior as the projection, along
D, of the electric drift velocity. Given the uncertain-
ties in the two types of measurements, the agreement
is reasonably good. This comparison suggests that the flux asymmetry, described in the previous subsection is mostly associated with rapidly varying electric drifts, at
LE CONTEL ET AL' POSSIBLE CONTROL OF PLASMA TRANSPORT 10,821
least during the active periods. Therefore during active
periods and only on short timescales (timescales corre- sponding to large electric field bursts), the flow velocity
is given by the electric drift.
The AA displayed in Figures lc, le, 2c, and 2e con- tains short periods, indicated by shaded areas, where
data are contaminated by large parallel flows. For
instance at early breakup (event 2), during the first minute (1934-1935 UT), Av becomes sharply negative
twice during a few tens of seconds, before E x B changes.
Careful examination of the data shows that this early
increase in A v is an artefact. In order to improve the statistical significance of the measured AA, we have in-
tegrated the flux over a relatively wide pitch angle range (60 ø- 120 ø ) in each azimuthal bin. This procedure is
valid as long as the pitch angle distribution is relatively
fiat around 90 ø . This was indeed the case, except for
short time intervals (a few tens of seconds), in particular
between 1934 and 1935 UT, when the ion distribution
has a strong pitch angle anisotropy corresponding to
magnetic field-aligned earthward flowing ions. In order
to confirm the above interpretation, we have plotted
the AA (not shown) over a narrower pitch angle range (80 ø- 100 ø). During periods of strong parallel ion flows,
noted by shaded areas in Figures I and 2, the AA ob-
tained with a narrower pitch angle range is indeed quite different from what is obtained with a wide pitch angle.
Hence these periods have been excluded, as suggested by the shaded areas. As indicated above, this reduction in the pitch angle range, however, leads to an increase
in the statistical fluctuations of the flux.
The electric drift V E can be used to estimate, via
a simple model, the AA this flow can produce. For a
MaxwellJan ion distribution the modulation A of par-
GEOS - 2 January 25, 1979 140 120
lOO
8040
2O 0 10 -• .... - • 10 '3 .o i-'-•
'
. V:
• : , (U 20:i(• 20:20 20:30 20:40 20:50•i,
TIME
(UT)
WT$
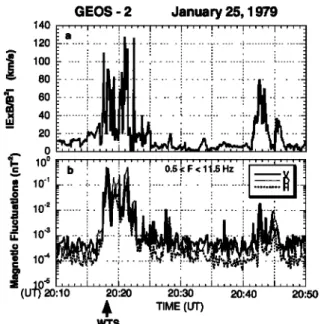
Figure 3. For January 25, 1979, (a) the modulus of the electric drift velocity Vr, - ExB/B 2 and (b) the power
of the current-driven Alfv•n (CDA) waves, integrated
between 0.5 Hz and 11 Hz.
ticles with velocity V0 for a drift flow velocity VE can
be written A -= 2tanh(2VEV0/Vt•
). With a tempera-
ture 1/2mVt• - 10 keV, the rate of modulation
of the
flux of 1/2mV•- 30 keV ions with velocity •, in the presence of a 100 km s -1 electric drift velocity, is given
by A- 2 tanh(2VEV0/Vt•
) - 2tanh(0.25)
~ 0.5, which
fits with the observed modulation. Thus, even if VEis small, the AA can be quite large.
Thus the radial ion flux modulation observed during
the active phase can be accounted for by a radial elec-
tric drift velocity. The agreement between the two dif-
ferent evaluations confirms the existence of large tran-
sient flows during the active phase. Even if flow bursts can be found in any directions, the earthward direction prevails, on average, at least for event 1. Thus in the
NEPS the earthward transport essentially occurs dur-
ing the active phase, at and just after the substorm
onset. Before breakup, during the growth phase, the
electric field is usually weak, and the radial transport
in particular, if any, is slow.
3. Relation Between Fast Flows and
ULF Turbulence
The results presented in the previous section suggest
the existence of two regimes of transport: (1) a slow transport during the growth phase and (2) a fast tran- sient transport, during the active phase, at and just af-
ter the substorm onset. In the present section we inves-
tigate the possible relation between the plasma trans- port and the ultra low-frequency (ULF) waves which are regularly observed during the active phase of substorms [Pertaut et al., 1998, 2000]. Given that these waves are
associated with magnetic signatures of small-scale cur-
rents, we call them current-driven Alfv•n (CDA) waves [Pertaut et al., 2000].
Figure 3 illustrates the two transport regimes indi-
cated above: Before and after the active phase, the modulus of the electric drift velocity is usually weak
(Figure 3a), while during the active phase from about
2017 UT to 2022 UT, fast flow bursts are observed when
(and only when) the power of the magnetic fluctuations illustrated in Figure 3b (the CDA waves) is large.
For event 2, Figure 4, the behavior of the two curves is also similar, though there is not necessarily a one-to-one correspondence between the peaks in the drift velocity and the peaks in the power of the CDA waves. For events I and 2, as well as for other dispersionless events observed in the NEPS, on GEOS 2, fast flow bursts are
observed during the active phase of substorms, when the
power
of CDA waves
is large,
typically
above
~ 0.1 nT 2.
Notice that the background level is 2 orders of magni-tude below, that is, ~ 0.001 nT 2. Conversely, when the power of CDA waves is weak, the electric field is
small and steady; in particular, the azimuthal compo-
nent ED is small, and therefore the radial transport
is slow. Thus the level of CDA waves seems to corre-
10,822 LE CONTEL ET AL.: POSSIBLE CONTROL OF PLASMA TRANSPORT GEOS - 2 January 26, 1979 140 ... _ , ... • ... I ... ! ... , ... 120
• 100
80 -• 20 1 o ø• lO"
rr lO -s o • lO 4• 10'5 19:30
19:40
19:50
• TIME
(UT)
WTSFigure 4. Same as Figure 3 for January 26, 1979.
that the relatively large drift velocities which do not correspond to a substorm onset, around 2043 UT for event 1 and around 1926 UT for event 2, are also cor-
related with a consistent AA variation (see Figures lc and 2c) and to a relatively high level of the CDA waves (see Figures 3b and 4b). During these short periods
the power in CDA waves, however, is less intense than
during substorms, but still 1 or 2 orders of magnitude above the noise. They do not drive a global reconfig- uration of the magnetic field. They are likely to be associated with smaller-scale (e.g., spatially confined) perturbations, possibly pseudobreakups. Therefore a
correlation between convective flows and CDA waves seems to exist at different scales.
4. Discussion and Interpretation
We have found that in the NEPS, during the sub-
storm growth phase (as well as after the active phase),
ED and Ev, the azimuthal and radial components of the electric field, are generally weak and steady, close
to the equator; there is little E x B/B 2 transport. Con-
versely,
fast (typically
100 km s -i) transient
flows
coin-
cide with substorm breakup (and pseudobreakup), and
last about 5 min, during the active phase. These fast
flows are not necessarily directed earthward and west-
ward; reversals in the flow direction are frequent. This suggests that there are indeed two regimes of transport, as conjectured by Kennel [1995].
The agreement between the electric drift and AD is
less good, however, than in the radial direction (Av),
which is presumably due to the simultaneous existence
of a radial gradient in ion pressure. As discussed above, in subsection 2.4, owing to the lack of measurements of
the differential intensities with the appropriate time res-
olution, we cannot distinguish between the signatures of
a radial ion pressure gradient and that of an azimuthal flow (upon AD).
In the present section we use the linear kinetic for- malism introduced by Pellat [1990] for collisionless plas- mas confined in a mirror geometry and developed by Le
Contel et al. [2000a, 2000b] for the adiabatic plasma of
the NEPS, in order to understand why the transport is
so slow during the growth phase, and suddenly becomes fast during the active phase. To the lowest order in the electron to ion temperature ratio Te/Ti (Te/Ti -• 0),
Le Contel et al. [2000a] found that the enforcement of
the quasi-neutrality condition (QNC) implies the de- velopment of an electrostatic potential •0 which is con- stant along the field lines, but varies across them, so that the potential E field is perpendicular to B. This electrostatic potential •0 represents the self-consistent
nonlocal (i.e., bounce-averaged) response of the plasma
to an externally applied time-varying perturbation. Be- ing nonlocal, this effect can not be described by MHD
models. The important point in the present context
is that the potential electric field tends to reduce the
effect of the induced electric field associated with an
applied perturbation, as shown in the next subsection.
The result is a partial electric field shielding reducing
the plasma flow which would have been produced by the induced electric field alone. Thus the electric field (i.e.,
induced plus potential) varies with latitude [Le Contel et al., 2000a]. In the next subsection we summarize the
results already obtained by Le Contel et al. [2000a] on
the azimuthal electric field and use the same method to
derive the radial component.
4.1. Self-Consistent Quasi-Static Perpendicular
Electric Field
Local field-aligned coordinates defined by the triad of
unit vectors
B V!h
ex
- •, e• - ivl, ey
-ex x e•,
(1)
with •b the flux function defined by B = V•b x ey are
used
(e• is directed
radially
outward
as V and ey is
directed eastward as D). We assume that the electro-magnetic perturbation is periodic in time (t) and in space (in the y direction)
JA(r,
t) ec
J'•(•b,
ky,
l, w,
) exp
[i(kyy
+ wt)], (2)
where r and ky are the position vector and the y com-
ponent of the wave vector, respectively, and 1 is the
distance along the magnetic field line (for the sake of
simplicity we omit the hat symbol and the exponential
factor in the following formulas). With these assump- tions, Hurricane et al. [1995] showed that the radial
and the azimuthal components of the electric field asso-
ciated with low-frequency perturbations w • Wb,i, a•b,e
(Wb,i, Wb,e being the bounce frequencies of ions and elec-
LE CONTEL ET AL.' POSSIBLE CONTROL OF PLASMA TRANSPORT 10,823
0
5z, = -
-
(3)
5Ey - - iky (•0 (),) - ),), (4)
where
A - iw
ft dl,SA]l
and
•0 is
an
electrostatic
poten-
tial which is constant for a given magnetic field line; it is imposed by the quasi-neutrality condition. One should notice, however, that to obtain the full structure of the electric field along the field line, one needs to solve the
full Vlasov/Maxwell system of equations for a finite fre-
quency. This is a very hard task considering that for
w < Wb,eWb,i, the fluid approach is not valid. Le Con- tel et al. [2000a] obtained the azimuthal electric field
in the quasi-static
limit (w < wb,i,
wb,e
and w < kllvA,
kll being the parallel component of the wave vector and
vA being the Alfv•n velocity). They modeled the sub-
storm growth phase in the near-Earth plasma sheet as a quasi-static magnetic field perturbation. They used the two-dimensional dipole to describe the quasi-dipolar region, neglected the local currents to the lowest or-
der (low • assumption, • being the ratio between the plasma pressure and the magnetic field pressure), and
computed self-consistently the magnetic field perturba- tions produced by an external current flowing farther in the tail. They solved the linearized Amp•re's equation
with a forcing current 17 x 5B = I•O•jextey localized in
the radial and azimuthal directions, and corresponding to a current flowing in the western direction close to equator. This forcing current is written as
5je•t(L,
ky, O,w) - 5jeq(ky,w)5(L
- L½)
sin
2n
O
ß [(2n
+ 1)cot
2 O - 1],
(5)where 0 is the colatitude and L is the equatorial cross- ing distance of the relevant field line. We have chosen a class of forcing currents which corresponds to an in- crease in the equatorial current and still allows a simple derivation of the magnetic field perturbation. This class is labeled by an index n; the larger n is, the more the
perturbation is localized close to the magnetic equator
(see Le Contel et al. [2000a] for more details). In the limit Ikyl L > I (which is equivalent to assuming that
the characteristic scale of the perturbation along the y
direction is shorter than the characteristic scale of the
equilibrium magnetic field in the radial direction), they computed the azimuthal (east/west) electric field as- sociated with the magnetic field line stretching, which
after an inverse Fourier transform can be written
I•oSjm
Lc2?exp(?t)
L 1
5Ey
- -2(n
+ 1)
d v•
ß
[Sn-
(sin
20)n+•](1
+ (Pf [17V(()]},
(6)where Pf is the Cauchy principal value and W(() -
1/(x/'• f_o•
dV exp(-V
2)/(V - () is the Fried-Conte
function (with V - y•/d and ( - y/d). To derive (6),
they assumed
that 5jeq(y,
t) -- 5jm exp(-y2/d
2) exp(7t),
where d is the scale length of the current sheet in the y
direction and 1/7 is the characteristic timescale of the
growth phase.
In this paper we present the calculation of the radial
component of the electric field which develops in the
quasi-dipolar region, in response to the increase of the
azimuthal current farther in the tail. Following Le Con-
tel et al. [2000a]
and in the same
limit [ky[L > I (see
Appendix A), we obtain5E•
_ l•oJjm
4 L
c
2
•? exp(?t)
L
{ B
Beq
[ d
Pf
[W(()]
$.
- (sin2
0)"+•
y ( y
2)
' •
•r•/2
n+ 1
+2•exp -•-/
ß
{H(L
- L½)
- H
[-(L
- L½)])
Sn+•
- (sin
n+220)
'*+2
]
- •r
•/2
err(() sin
2n
9 (2n
+ 1) - (2n
+ 2) sin
2 0
ß
{H(L-Lc)-
H[-(L-L½)]}},
(7)
where H(L) stands for the Heaviside function. We con-
sider the region earthward of the location of the exter-
nal current ({H(L- L½)- H[-(L- L½)]} = -1) and
to simplify we assume that we are close to the noon-
midnight meridian (( - y/d < 1). Therefore it is con- venient to define the following nondimensional electric
fields: where and (8) (9) L
SEa
- t•o•j•Lc
• •-•?
exp(?t),
(10)I I [Sn
- (sin
2
O)
n+•
Fn(O)
- V•
n
+ 1
],
(11)
I ISn+•-(sin29)n+2
Gn(O)
- sin
2 O
n + 2
dSn-(sin20)
n+•
] (Ld_)
2
+ • (n
+ 1)v• + 2
sin2n
0
ß
[(2n
+ 1)-
(2n
+
2)sin
:•/)], (12)
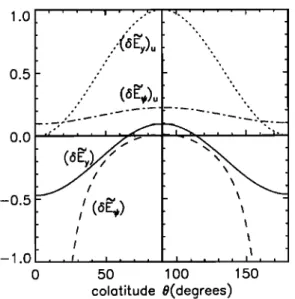
where $n is given by (A9) in Appendix A. The varia- tions of •Ey and •E• along the magnetic field line are plotted in Figure 5 for n = 0 and y/d = 1/2. We see
that dose
to the equator
(9 •_ •r/2), •y and
•
are
small. Therefore owing to the existence of the electro-
static potential •0 (•0 corresponds to $n and $n+• in the formulas (11) and (12), respectively), the motion
10,824 LE CONTEL ET AL.' POSSIBLE CONTROL OF PLASMA TRANSPORT
... E,,),.,
...
ß ß 0.,.5 ooø ",.."
I
'...
_.
r ø",
, , • ./.,,,"'"'•,_
-• , , , • , ' ß
'•
- -
(•
'•
,,
[
'
'
f
'
I • -1.0 ,. •., , , , , • .... •t. , 0 50 100 150 colatitude •(degrees)Figure 5. Normalized values of ½he azimuChal (•E•) and radial (•E•) componen½s of ½he quasi-sCa½ic electric
field as func½ions of ½he colaClaude t•. _For ½he sak_e of
comparison, unshielded componen½s (•E•)•, and (•Ee)•,
are also plo½½ed.
of the equatorial particles is small during the growth
phase. At middle-colatitudes (• _• 45ø), the azimuthal and radial components are comparable. Note that 5E½
changes dffection from dawnside to duskside. To show the effect of the cancellation of the shielding effect asso-
ciated with •0, we have plotted in Figure 5 also and (5E½)u, the variations of the azimuthal and ra-
dial components of the unshielded electric field, that is,
when S0 = $1 = 0. We note that close to the equator,
both the azimuthal and the radial components of the
unshielded electric field are typically 1 order of magni-
tude larger than in the shielded case. In the next section we discuss why such a cancellation of the shielding effect may occur at substorm onset.
4.2. Shielded Electric Field: Numerical
Estimates
During the growth phase, in the near-Earth quasi-
dipolar magnetic field (X _• 10 RE), for magnetic field
variations corresponding to the formation of a current
sheet (BH • and [Bv[ /•), the (total) electric field displayed in Figure 5 is (in the duskside): (1) directed eastward and earthward (but partially shielded), near the equator, (2) null (completely shielded) at some dis-
tance away from the magnetic equator (near the bound-
ary of the current sheet), and (3) westward and taftward
away from the equator. Notice that at high latitudes, the electrostatic component dominates and produces an earthward and westward transport during the growth phase. Thus for a time-dependent transport in the dusk
sector (1) large equatorial pitch angle particles, confined
near the equator, drift tailward and eastward whereas small pitch angle particles spend most of their time at
high latitudes, and therefore drift earthward and west-
ward, and (2) the equatorial electric field cannot be
mapped onto the ionosphere, even in the absence of a parallel electric field.
For the two events discussed here, we can estimate from Faraday's law the magnitude of the expected in- duced electric field associated with the stretching of
the magnetic field lines. For event I we have AEy
ABzAX/At _• 0.1 mV m -1 with ABz
10 nT, At •_ 1/7 --• 40 min, and AX _• 4 Rz (see Figure 5 of Roux et al. [1991], which displays the to- tal duration of the growth phase). For this event the
magnetic field varies slowly during the growth phase; therefore the induced electric field is in the range of
the error bar (4-0.5 mV m -1) of the spherical
double
probes on GEOS 2 [Pedersen et al., 1985]. Yet, forevent
2 we obtain
AEy _• 1.5 mV m -1 with ABz
ABs _• 35 nT, At _• 1/7 _• 10 min, and AXUsing formula (26) of Le Contel et al. [2000a], which
relates 5B!i •_ ABH to the forcing current, we obtain
5jm -• 2JBIIL/po/Lc
2 -• 1.23
x 10
-1ø A m -2 for event
I and Jim •- 4.3 x 10 -lø A m -2 for event 2, where
for both events we have assumed that Lc - 7 RE and
L - 6.6 RE. Assuming that d, the scale length of the current sheet in the y direction, is equal to 4 RE in
equation (10), we obtain 5Ea -• 0.3 mV m -1 for event
I and 5Ea -• 4 mV m -1 for event 2, which are equiv-
alent to previous estimates if we take into account the
variation with the colatitude (see Figure 5). For event
2 the estimated radial electric drift AVE
30 kms -1 with B _• 70 nT should be observable, but
is not observed, as can be seen in Figure 4. The same
comment can be made for the azimuthal electric drift.
However, if the spacecraft is near the boundary of the
current sheet (the Bv and B•/ components are of the same order of magnitude), the electrostatic field tends
to cancel the induced component of the electric field. Thus we suggest that the shielding may explain the lack of plasma transport during the growth phase.
4.3. Unshielded E Field: Fast Transport
Why is the situation different during the active phase?
If, for some reason, "particle collisions" were to occur on timescales shorter than the bounce time, the bounce motion would be inhibited, and the nonlocal response
would disappear. Pertaut et al. [2000] have pointed
out that pseudocollisions associated with CDA waves represent an efficient mechanism for diffusing electrons
in velocity
space
(more
precisely
in Vii
). CDA waves
may indeed have a finite parallel electric field. For
Ell - 0.025E•_,
and E•_ ~ 5 mV m -1 (as measured),
one
gets
approximately
Ell ~ 0.1 mV m -1. The corre-
sponding diffusion coefficient Dii is given by
•r e IEII kll W [•
LE CONTEL ET AL.: POSSIBLE CONTROL OF PLASMA TRANSPORT 10,825
where
Ak is the spectral
width and vg,i
I is the parallel
group velocity. For 5 keV electrons (remember that the
thermal energy of plasma sheet electrons is less than
5 keV), the diffusion time T4 _• 10 s is of the order
of the bounce period (8 s). For energies below 5 keV,
diffusion occurs over a faster timescale than the elec-
tron bounce period. This suggests a simple explanation for the control exerted by CDA waves on the proper-
ties of the transport. As soon as CDA waves are suf-
ficiently intense to destroy the periodic bounce motion
of electrons, (1) the parallel current is disrupted [Per-
taut et al., 2000] and (2) the nonlocal term •o cancels; the associated shielding vanishes. Then, the azimuthal
ED and radial Ev electric fields become equal to the
induced electric field associated with the magnetic field
variations produced by the disruption of the parallel
current; the disappearance of the shielding implies a
strong enhancement of the azimuthal and radial electric
fields, as observed. One should notice that during the
quasi-periodic oscillations with 5 min period observed
on the B•/ and By components of the magnetic field for event I between 2025 UT and 2035 UT, no elec- tric drifts are measured. Conversely, around 2043 UT, similar magnetic field variations on B•/and By give a large electric drift because a relatively high level of CDA
waves is present. Similarly, an enhanced E x B/B 2 drift
is observed in association with enhanced CDA waves, around 1926 UT, in event 2. Thus large electric drifts
associated with temporal magnetic field variations oc-
cur only on short timescales, and they are correlated
with high levels of CDA waves.
To rigorously determine exactly the new mode struc-
ture of the electric field, we need to solve the Vlasov/
Maxwell system of equations for a finite low-frequency
perturbation (• • •b.i•b,e) with a new term describing
the interaction with CDA waves. This task is outside
the scope of this paper, but thanks to the quasi-static calculations presented here, we have been able to sug- gest a mechanism which permits the existence of large
electric fields.
5. Summary and Conclusions
Field and particle measurements, carried out in the
NEPS, have been used as evidence for two regimes of
plasma transport:
1. During the growth phase, and after the end of
the active phase (the active phase being characterized by arcs/surges activated near the magnetic footprint
of GEOS 2), the azimuthal and radial electric fields,
and hence the radial and azimuthal electric drift veloci-
ties, are small and steady even when long-period (200 s)
perturbations occur in the magnetic field (see event 1 between 2025 UT and 2035 UT). These slow drifts are
interpreted as a consequence of the electrostatic shield- ing of the induced electric field associated with time-
varying external conditions. The electrostatic shielding is a nonlocal (nonMHD) effect, produced by electron
bouncing along magnetic field lines.
2. During the active periods, in particular at breakup, large-amplitude flow bursts, with typical velocities of
-• 100 km s -1, are observed. These flow bursts are asso-
ciated with intense low-frequency electromagnetic fluc-
tuations: current-driven Alfv•n waves (CDA waves).
Once their power is large enough, CDA waves produce a diffusion in velocity space on a timescale shorter than the bounce period. Even for modest parallel electric
fields
(Ell _ 0.1 mV m -• • Eñ _ 1- 10 mV m-l),
the diffusion time is shorter than the bounce period for electrons with energies below 5 keV. This fast diffu-
sion is equivalent to "anomalous" collisions that violate
the conservation of the second adiabatic invariant for
electrons, thereby destroying the electrostatic shielding
associated with the electron bounce motion. When the
shielding is cancelled on short timescales (shorter than the electron bounce period), the total electric field is
only given by the induced electric field which accompa- nies the magnetic topology change; therefore a sudden fast convective motion of the plasma occurs. We point out that this mechanism seems to be efficient during substorms as well as during small-scale perturbations
(pseudosubstorm); in the latter case the level of the
power of CDA waves is lower. Thus a microscopic pro- cess, electron diffusion in velocity space, may control
the large-scale (as well as the small-scale) plasma trans-
port in the NEPS. Finally, one may wonder whether the
fast flows observed in the NEPS are the same kind of
event as those observed farther out in the tail. Typi-
cal speeds found in NEPS are 100 kms -1 for substorm
events, which is 5 to 10 times smaller than fast flows ob-
served at about 20 RE. This factor (5 to 10), however,
is nothing but the ratio between the average magnetic
fields at 7 RE (--- 80 nT) and at 20 RE (--• 10-15 nT).
The size of the azimuthal E field spikes is the same.
Appendix A' Calculation of the Radial
Electric Field
The calculation of the radial electric field is more dif-
ficult than that of the azimuthal electric field because
we cannot assume a periodic dependence of the solution
in the radial direction. The radial electric field can be
written as
0 0
5E•
- -B•-•5•
- •SA•,
(A1)
with 5• - •o(A) - A, where •o is a constant part of the
perturbed electrostatic potential imposed by the quasi- neutrality condition; the expression for •o is given by
equation (13) of Le Contel et al. [2000a]. As in the work
by Le Contel et al. [2000a], we assume that the pertur-
bation varies faster than the equilibrium; therefore we can interchange the •b derivative and the integration on I in the expression for •o and write
( 0•)_
0 ) 0
(A2)
10,826 LE CONTEL ET AL.: POSSIBLE CONTROL OF PLASMA TRANSPORT
ponents of the E field, namely, the electrostatic com-
,• l•.ind
portent
5Eg's
and the induced
component
v.• . First,
we compute
5Eg
's. To correctly
perform
the •p deriva-
tive of ,•, we need to return to the solution of Amp•re's
equation obtained by Le Contel et al. [2000a]; it is writ-
ten
A•(L
'
k•,O
'
•) - •o
4 k u
•lk•l•jeq(ky,w)Lc2L
ß
f duu
• exp(Zu),
(A3)where
we have
defined
u = sin20
and Z = -Iku(L-
L,)I. In a two-dimensional dipole, we have &p = BeqdL,which yields
where we have defined
.+1
(2k- 1)!!
k=o(-1)
C,+1
(2k
+ 2)!!
k
(2j)!!
( j+l)
'Z(-I)JC•2j-I(j+I)I
j=o
.
X+k .
j +2
(A8) (A9) 0 B •o wlkul B•q 4 kyIf
OZ
f•'+'exP(z•)
ß duu"
exp(Zu)
+ L•
.
(A4) We obtainB •o
•lk•l
•j,•(k•,•)Z•Z[F•(Z,
u)
Beq 4 ky - I/z•lL (H(L - 4) - H [-(L - L½)]} Fn+ 1 (Z, u) , (A5)where we have defined
F.(Z,
u)
- f duu"
exp(Zu)
- [u'•/Z+
E (-1)kn(n-
1)... (n- k + 1)un-k/Z
•+1
k---1
exp(Zu), (A6) and H(L) stands for the Heaviside function. One can
show that for Z = -Iku(L-L½)l < 1, which implies that
the wavelength of the perturbation is larger than the
distance between the current and the location where the
solution is calculated, we have Fn(Z,u) •- n!/Z n+l +
u"+l/(n + 1), and we obtain
(A7)
Keeping
in mind
that 5E[ '8 - BO/O•b(*o
- A), and
taking into account the expression for •0 given in Ap-
pendix D of Le Contel et al. [2000a], the electrostatic
part of the electric field becomes
We perform the inverse Fourier transform, which yields
(see Appendix B of Le Contel et al. [2000a] for a similar
derivation)
where
17V(()
- 1/(x/•) f_• dV exp(-V2)/(V-() is the
Pried-Conte function and we have defined V = y•/d and ½=•/•.
Now, we compute the inductive part of the radial elec-
tric
field,
which
is witten
5E•
nd- -iwJA• - w/kySBll.
•om equation (A27) in Appendix A of Le Contel et al. [2000a], we obtain
• m*•*•(•'
•) •2 •in
• 0
• (•,•,o,•)--•
2
.
+
- n [-(•
- 4)1}.
(x11)
Aker an inverse Fourier tr•sform we get
• (L,
y0,
'
t) _x•/2•o6J•
4 L• Z*exp(*t)
2d
ß
err(0
sin
2•
0
((2n
+ 1)
- n [-(•
- 4)]
},
where
we
have
defined
err(()
- 2/•/2 • exp-x2dx.
The tot• radial
electric
field
•E• - •E[ '* + •E•
•
LE CONTEL ET AL.' POSSIBLE CONTROL OF PLASMA TRANSPORT 10,827
5Ee
- laøSJm
4 L½•7exp(7t)
2
L
{ B
B,•
[ d
W(•)
Sn
- (sin2
0)n+l
Y ( •)
' •r•/2
n+l
+2•exp -
. {H(L_
L½)
_ H[_(L_
L½)]}
Sn+l
- (sin•
n+2o)n+2]
- •r
1/2
erf(•) sin
2n
0 (2n + 1) - (2n + 2) sin
• 0
ß
{H(L-L½)-H[-(L-L½)]}}.
(A12)
Acknowledgments. Michel Blanc thanks the two ref-erees for their assistance in evaluating this paper. References
Angelopoulos, V., W. Baumjohann, C. F. Kennel, F. V. Coroniti, M. G. Kivelson, R. Pellat, R. J. Walker, H. Lfihr, and G. Paschmann, Bursty bulk flows in the inner central plasma sheet, J. Geophys. Res., 97, 4027, 1992.
Hurricane, O. A., R. Pellat, and F. V. Coroniti, A new proach to low-frequency "mhd-like" waves in magneto- spheric plasmas, J. Geophys. Res., 100, 19,421, 1995. Kennel, C. F., Convection and Substorms, Oxford Univ.
Press, New York, 1995.
Knott, K., Payload of the GEOS scientific geostationary
satellite, ESA Sci. Tech. Rev., 1,173, 1975.
Korth, A., G. Kremser, and B. Wilken, Observations of substorm-associated particle-flux variations at 6 <_ 1 <_ 8 with GEOS-1, Space Sci. Rev., œœ, 501, 1978.
Le Contel, O., R. Pellat, and A. Roux, Self-consistent quasi- static radial transport during the substorm growth phase, J. Geophys. Res., 105, 12,929, 2000a.
Le Contel, O., R. Pellat, and A. Roux, Self-consistent
quasi-static parallel electric field associated with substorm
growth phase, J. Geophys. Res., 105, 12,945, 2000b. Lui, A. T., et al., Current disruption in the near-Earth neu-
tral sheet region, J. Geophys. Res., 97, 1461, 1992. Lui, A. T., A. Mankofsky, C. L. Chang, K. Papadopoulos,
and C. S. Wu, A current disruption mechanism in the neutral sheet: A possible trigger for substorm expansions,
Geophys. Res. Left., 17, 745, 1990.
Mitchell, D. G., R. Lundin, and D. J. Williams, Analyses of convective flows and spatial gradients in energetic ion observations, J. Geophys. Res., 91, 8827, 1986.
Nakamura, T., D. N. Baker, D. H. Fairfield, D. G. Mitchell,
R. L. McPherron, and E. W. Hones Jr., Plasma flow and magnetic field characteristics near the midtail neu-
tral sheet, J. Geophys. Res., 99, 23,591, 1994.
Ohtani, S.-I., K. Takahashi, L. J. Zanetti, T. A. Potemra,
R. W. McEntire, and T. Iijima, Initial signatures of mag- netic field and energetic particle fluxes at tail reconfig-
uration: Explosive growth phase, J. Geophys. Res., 97,
19,311, 1992.
Pedersen, A., C. A. Cattel, C.-G. Fiilthammar, K. Knott, P.- A. Lindqvist, R. H. ManY, a, and F. S. Mozer, Electric fields in the plasma sheet and plasma sheet boundary layer, J.
Geophys. Res., 90, 1231, 1985.
Pellat, R., Une nouvelle approche de la reconnexion magn•tique: Sous-orages magn•tosphdriques- vents stel- laires, C. R. Acad. Sci., 311, 1706, 1990.
Perraut, S., A. Morane, A. Roux, A. Pedersen, R. Schmidt, A. Korth, G. Kremser, B. Aparicio, and R. Pellinen, Char-
acterization of small scale turbulence observed at sub-
storm onsets: Relationship with parallel acceleration of
particles, Adv. Space Res., 13,217, 1993.
Perraut, S., A. Roux, O. Le Contel, R. Pellat, A. Peder-
sen, and A. Korth, Evidence for a substorm trigger, in
Fourth International Conference on Substorms, edited by
S. Kokubun and Y. Kamide, p. 349, Kluwer Acad., Nor-
well, Mass., 1998.
Perraut, S., O. Le Contel, A. Roux, R. Pellat, A. Korth,
O. Holter, and A. Pedersen, Disruption of parallel current at substorm breakup, Geophys. Res. Left., œ7, 4041, 2000.
Pu, Z. Y., A. Korth, and G. Kremser, Plasma and magnetic
field parameters at substorm onsets derived from GEOS-2
observations, J. Geophys. Res., 97, 19,341, 1992.
Roux, A., et al., Plasma sheet instability related to the west- ward traveling surge, J. Geophys. Res., 96, 17,697, 1991.
Sauvaud, J.-A., and J. R. Winckler, Dynamics of plasma,
energetic particles, and fields near synchronous orbit in
the nighttime sector during magnetospheric substorms, J.
Geophys. Res., 85, 2043, 1980.
Shinohara, I., T. Nagai, M. Fujimoro, T. Terasawa,
T. Mukai, K. Tsuruda, and T. Yamamoto, Low-frequency
electromagnetic turbulence observed near the substorm
onset site, J. Geophys. Res., 103, 20,365, 1998.
Walker, R. J., K. N. Erickson, R. L. Swanson, and J. R. Winckler, Substorm-associated particle boundary motion at synchronous orbit, J. Geophys. Res., 81, 5541, 1976.
O. Holter and A. Pedersen, University of Oslo, Depart- ment of Physics, Boks 1048 Blindern, 0316 Oslo, Norway.
A. Korth, Max-Planck-Institut ffir Aeronomie, 37191
Katlenburg-Lindau, Germany.
O. Le Contel, S. Perraut and A. Roux, Centre d'Etude des Environnements Terrestre et Planetaires, 10-12 avenue de l'Europe, F-78140 V•lizy, France. ( olivier.lecontel@cetp.ipsl. fr )
R. Pellat, Commissariat • l'l•nergie Atomique, rue de la
f•d•ration, F-75007, Paris, France.
(Received February 28, 2000; revised January 11, 2001;