HAL Id: inserm-00466077
https://www.hal.inserm.fr/inserm-00466077
Submitted on 29 Aug 2014
HAL is a multi-disciplinary open access
archive for the deposit and dissemination of sci-entific research documents, whether they are pub-lished or not. The documents may come from teaching and research institutions in France or abroad, or from public or private research centers.
L’archive ouverte pluridisciplinaire HAL, est destinée au dépôt et à la diffusion de documents scientifiques de niveau recherche, publiés ou non, émanant des établissements d’enseignement et de recherche français ou étrangers, des laboratoires publics ou privés.
performance.
Bruno Louis, Karl Leroux, Daniel Isabey, Brigitte Fauroux, Frédéric Lofaso
To cite this version:
Bruno Louis, Karl Leroux, Daniel Isabey, Brigitte Fauroux, Frédéric Lofaso. Effect of manufacturer-inserted mask leaks on ventilator performance.. European Respiratory Journal, European Respiratory Society, 2010, 35 (3), pp.627-36. �10.1183/09031936.00188708�. �inserm-00466077�
Bruno Louis, PhD;1,2 Karl Leroux , AAS; 3 Daniel Isabey, PhD;1,2 Brigitte Fauroux, MD, PhD;4,5 and Frédéric Lofaso, MD, PhD1,6
1
INSERM, Unit 955 , Créteil, F94010, France 2
Université Paris 12, Faculté de Médecine, UMR S-955, Créteil, F94010, France 3
ADEP Assistance, Puteaux, Paris, France 4
AP-HP, Hôpital Armand Trousseau, Pediatric Pulmonary Department, Paris, France 5
Université Pierre et Marie Curie-Paris 6, INSERM UMR S-938 Paris, France 6
AP-HP, Raymond Poincaré Teaching Hospital, Université Versailles-St Quentin en Yvelines, Physiology – Functional Testing, and Technological Innovations Centre, 92380 Garches, France
The study has been done in INSERM, Unit 955, Créteil, F94010, France, and in Raymond Poincaré Teaching Hospital, 92380 Garches, France
Correspondence
Dr F. LOFASO, Service de Physiologie-Explorations Fonctionnelles, Hôpital Raymond Poincaré, 92380 GARCHES, FRANCE
Tel: (+33) 147 107 941; Fax: (+33) 147 107 943; E-mail: [email protected]
ABSTRACT
Background: Most pressure-support devices use a single circuit with an exhalation port
integrated in the mask. The aim was to compare the effects on ventilator performance of masks having different manufacturer inserted leaks.
Methods: We simulated a chronic obstructive pulmonary disease and a restrictive disease.
Four ventilators (VENTImotion-WEINMANN; VPAP III STA -RESMED; SYNCHRONY 2-RESPIRONICS; and VIVO 40-BREAS) were tested with the recommended masks and with the masks having the largest and smallest leaks. Tests were done with pressure support levels of 10, 15, and 20 cmH2O. The in vivo evaluation compared two ventilators using
recommended masks opposed in term of exhaled port resistance. The ventilators were tested with their recommended mask, and after mask exchange.
Results: The mask with the largest leak induced auto-triggering and/or increased
inspiratory-trigger sensitivity with VENTImotion under both simulated conditions and with VPAP III STA under the simulated obstructive-disease condition. The mask with the smallest leak increased inspiratory-trigger delay with SYNCHRONY 2 in the simulated obstructive-disease condition and increased rebreathing. The in vivo study confirmed the bench results.
Conclusion: When switching to a mask that has a different leak, evaluation is needed to
adjust trigger sensitivity and pressurization level and to check the absence of rebreathing.
Noninvasive positive-pressure ventilation (NPPV) is recommended as the first-line treatment for acute and chronic respiratory failure.[1] Successful NPPV requires adaptation of the mechanical ventilation to the patient’s needs. If ventilation is ineffective or uncomfortable, the patient may have trouble adapting to the device and may even refuse NPPV.[1,2] The broad array of available ventilators and masks should increase the likelihood that a ventilator-mask combination suited to the patient is found. Most ventilators, notably pressure-support (PS) devices, use a single circuit with an exhalation port located as close as possible to the patient’s face, often within the mask itself.[3,4] Many manufacturers validate the
performances of their ventilators only with their own masks. Using a ventilator with a mask from a different manufacturer is therefore not recommended. However, a patient who is acclimatized to a specific ventilator may be more comfortable with a mask from a different manufacturer. In addition, patients on home ventilation have their ventilator settings
determined at the hospital with a given mask but often subsequently switch to another mask at home.
The aims of this study were to compare the leak levels of several masks and to evaluate the effects of masks having different leak levels on the performance of four ventilators.
MATERIALS AND METHODS Experimental in vitro study
Evaluation of manufacturers inserted mask leaks (MIML) through different masks
The pressure/flow relationship of the mask exhalation port (leak) was evaluated by fitting the mask to a life-size mannequin. Compressed air was used to pressurize the mask to a range of predetermined values between 5 and 20 cm H2O. A pneumotachograph (Fleisch #1; Gould Electronique, Longjumeau, France) coupled to a differential pressure transducer (Validyne DP45 ± 3.5 cm H2O, Validyne, Northbridge, CA) served to measure the airflow
delivered to the mask. Another differential pressure transducer (Validyne DP45 ± 35 cm H2O) with one port connected to the mask and the other open to the atmosphere was used to
measure the pressure inside the mask.
Evaluation of the effect MIML on ventilator performance
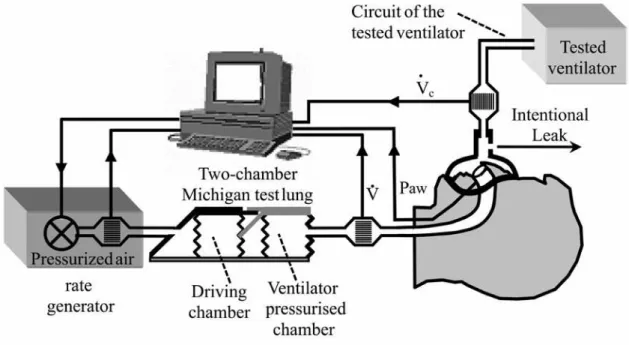
A two-chamber Michigan test lung (MII Vent Aid TTL; Michigan Instrument, Grand Rapids, MI) was used to evaluate the effect of manufacturers inserted mask leaks on ventilator performance (Figure 1). To simulate a respiratory effort, the second chamber of the Michigan test lung (driving chamber) was connected to a flow-rate generator that could generate various waveforms previously stored in a microcomputer. The two chambers were physically
connected to each other by a small metal component that allowed the driving chamber to lift the testing chamber. The flow rate generator, developed by our laboratory as previously described, was built by associating pressurized air, flow-rate measurement, and a servo valve driven by a microcomputer [5]. An adult-sized mannequin head was connected to the lung chamber via a circuit with a dead space of 120 ml. Two adult-sized mannequin head were available according to easily adapt the masks without additional leaks between the mask and the mannequin. Flow (V ) was measured between the mannequin head and the lung chamber using a pneumotachograph (Fleish n°2, Lausanne, Switzerland) connected to a differential pressure transducer (Validyne DP 45 ± 3.5 cm H2O). Pressure at the level of the mask (Paw) was measured via a differential pressure transducer (Validyne DP 45 ± 56 cm H2O). A second pneumotachograph was inserted between the mask and the ventilator to measure the leak through the mask exhalation port
(
Vleak = −Vc V in figure 1)
and the volume of air that returned into the ventilator circuit during expiration. Signals were digitized at 200 Hz by an analogic/digital system (MP100, Biopac Systems, Goleta, CA) and recorded on aand before each recording we systematically checked that 30 cm H2O of positive pressure, did not induce leak measurable by the pneumotachograph when the exhalation port and the
connection to the lung chamber were closed. To obtain this result mask strips were very tight round the mannequin head, which could not be done in an in vivo condition. In addition we retrospectively checked that instantaneous leak
(
Vleak = −Vc V corresponded to the expected)
leak in accordance with Paw.The compliance of the test chambers and the resistance (a parabolic airway resistor) (Pneuflo® Airway resistor Rp20 and Rp5; Michigan Instrument, Grand Rapids, MI) were set at 100 ml/cm H2O and Rp20, respectively, to simulate obstructive disease and at 30 ml/cm H2O and Rp5, respectively, to simulate restrictive disease. Respiratory rate was set at 10 breaths/minute for the obstructive-disease simulation and 20 breaths/minute for the restrictive-disease simulation. During both simulations, spontaneous tidal volume (VT) was 300 ml and
the ratio of inspiratory time over total respiratory-cycle duration (TI/TTOT) was 33%. The inspiratory flow contour was rounded to simulate a physiological flow contour.
Positive end-expiratory pressure (PEEP) was 4 cm H2O. Three levels of PS were evaluated: 10, 15, and 20 cm H2O, these corresponded to an inspiratory positive airway pressure (IPAP) of respectively 14, 19, and 24 cm H2O. Whenever possible, the inspiratory trigger was set at the most sensitive level that did not induce auto-triggering, whereas the expiratory trigger was set at the most sensitive level associated with a minimum inspiratory time duration (TI) of 1 sec.
As previously described,[5] the following parameters were computed from each pressure and/or flow trace: inspiratory trigger sensitivity, based on the trigger time (ΔT), i.e., the time from inspiration onset to achievement of an airway pressure greater than the PEEP level. Pressurization performance (PP) was evaluated as the mean pressure above the PEEP level during the first 0.5 sec of inspiration.[6] This mean pressure was expressed as a
percentage of the PS level delivered by the ventilator. TI was calculated from the flow signal and VT (the volume delivered to the lung chamber) by integrating the flow signal. Rebreathing was evaluated as the percentage of the expired volume remaining in the circuit at the end of expiration.[4,7].
Devices
The relationship between the leak level and airway pressure was measured for six nasal masks and four face masks (Table 1). The choice of the ventilator was based on the ventilator specification which advised to use a specific mask from the same manufacturer. Four
ventilators were tested (Table 2) with their recommended masks and with the masks having the largest and the smallest leak levels. Evaluation with non-recommended masks were done without changing the ventilator settings; if auto-triggering occurred, a second evaluation was done after setting the inspiratory trigger at the most sensitive level not associated with auto-triggering and the expiratory trigger at the most sensitive value associated with a minimum TI
of 1 sec.
Experimental in vivo study
Devices tested
Two ventilators were tested : The one for which the recommended mask had the most resistive exhaled port and the one for which a recommended mask had the less resistive exhaled port. The aim was to test two the ventilators with their recommended mask, and thereafter to exchange the masks.
This study was approved by the local ethic committee and written informed consents were obtained for all subjects. Four healthy subjects aged 36-51 years were included.
Methods
Two pneumotachographs (Fleisch #2, Lausanne, Switzerland), each connected to a differential pressure transducer (Validyne MP 45, Northridge, CA; ±3 cm H2O), were used (Figure 2). One pneumotachograph was inseted upstream to the mask exhalation port whereas the other was inseted downstream to the mask exhalation port. In fact the first
pneumotachograph was before the mask which was fixed to a mannequin face (Figure 2). The air entered through the mannequin nostrils into a short tube (length 20 cm, internal diameter = 0.75 cm, total resistance at 1L/sec 6.8 cm H2O . L-1 . sec) which was connected to the
pneumotachograph; and this second pneumotachograph was connected to the subject via a mouth piece while the subject wore a nose clip to be sure that no leak occur between the subject and the interface. This additional circuit induced a dead space increase of 45 ml. Airway pressure (Paw) was measured using a differential pressure transducer (MP 45 model, Validyne ± 100 cm H2O, Northridge, CA) connected to the mask (Figure 2). All signal outputs were digitized at 200 Hz (MP100, Biopac Systems, Goleta, CA) and recorded.
Experimental protocol
With each device adjustments were performed with the/a recommended mask. Pressure support was adjusted with the study participant sitting comfortably. The backup rate was set at the lowest rate. Positive end-expiratory pressure was set at 4 cm H2O. The inspiratory positive airway pressure level, the slope of pressure support and the expiratory trigger were adjusted according to the preference of the subject. The inspiratory trigger was set at the most sensitive level that did not induce autotriggering. The study participants were blinded to the condition. This initial condition was maintained to obtain 10 minutes of stabilization followed by 3 minutes of recording. Thereafter, the recommended mask was changed for the non
recommended mask without changing the settings of the ventilator. This new condition was maintained to obtain 10 minutes of stabilization followed by 3 minutes of recording.
Data analysis
The recordings were analysed breath by breath. The parameters analysed were the same as during the experimental in vitro study.
Statistics of the in vitro and the in vivo studies:
Each parameter was averaged for 30 respiratory cycles. Data were given as means ± SDs. For the in vitro study the effect of the masks change was evaluated by using a Student’s t test. The level of significance was set at 5 %. Because the number of subjects tested in the in
vivo study was too small, the comparison was only qualitative.
RESULTS
Experimental in vitro study
The pressure-flow relationships of the mask ports are shown in Figure 3. The characteristics of the masks were very similar, with the exception of the Weinman
SOMNOplus, whose resistance was higher, and the Resmed Ultra Mirage Full Face Medium, whose resistance was lower. These two masks were therefore tested with each of the four ventilators.
Performance of the ventilators with their recommended masks
The performance characteristics of the four ventilators tested with the recommended masks are reported in Table 3. We found major differences across ventilators regarding inspiratory-trigger sensitivity, TI, and VT. Synchronization between the simulated patient
profile and the ventilator was possible except with the VIVO 40 ventilator under the restrictive-disease condition at IPAP ≥19 cm H2O.
Effects on ventilator performance of the mask with the largest intentional leak
The performance characteristics of the ventilators with the mask having the largest MIML are shown in Table 4. Auto-triggering occurred with the VENTImotion in both
simulated conditions and with the VPAP III STA under the obstructive-disease condition with the highest IPAP level. In addition, inspiratory-trigger sensitivity increased with the VPAP III STA in the obstructive-disease simulation when IPAP was 14 or 19 cm H2O. This increase in inspiratory-trigger sensitivity was associated with an increase in PP. Performance of the SYNCHRONY was not noticeably changed by using the high-leak mask. In contrast, performance of the VIVO 40 was substantially affected, with differences between the two simulated conditions and across PS levels and with either a decrease or an increase in inspiratory-trigger sensitivity.
Adjustment of the inspiratory trigger corrected the auto-triggering observed with the VPAP III STA and VENTImotion under the obstructive-disease condition. After this
adjustment, inspiratory-trigger sensitivity was better than with the recommended mask (Table 5). In contrast, inspiratory-trigger adjustment corrected the auto-triggering observed with the VENTImotion under the restrictive-disease condition only when IPAP was 14 cm H2O. Ventilator-setting adjustment did not avoid the auto-triggering observed with VIVO 40 under the restrictive-disease condition when IPAP was ≥ 19 cm H2O.
Effects on ventilator performance of the mask with the smallest intentional leak
Use of the mask with the smallest MIML either increased or decreased inspiratory trigger sensitivity, TI, VT, and PP (Table 6). Under the restrictive-disease condition with a
high PS level, this mask was associated with increased rebreathing (Table 6). Auto-triggering occurred with SYNCHRONY 2 and the highest PS level in the obstructive-disease condition. Ventilator-setting adjustment was not possible, since trigger setting was automatic. In contrast, this mask corrected the auto-triggering observed with VIVO 40 in the restrictive-disease condition after ventilator-setting adjustment.
Experimental in vivo study
The ventilators and masks chosen for the in vivo study were first, the VENTImotion with its SOMNOplus mask, considering that this mask had the most resistive exhalation port, and second the VPAP III STA because this device can set with the “Resmed Ultra Mirage Full Face” Mask which had the less resistive exhalation port.
The results obtained in the four subjects with these two ventilators and their
recommended masks were presented in Table 7. As previously observed in the in vitro study, when the level of pressure support was similar in both conditions, VPAP III STA was
associated with a longer TI, a higher VT, a shorter ΔT and higher PP than the VENTImotion. In addition, rebreathing was observed in two subjects with the VENTImotion.
The results obtained in the four subjects with these two ventilators but after mask change (which was not recommended by the manufacturers) were presented in Table 8. We observed that, as observed in the in vitro study, auto-triggering occurred with VENTImotion when the leak was increased by using the Resmed Ultra Mirage Full Face mask and
rebreathing occurred in 3 subjects with the VPAP III STA when the leak was decreased by using the SOMNOplus mask.
This bench study showed substantial differences in manufacturer inserted leaks levels across masks that are widely used in clinical practice and established that leak level affected ventilator performance. The mask with the largest leak was associated with auto-triggering and/or decreased inspiratory-trigger sensitivity with three of the four ventilators. The mask with the smallest intentional leak was associated with increased rebreathing. An in vivo evaluation confirmed these results.
Although it was not the aim of the study, striking differences were observed between the ventilator devices. For some ventilator and in certain conditions the inspiratory trigger delay was inacceptable. It was previously considered that an acceptable inspiratory trigger needs to have a ΔT of less than 150 msec. None of the ventilators reached this value when simulating an obstructive disease and only two ventilators reached this value when simulating a restrictive disease. The systematic higher ΔT when simulating an obstructive disease than when simulating a restrictive disease was mainly explained by the fact that for the same negative pressure inside the testing chamber, produced by the driving chamber, at the beginning of the inspiration, the depression at the mask level was less when simulating the obstructive disease than when simulating the restrictive disease. This may be explained by the presence of a higher resistance (RP20 vs RP5) between the testing chamber and the mask which impedes the transmission of the negative pressure to the mask.
The other important difference between ventilators is the large difference in VT despite a similar level of pressure support. This was explained by differences in the TI which was mainly influenced by the difference in expiratory trigger sensitivity between ventilators. For these reasons it is not recommended to change a pressure support device for another device without a new complete adjustment of the ventilator settings to the patient.
Importantly, the effect of the MIML level on the inspiratory trigger is variable and unpredictable. In one study, increasing the leak either induced auto-triggering or had no effect
on the inspiratory trigger, depending on the type of ventilator.[8] Similarly, a leak greater than 10 L/min was associated with auto-triggering in seven of eight ventilators and with effects on inspiratory-trigger time consisting in an increase (four ventilators) a decrease (one ventilator), or no change (two ventilators).[9] We also found that the inspiratory trigger was not
consistently affected by the leak level. Some of these discrepancies may be ascribable to the experimental conditions. For example, one study found no effect of leakage on the inspiratory trigger,[10] whereas another, conducted on the same ventilators, showed that a large leak induced auto-triggering when the inspiratory trigger was excessively sensitive [11]. From a mechanical point of view, the effect of a leak on the inspiratory trigger cannot be predicted without detailed information on the algorithm used to drive ventilator behaviour, and particularly the ventilator whose aim is to maintain a constant PEEP as long as it detects no new patient effort. This behaviour is different if we assume that the ventilator acts as a perfect flow generator (Vc =Cst)or a perfect pressure generator (Pv = Cst). In the first case, a
decrease in the leak level facilitates the detection of the inspiratory effort by the ventilator, while this is not true in the second case (for more explanation see the online depository).
Similarly, the effect of the leak on the expiratory trigger is unpredictable without detailed information on the ventilator software. Usually, the expiratory trigger is based on detection of the time when the flow rate reaches a given percentage of the peak inspiratory flow. The presence of a leak (Vleak) may partly mask the fall in the patient’s inspiratory flow
(x%V ≠x% V
(
+Vleak)
). Underestimation of Vleak should theoretically delay the expiratory trigger time, whereas overestimation should shorten the expiratory trigger time. Therefore, underestimation of the leak should increase TI and VT,whereasoverestimation shoulddecrease both parameters. Thus, although the level of the leak is determined by the mask, estimation of this leak and therefore of the variations in TI and VT is determined by the ventilator.
Our findings may apparently differ from a recent study of the effects of various masks on the performance of a range of ventilators [12]. However, these apparent discrepancies may be ascribable to differences in the study ventilators. Indeed, in the other study, the ventilator whose performance was the most affected by the mask with the largest leak in our study was not tested.[12] The experimental conditions were also different. Respiratory system
compliance was equal to or lower than 30 ml/cm H2O in the other study [12] and equal to or greater than 30 ml/cm H2O in our study. In our study, the effects of mask changes were greatest under the obstructive-disease condition with a high respiratory-system compliance (100 ml/cm H2O). In addition, at a similar level of PS, VT measured in the other study [12] was higher than in our study, although respiratory compliance was lower, suggesting that the simulated patient effort was higher. Nevertheless, increasing the leak affected VT in both studies. We also showed that inspiratory-trigger performance was affected by the mask having the largest leak and that rebreathing was affected by the mask having the smallest intentional leak.
Our index of rebreathing [4,7] did not measure exactly measure the rebreathing volume. In fact, by inserting a pneumotachograph between the mask with its exhalation port and the ventilator, we were able to measure the expiratory gas which returned and remained upstream the exhalation port just before the next inspiration. Obviously this value
overestimated the rebreathing, since a part of this volume is washed through the exhalation port and toward the atmosphere during inspiration. Nevertheless ideally, the totality of expiratory gas should be washed through the exhalation port at the end of expiration. This means that VT/TE should be lower than the leak during expiration. When regarding the breathing pattern of patients under pressure support in the literature, the mean VT/TE was equal to 243 ml/sec (14.5 L/min) during sleep in stable neuromuscular patients [13], equal to 333 ml/sec (20 L/min) during wakefulness in both neuromuscular patients and chronic
obstructive pulmonary disease patients [14], and equal to 370 ml/sec (22 L/min) in intubated patients, having an acute respiratory failure, who could not breathe spontaneously during more than 15 min [7]. These data suggest that the leak should exceed 20 L/min when treating
chronic respiratory failure and 22 L/min in case of acute respiratory failure if the clinician want to be sure that no expired gas is forced back to the circuit upstream to the exhalation port, ready to be in part rebreathed at the next inspiration. In our study, this was not the case for all the masks when a minimal PEEP of 4 cmH2O was applied (see the Figure 3). Notably the SOMNOplus mask would induce an additional rebreathing in almost any clinical
condition considering that its leak was equal to 12.6 L/min for a 4 cmH2O pressure (Figure 3). The size of the mask may also affect the rebreathing by modifying the apparatus dead space and one can suggest that facial masks markedly increased this value. However, Saatci et al. [15] demonstrated that the exhalation port in the nasal bridge of face masks generates a beneficial flow path that decreases the apparatus dead space, but only if leak during the expiratory phase is sufficient (see above). In this condition, they observed that the dynamic apparatus dead space of the different masks varied only from 35 ml to 60 ml while their static volume varied between 100 ml and 400 ml [15]. This reduction of apparatus dead space induced by accurately positioning the exhalation port to the mask could therefore be
considered as a beneficial effect of using a single circuit system if, obviously, the leak during the expiratory phase is sufficient.
The change of the leakage was not the unique factor which may influence the result when the mask change and our experimental conditions did not cover all the hazards and difficulties observed during non-invasive ventilation. A mask and a mouth leakage may greatly disturb the ventilator performances. In addition, interaction of mask with the face may impact the geometry of the airflow route and therefore the interaction between the nasal mask and the face and the connecting tube influence the total circuit resistance [16]. In addition, we
did not evaluate the influence of the airway route breathing between the nose and the mouth; but it is clear that a facial mask allows a reduction of the upper airway resistance by breathing through the mouth and bypassing the nasal resistances which may represent 50% of the total airway resistances. This mouth route is generally preferred during acute respiratory failure [17]. To limit our evaluation to the MIML effects we used the same connecting tubes in each condition and according to Windisch et al. [16], we assumed a minor effect of the size of the mask on the total circuit resistance with the respect of its own resistance.
Our study had other limitations : TI/Ttot is generally shortened in a COPD population
in order to prolong TE and avoid intrinsic PEEP due to the expiratory flow limitation induced by the dynamic airway collapse. Because, unfortunately, our model did not simulate this phenomenon we did not observe intrinsic PEEP and we did not need to prolong TE. Nevertheless, it was interesting to observe that a similar pattern of breathing without mechanical ventilation during the simulation of both obstructive disease and obstructive disease did not induce a similar inspiratory trigger when adding the assisted mechanical ventilation.
The reason for which the VIVO 40 ventilator presented auto-triggering with the
recommended mask when simulating restrictive disease and when pressure support was above 10 cmH2O is unclear. One explanation could be the presence of the pressure signal noise induced by both the low compliance of the simulated patient and the high pressure variation between inspiration and expiration which both facilitated auto-triggering.
The correction of the trigger sensitivity after mask change was made only in case of auto-triggering considering that if auto-triggering does not occur, the clinician would not be able to clinically detect the change of the trigger sensitivity and therefore would have no reason to change it.
In conclusion, changes in manufacturers’ inserted leak through the mask exhalation port may modify patient-ventilator synchronization and ventilator performance. Therefore, we recommend a routine clinical evaluation at every mask change in order to check inspiratory-trigger sensitivity and pressurization, which should be adjusted if needed, and to check the absence of rebreathing. In addition our results and the pattern of breathing of patients under pressure support in the literature suggest that the leak of the mask should exceed 22 L/min, which was not observed with all the masks when the PEEP level was at its lowest value.
Financial support:
The research of Brigitte Fauroux is supported by the Association Française contre les
Myopathies (AFM), ADEP Assistance, Assistance Publique-Hôpitaux de Paris, Inserm, Legs Poix, and Université Pierre et Marie Curie-Paris 6.
References
1. Mehta S, Hill NS. Noninvasive ventilation. Am J Respir Crit Care Med 2001; 163: 540-577.
2. Schonhofer B, Sortor-Leger S. Equipment needs for noninvasive mechanical ventilation. Eur Respir J 2002; 20: 1029-1036.
3. Ferguson GT, Gilmartin M. CO2 rebreathing during BiPAP ventilatory assistance. Am
J Respir Crit Care Med 1995; 151: 1126-1135.
4. Lofaso F, Brochard L, Touchard D, Hang T, Harf A, Isabey D. Evaluation of carbon dioxide rebreathing during pressure support ventilation with airway management system (BiPAP) devices. Chest 1995; 108: 772-778.
5. Fauroux B, Leroux K, Desmarais G, et al. Performance of ventilators for noninvasive positive-pressure ventilation in children. Eur Respir J 2008; 31: 1300-1307.
6. Richard JC, Carlucci A, Breton L, et al. Bench testing of pressure support ventilation with three different generations of ventilators. Intensive Care Med 2002; 28: 1049-1057.
7. Lofaso F, Brochard L, Hang T, Lorino H, Harf A, Isabey D. Home versus intensive care pressure support devices. Experimental and clinical comparison. Am J Respir Crit
Care Med 1996; 153: 1591-1599.
8. Miyoshi E, Fujino Y, Uchiyama A, Mashimo T, Nishimura M. Effects of gas leak on triggering function, humidification, and inspiratory oxygen fraction during noninvasive positive airway pressure ventilation. Chest 2005; 128: 3691-3698.
9. Vignaux L, Tassaux D, Jolliet P. Performance of noninvasive ventilation modes on ICU ventilators during pressure support: a bench model study. Intensive Care Med 2007; 33: 1444-1451.
10. Stell IM, Paul G, Lee KC, Ponte J, Moxham J. Noninvasive ventilator triggering in chronic obstructive pulmonary disease. A test lung comparison. Am J Respir Crit Care
Med 2001; 164: 2092-2097.
11. Mehta S, McCool FD, Hill NS. Leak compensation in positive pressure ventilators: a lung model study. Eur Respir J 2001; 17: 259-267.
12. Borel JC, Sabil AK, Janssens JP, et al. Intentional Leaks in Industrial Masks Have a Significant Impact on Efficacy of BiLevel Noninvasive Ventilation: A Bench Test Study. Chest 2008.
13. Fanfulla F, Delmastro M, Berardinelli A, Lupo ND, Nava S. Effects of different ventilator settings on sleep and inspiratory effort in patients with neuromuscular disease. Am J Respir Crit Care Med 2005; 172: 619-624.
14. Navalesi P, Fanfulla F, Frigerio P, Gregoretti C, Nava S. Physiologic evaluation of noninvasive mechanical ventilation delivered with three types of masks in patients with chronic hypercapnic respiratory failure. Crit Care Med 2000; 28: 1785-1790. 15. Saatci E, Miller DM, Stell IM, Lee KC, Moxham J. Dynamic dead space in face masks
used with noninvasive ventilators: a lung model study. Eur Respir J 2004; 23: 129-135.
16. Windisch W, Buchholt A, Stahl CA, Sorichter S, Guttmann J. Flow-dependent resistance of nasal masks used for non-invasive positive pressure ventilation.
Respirology 2006; 11: 471-476.
17. Brochard L, Mancebo J, Wysocki M, et al. Noninvasive ventilation for acute
exacerbations of chronic obstructive pulmonary disease. N Engl J Med 1995; 333: 817-822.
Table 1. The ten masks tested
BRAND MODEL
NASAL MASKS
WEINMANN (Hamburg, Germany) SOMNOplus
RESMED (Saint Priest, France; North Ryde, Australia) Ultra Mirage RESMED (Saint Priest, France; North Ryde, Australia) Mirage Activa Large RESPIRONICS (Nantes, France; Murrysville, PA) Profile Lite FISHER & PAYKEL(Villebon-s/Yvette, France) Flexifit 407 BREAS (Saint Priest, France; Mölnlycke, Sweden) IQ 50293
FACE MASKS
RESMED (Saint Priest, France; North Ryde, Australia) Ultra Mirage Full Face Medium
RESPIRONICS (Nantes, France; Murrysville, PA) Comfort Full FISHER & PAYKEL(Villebon-s/Yvette, France) Flexifit 432
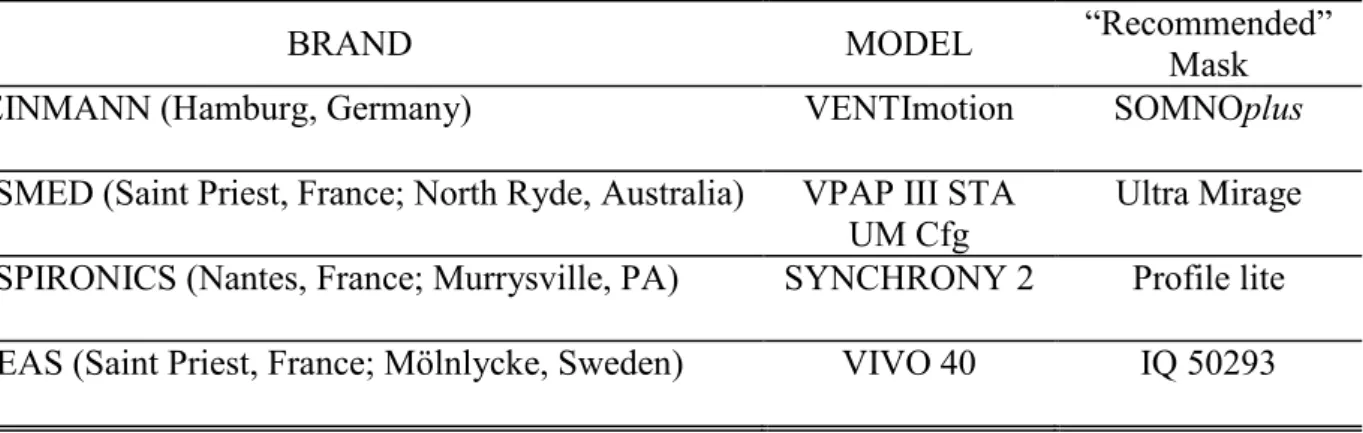
Table 2. The four ventilators tested
BRAND MODEL “Recommended”
Mask
WEINMANN (Hamburg, Germany) VENTImotion SOMNOplus
RESMED (Saint Priest, France; North Ryde, Australia) VPAP III STA UM Cfg
Ultra Mirage RESPIRONICS (Nantes, France; Murrysville, PA) SYNCHRONY 2 Profile lite BREAS (Saint Priest, France; Mölnlycke, Sweden) VIVO 40 IQ 50293
Conditions Measured parameters Ventilator Patient
profile
PS (cmH2O)
PEEP IPAP ΔT TI VT Rebreating PP
(cmH2O) (cmH2O) (msec) (sec) (ml) (% of VT) (%) V EN TI m o ti o n Obstructive disease 10 4.0 ± 0.02 14.9 ± 0.04 629 ± 106 1.6 ± 0.03 330 ± 7 0 ± 0 0.0 ± 0.1 15 4.0 ± 0.01 19.7 ± 0.04 618 ± 42 1.6 ± 0.04 375 ± 6 0 ± 0 0.0 ± 0.1 20 4.0 ± 0.02 25.3 ± 0.07 618 ± 135 1.7 ± 0.07 450 ± 24 0 ± 0 0.0 ± 0.1 Restrictive disease 10 4.0 ± 0.02 15.6 ± 0.04 224 ± 5 1.0 ± 0.00 406 ± 1 0 ± 0 31.6 ± 1 15 4.0 ± 0.02 20.3 ± 0.08 218 ± 7 1.1 ± 0.01 471 ± 1 17.2 ± 0.3 26.2 ± 1.4 20 4.0 ± 0.02 25.5 ± 0.11 218 ± 7 1.0 ± 0.59 575 ± 117 22.5 ± 5 20.3 ± 1 V P A P II I S TA U M Cf g Obstructive disease 10 3.7 ± 0.01 13.5 ± 0.02 230 ± 16 2.3 ± 0.02 478 ± 2 0 ± 0 31.1 ± 3.2 15 3.7 ± 0.01 18.3 ± 0.02 214 ± 19 2.3 ± 0.02 617 ± 2 0 ± 0 32.1 ± 3.7 20 3.7 ± 0.01 23.0 ± 0.04 248 ± 12 2.4 ± 0.01 754 ± 2 0 ± 0 24.0 ± 2.5 Restrictive disease 10 3.6 ± 0.02 13.8 ± 0.36 112 ± 5 1.0 ± 0.02 392 ± 6 0 ± 0 52.2 ± 2.6 15 3.6 ± 0.01 18.2 ± 0.03 111 ± 5 0.8 ± 0.01 366 ± 5 0 ± 0 53.1 ± 1 20 3.6 ± 0.01 22.9 ± 0.04 111 ± 5 0.7 ± 0.03 398 ± 11 0 ± 0 52.6 ± 1.1 S YNCH RO NY 2 Obstructive disease 10 3.8 ± 0.01 13.7 ± 0.02 299 ± 21 2.4 ± 0.07 500 ± 13 0 ± 0 23.1 ± 4.3 15 3.8 ± 0.13 18.7 ± 0.08 274 ± 82 2.4 ± 0.44 659 ± 122 0 ± 0 27.4 ± 13.7 20 3.7 ± 0.02 23.6 ± 0.10 248 ± 25 2.7 ± 0.20 828 ± 63 0 ± 0 28.6 ± 8.1 Restrictive disease 10 3.8 ± 0.01 15.9 ± 0.05 136 ± 3 1.0 ± 0.01 402 ± 1 0 ± 0 46.0 ± 0.7 15 3.8 ± 0.03 20.6 ± 0.06 139 ± 30 1.0 ± 0.01 450 ± 1 0 ± 0 48.8 ± 0.7 20 3.9 ± 0.01 25.4 ± 0.09 139 ± 35 1.0 ± 0.01 497 ± 1 0 ± 0 48.7 ± 1 VI VO 4 0 Obstructive disease 10 3.7 ± 0.02 12.2 ± 0.17 402 ± 46 1.9 ± 0.08 386 ± 13 0 ± 0 1.9 ± 2.6 15 3.7 ± 0.02 16.6 ± 0.10 342 ± 69 2.4 ± 0.06 558 ± 15 0 ± 0 4.4 ± 2.1 20 3.7 ± 0.07 20.8 ± 0.19 381 ± 88 2.5 ± 0.17 658 ± 47 0 ± 0 2.7 ± 2.4 Restrictive disease 10 3.7 ± 0.03 14.6 ± 0.14 217 ± 24 1.0 ± 0.01 389 ± 2 0 ± 0 19.2 ± 4.5 15 AT AT AT AT AT AT AT 20 AT AT AT AT AT AT AT
Abbreviations: PS, pressure support; PEEP, positive end-expiratory pressure ; IPAP, inspiratory positive airway pressure measured; TI,
from inspiration onset to airway pressure above PEEP; PP, pressurization performance (see methods section for the definition); AT, auto-triggering.
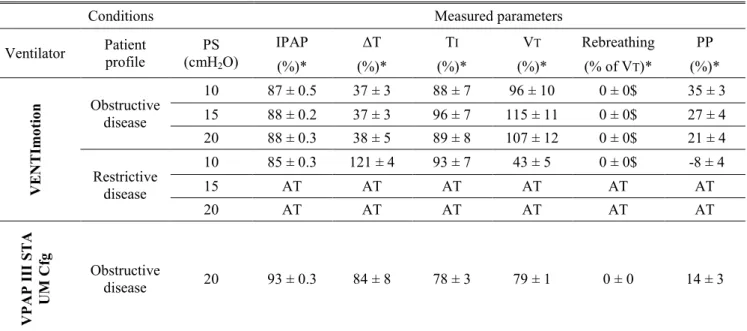
Table 4: Performance of the ventilators with the mask having the largest leak (Resmed Ultra Mirage Full Face Medium) while the ventilator
settings remained those adapted with the recommended masks.
Conditions Measured parameters
Ventilator Patient profile PS (cmH2O) IPAP ΔT TI VT Rebreathing PP (%)* (%)* (%)* (%)* (% of VT)* (%)* V EN TI m o ti o n Obstructive disease 10 AT AT AT AT AT AT 15 AT AT AT AT AT AT 20 AT AT AT AT AT AT Restrictive disease 10 AT AT AT AT AT AT 15 AT AT AT AT AT AT 20 AT AT AT AT AT AT V P A P II I S TA U M Cf g Obstructive disease 10 99 ± 0.2 49 ± 9 91 ± 4 92 ± 3 0 ± 0$ 22 ± 8 15 99 ± 0.2 45 ± 7 83 ± 3 85 ± 3 0 ± 0$ 23 ± 3 20 AT AT AT AT AT AT Restrictive disease 10 97 ± 0.2 100 ± 6$ 81 ± 5 83 ± 4 0 ± 0$ 2 ± 2 15 99 ± 0.2 97 ± 4 91 ± 1 92 ± 1 0 ± 0$ 0 ± 1 20 99 ± 0.4 95 ± 4 89 ± 1 90 ± 1 0 ± 0$ 1 ± 1 S YNCH RO NY 2 Obstructive disease 10 99 ± 0.2 88 ± 2 97 ± 4 97 ± 3 0 ± 0$ 6 ± 0 15 100 ± 0.4 96 ± 12$ 101 ± 13$ 100 ± 12$ 0 ± 0$ 2 ± 5 20 99 ± 0.5 108 ± 23$ 102 ± 0 102 ± 3 0 ± 0$ -4 ± 11 Restrictive disease 10 100 ± 0.3 103 ± 2 100 ± 0$ 100 ± 0 0 ± 0$ -2 ± 1 15 100 ± 0.3$ 103 ± 11$ 100 ± 1 100 ± 0 0 ± 0$ -2 ± 1 20 100 ± 0.3 103 ± 18$ 100 ± 1 100 ± 0 0 ± 0$ -2 ± 1 VI VO 4 0 Obstructive disease 10 108 ± 0.6 113 ± 29 112 ± 3 112 ± 3 0 ± 0$ -1 ± 1 15 106 ± 0.7 144 ± 42 105 ± 6 112 ± 3 0 ± 0$ -4 ± 1 20 106 ± 0.8 79 ± 17 96 ± 2 103 ± 2 0 ± 0$ 3 ± 3 Restrictive disease 10 98 ± 0.6 81 ± 13 100 ± 1 100 ± 0 0 ± 0$ 2 ± 3 15 AT AT AT AT AT AT 20 AT AT AT AT AT AT
Note that the Resmed Ultra Mirage Full Face Medium is recommended for VPAP III STA, but this ventilator remained configured with the Ultra Mirage, which is therefore not recommended.
*Values are percentage of baseline value with the recommended mask (Table 3), except for rebreathing, which is the percentage of VT;and PP, which is the percentage change versus baseline.
All the results were statistically different from the baseline values except results marked with $
Table 5: Performance of the ventilators with the mask having the largest leak (Resmed Ultra Mirage Full Face Medium) once the ventilator
settings were adjusted with this mask in order to reverse auto-triggering which occurred when ventilator settings were those adapted with the recommended masks.
Conditions Measured parameters
Ventilator Patient profile PS (cmH2O) IPAP ΔT TI VT Rebreathing PP (%)* (%)* (%)* (%)* (% of VT)* (%)* V EN TI m o ti o n Obstructive disease 10 87 ± 0.5 37 ± 3 88 ± 7 96 ± 10 0 ± 0$ 35 ± 3 15 88 ± 0.2 37 ± 3 96 ± 7 115 ± 11 0 ± 0$ 27 ± 4 20 88 ± 0.3 38 ± 5 89 ± 8 107 ± 12 0 ± 0$ 21 ± 4 Restrictive disease 10 85 ± 0.3 121 ± 4 93 ± 7 43 ± 5 0 ± 0$ -8 ± 4 15 AT AT AT AT AT AT 20 AT AT AT AT AT AT V P A P II I S TA UM Cf g Obstructive disease 20 93 ± 0.3 84 ± 8 78 ± 3 79 ± 1 0 ± 0 14 ± 3
*Values are percentage of baseline value with the recommended mask (Table 3), except for rebreathing, which is the percentage of VT;and PP,
which is the percentage change versus baseline.
All the results were statistically different from the baseline values except results marked with $
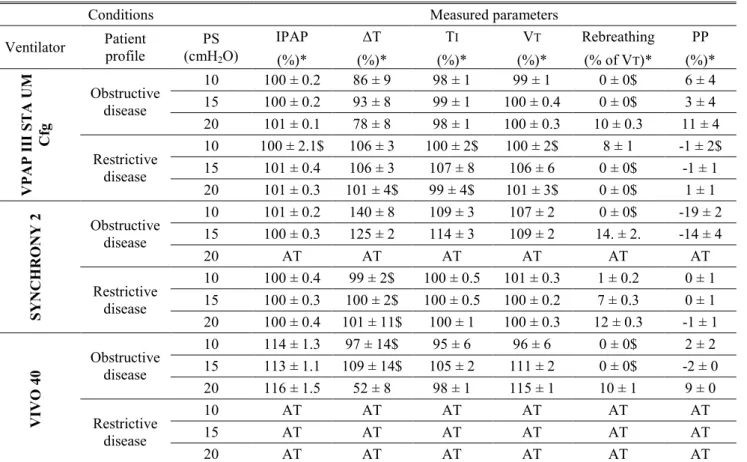
Table 6: Performance of the ventilators with the mask having the smallest leak (SOMNOplus) while the ventilator settings remained those
adapted with the recommended masks.
Conditions Measured parameters
Ventilator Patient profile PS (cmH2O) IPAP ΔT TI VT Rebreathing PP (%)* (%)* (%)* (%)* (% of VT)* (%)* V P A P II I S TA U M Cf g Obstructive disease 10 100 ± 0.2 86 ± 9 98 ± 1 99 ± 1 0 ± 0$ 6 ± 4 15 100 ± 0.2 93 ± 8 99 ± 1 100 ± 0.4 0 ± 0$ 3 ± 4 20 101 ± 0.1 78 ± 8 98 ± 1 100 ± 0.3 10 ± 0.3 11 ± 4 Restrictive disease 10 100 ± 2.1$ 106 ± 3 100 ± 2$ 100 ± 2$ 8 ± 1 -1 ± 2$ 15 101 ± 0.4 106 ± 3 107 ± 8 106 ± 6 0 ± 0$ -1 ± 1 20 101 ± 0.3 101 ± 4$ 99 ± 4$ 101 ± 3$ 0 ± 0$ 1 ± 1 S YNCH RO NY 2 Obstructive disease 10 101 ± 0.2 140 ± 8 109 ± 3 107 ± 2 0 ± 0$ -19 ± 2 15 100 ± 0.3 125 ± 2 114 ± 3 109 ± 2 14. ± 2. -14 ± 4 20 AT AT AT AT AT AT Restrictive disease 10 100 ± 0.4 99 ± 2$ 100 ± 0.5 101 ± 0.3 1 ± 0.2 0 ± 1 15 100 ± 0.3 100 ± 2$ 100 ± 0.5 100 ± 0.2 7 ± 0.3 0 ± 1 20 100 ± 0.4 101 ± 11$ 100 ± 1 100 ± 0.3 12 ± 0.3 -1 ± 1 VI VO 4 0 Obstructive disease 10 114 ± 1.3 97 ± 14$ 95 ± 6 96 ± 6 0 ± 0$ 2 ± 2 15 113 ± 1.1 109 ± 14$ 105 ± 2 111 ± 2 0 ± 0$ -2 ± 0 20 116 ± 1.5 52 ± 8 98 ± 1 115 ± 1 10 ± 1 9 ± 0 Restrictive disease 10 AT AT AT AT AT AT 15 AT AT AT AT AT AT 20 AT AT AT AT AT AT
*Values are the percentage of baseline conditions with the recommended mask (Table 3), except for rebreathing, which is the percentage of VT, and PP, which is the percentage change versus baseline.
All the results were statistically different from the baseline values except results marked with $
Conditions Measurements
ventilator Recommended Subject PEEP Peak P ΔT Ti VT Rebreathing PP
Mask (cmH2O) (cmH2O) (msec) (sec) (ml) (% of VT) (%)
VENTImotion SOMNOplus 1 3.7 18.1 265 1.2 865 0 18 2 3.7 18.4 120 1.1 919 0 46 3 3.5 21.0 169 1.2 1213 30 34 4 3.5 18.8 185 1.4 1083 5 32 Mean ± SD 3.6 ± 0.1 19.1 ± 1.3 185 ± 60 1.2 ± 0.1 1020 ± 159 9 ± 15 33 ± 12
VPAPIIISTA Ultra Mirage
Face medium 1 2.9 18.6 75 1.8 1522 0 63 2 3.1 16.8 168 1.8 1164 0 44 3 2.7 17.3 77 1.3 1160 0 62 4 2.9 18.5 77 1.8 1517 0 63 Mean ± SD 2.9 ± 0.2 17.8 ± 0.9 99 ± 46 1.7 ± 0.3 1341 ± 206 0 58 ± 9 Abbreviations: see Table 3
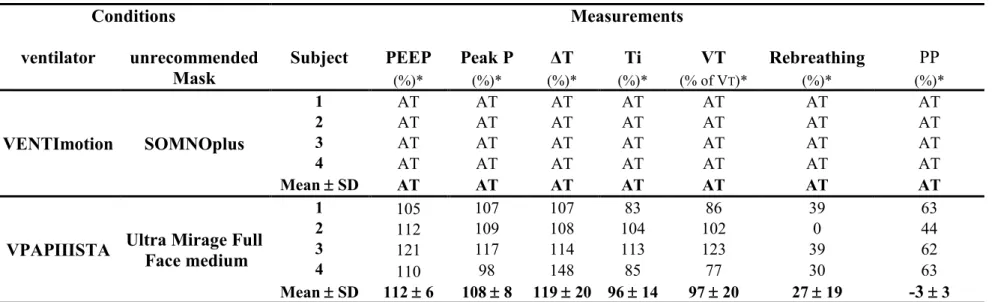
Table 8: In vivo performance of the ventilators with the unrecommended masks
Conditions Measurements
ventilator unrecommended Subject PEEP Peak P ΔT Ti VT Rebreathing PP
Mask (%)* (%)* (%)* (%)* (% of VT)* (%)* (%)* VENTImotion SOMNOplus 1 AT AT AT AT AT AT AT 2 AT AT AT AT AT AT AT 3 AT AT AT AT AT AT AT 4 AT AT AT AT AT AT AT Mean ± SD AT AT AT AT AT AT AT
VPAPIIISTA Ultra Mirage Full
Face medium 1 105 107 107 83 86 39 63 2 112 109 108 104 102 0 44 3 121 117 114 113 123 39 62 4 110 98 148 85 77 30 63 Mean ± SD 112 ± 6 108 ± 8 119 ± 20 96 ± 14 97 ± 20 27 ± 19 -3 ± 3
*Values are the percentage of baseline conditions with the recommended mask, except for rebreathing, which is the percentage of VT,and PP, which is the percentage change versus baseline
Figure 1: Lung bench test
Abbreviations: V , flow into the lung chamber; Vc, flow delivered by the ventilator; Paw, airway pressure
Figure 2 : The in vivo experimental set up.