HAL Id: halshs-00587799
https://halshs.archives-ouvertes.fr/halshs-00587799v2
Preprint submitted on 27 Apr 2012
HAL is a multi-disciplinary open access
archive for the deposit and dissemination of sci-entific research documents, whether they are pub-lished or not. The documents may come from teaching and research institutions in France or abroad, or from public or private research centers.
L’archive ouverte pluridisciplinaire HAL, est destinée au dépôt et à la diffusion de documents scientifiques de niveau recherche, publiés ou non, émanant des établissements d’enseignement et de recherche français ou étrangers, des laboratoires publics ou privés.
Hospitals in Rural China: An Analysis from Survey Data
Martine Audibert, Xiao Xian Huang, Jacky Mathonnat, Aurore Pelissier,
Anning Ma
To cite this version:
Martine Audibert, Xiao Xian Huang, Jacky Mathonnat, Aurore Pelissier, Anning Ma. Health Insur-ance Reform and Efficiency of Township Hospitals in Rural China: An Analysis from Survey Data. 2012. �halshs-00587799v2�
1
C E N T R E D'E T U D E S E T D E R E C H E R C H E S S U R L E D E V E L O P P E M E N T I N T E R N A T I O N A L
Document de travail de la série Etudes et Documents
E 2011.11
Health Insurance Reform and Efficiency of Township Hospitals in Rural China:
An Analysis from Survey Data
Martine AUDIBERT, Jacky MATHONNAT, Aurore PELISSIER, Xiao Xian HUANG,
With Anning MA
CE RDI
65 BD.F. MITTERRAND
63000 CLERMONT FERRAND - FRANCE TEL.0473177400
FAX 0473177428
2 Les auteurs
Martine Audibert
Senior Researcher at CNRS, Clermont Université, Université d'Auvergne, CNRS, UMR 6587, Centre d’Etudes et de Recherches sur le Développement International (CERDI), F-63009 Clermont-Ferrand and Institut d'Economie de la Santé et de Santé Publique (IESSP), France
Email : m.audibert@u-clermont1.fr
Jacky Mathonnat
Professor, Clermont Université, Université d’Auvergne, CNRS, UMR 6587, Centre d’Etudes et de Recherches sur le Développement International (CERDI), F-63009 Clermont-Ferrand and Institut d'Economie de la Santé et de Santé Publique (IESSP), France.
Email : j.mathonnat@u-clermont1.fr
Aurore Pélissier
PhD student, Clermont Université, Université d’Auvergne, CNRS, UMR 6587, Centre d’Etudes et de Recherches sur le Développement International (CERDI), F-63009 Clermont-Ferrand and Institut d'Economie de la Santé et de Santé Publique (IESSP), France.
Email : pelissier.aurore@gmail.com
Xiaoxian Huang
PhD, Clermont Université, Université d’Auvergne, CNRS, UMR 6587, Centre d’Etudes et de Recherches sur le Développement International (CERDI), F-63009 Clermont-Ferrand and Institut d'Economie de la Santé et de Santé Publique (IESSP), France
Email : huang.xiaoxian@gmail.com
Anning Ma
Weifang Medical University, PR China
Corresponding author: Jacky Mathonnat.
Phone: (33) 4 73 17 74 03; Fax: (33) 4 73 17 74 28; E-mail: jackymathonnat@u-clermont1.fr
La série des Etudes et Documents du CERDI est consultable sur le site :
http://www.cerdi.org/ed
Directeur de la publication : Patrick Plane
Directeur de la rédaction : Catherine Araujo Bonjean Responsable d’édition : Annie Cohade
ISSN : 2114-7957
Avertissement :
Les commentaires et analyses développés n’engagent que leurs auteurs qui restent seuls responsables des erreurs et insuffisances.
3 Abstract
In the rural health-care organization of China, township hospitals ensure the delivery of basic medical services. Particularly damaged by the economic reforms implemented from 1975 to the end of the 1990s, township hospitals efficiency is questioned, mainly with the implementation since 2003 of the reform of health insurance in rural areas. From a database of 24 randomly selected township hospitals observed over the period 2000-2008 in Weifang prefecture (Shandong), the study examines the efficiency of township hospitals through a two-stage approach. As curative and preventive medical services delivered at township hospital level use different production processes, two data envelopment analysis models are estimated with different orientation chosen to compute scores. Results show that technical efficiency declines over time. Factors explaining the technical efficiency are mainly environmental characteristics rather than internal factors, but our results suggest also that in the context of China, the efficiency of township hospitals is influenced by unobservable factors.
key words: Data Envelopment Analysis, Technical Efficiency, China, New Rural Cooperative Medical Scheme, Township Hospitals.
JEL Classification: G22, I1, I38, O12.
Abbreviations: Township Hospitals (THs), New Rural Cooperative Medical Schemes (NRCMS), Decision Making Unit (DMU), Data Envelopment Analysis (DEA), Soft Budget Constraint (SBC).
Acknowledgement
This paper is part of a research program in collaboration with the Medical Weifang University. It has been supported by the Embassy of France in China and by the University of Auvergne. It has benefited from very useful comments and suggestions from, Paul Richards (University of Sheffield), Yohana Dukhan (World Bank), from members of Weifang Health Bureau, participants of the 3rd International Conference on Health Financing in Developing and Emerging Countries (Clermont-Ferrand, France), of the 9th International Conference on Data Envelopment Analysis (Thessaloniki, Greece), of the 3rd Joint CES/HESG Workshop (Aix-en-Provence, France) and several colleagues from CERDI.
4
1 Introduction
In the rural Chinese healthcare system, township hospitals (THs) play an essential role: they represent the main providers of primary healthcare in rural areas [1]. THs constitute the intermediate level of healthcare facilities and ensure the link between village health stations at the grassroots level and county or above-level hospitals. They supervise healthcare delivery at the level of village health stations, and play the role of gate keeper, to orientate patients toward higher health facilities levels. They offer a wide-ranging set of general medical services by delivering curative and preventive activities, from vaccinations and laboratory tests to outpatient visits, basic surgical interventions and inpatients care.
The Chinese rural healthcare system has deeply evolved since the 1950s. From 1950 to 1975, China achieved significant improvements in health outcomes, thanks to the definition of an efficient three-tier system of healthcare delivery and a successful community-based rural health insurance scheme [2, 3]. However, economic transition (1975-1990) caused the disorganization of these two pillars of the rural healthcare system [4, 5]1. First, the Cooperative Medical System (CMS) collapsed. While in 1975 quasi-universal coverage was achieved in rural areas, less than 10% of the rural population was still insured in the 1990s [3]. Second, the three-tier system, composed by village health stations, township and county hospitals (from lower level to upper one), was disrupted. Efficiency of township hospitals has declined due to the economic reforms [2, 8]. The budget decentralization (1979) and the management reform of THs (1983) led them to look for profitable activities [1, 4]. As a consequence, negative externalities came to light: the quality of healthcare declined, healthcare prices increased, expensive technologies were overused, drugs were overprescribed, the average length of stay increased and preventive activities were neglected to privilege expensive curative activities [1-3, 6]. The collapse of the CMS disturbed the referral system. Moreover, as THs suffered from bad reputation, patients bypassed them to go directly to county hospitals [3]. This phenomenon was enhanced by the increase of the rural income leading patients to look for higher quality of services and enhancing their capacity to pay for health [4]. Thus, the activity of THs fell off.
Since 2003, the implementation of the New Rural Cooperative Medical System (NRCMS) served mainly two objectives. The first one is to offer an e insurance system to the rural population, in order to lower the financial barrier to access to the healthcare system and to
5 improve the rural population’s health [5]. The second one is to make attractive the THs, which suffered from the economic liberalization, by re-orientating patients toward this level.
The question of the THs’ efficiency is crucial, as regard to their strategic position into the healthcare delivery chain and the changes they experienced over the preceding years, but also in a context of scarce resources, of vertical and horizontal competition and health insurance reform. By targeting THs, more especially than others health facilities in Weifang prefecture on which this study is focused, the NRCMS can influence the activity and the efficiency of these facilities. The main channels are the likely increased of demand induced by insurance and the implementation of contracts. Therefore, identifying the main determinants of THs’ efficiency can help the design of relevant policy measures.
The originality of this study is twofold. First, it deals with the analysis of the technical efficiency of a sample of THs in the production of healthcare services in a rural area in China. According to the reviews of Hollingsworth [10] and O’Neill et al. [11], the literature on efficiency mainly concentrates on USA and Europe health facilities, and none study is listed on the estimation of technical efficiency in China (mainland). In our knowledge, only two articles study the technical efficiency in Taiwan [12, 13], which is a quite different area than the continental rural China. Nonetheless, as it was underlined in the preceding paragraph, having a better understanding of the efficiency of THs is important to guide health policies. Secondly, the paper focuses on a case-study with a sample of 24 randomly selected THs observed over the period 2000-2008. A two-stage approach is applied: i) technical efficiency is computed from Data Envelopment Analysis (DEA); ii) technical efficiency scores are regress on a set of explicative variables.
The remainder of the paper is the following. Section 2 presents the data. The methodology to estimate the technical efficiency and their determinants are respectively examined in Sections 3 and 4, and results are in Section 5. Section 6 ends with discussion and conclusion.
2 Data
The original dataset covers 24 randomly selected THs of Weifang prefecture, in Shandong province (about 14% of total THs in Weifang prefecture) observed over a nine-year period, from 2000 to 2008. Information was collected from the Weifang Health Bureau database and the registers/books of the THs during the third quarter of 2009 in collaboration with the Weifang Medical University and Chinese authorities. Data were checked and new investigations have been implemented in TH if necessary and completed with interviews.
6 Table 1 presents the descriptive statistics on the environmental characteristics of the THs. Over the period, the THs operate into a quite changing environment. The population is mainly rural in the sample and the density increased by 6%. The rural net income per capita (in constant prices) increases by 66% over the period, from on average 3,387 Yuan over the period 2000-2003 to 5,251 Yuan over the period 2006-2008. The implementation of the NRCMS was gradual among the townships studied, from 2003 to 2006. The cover rate increases largely between 2003 and 2008 and over the period 2006-2008 the vast majority of the population adopts the NRCMS (95.28%). The ratio of the number of village health stations per 1,000 households reflecting the physical accessibility to village health stations remains quite stable over the period. The distance of the THs to the county hospital is between 10 and 50 kilometers with an average of 25 kilometers. The good quality of roads in Weifang prefecture lowers the physical constraint to the access to the county hospital or to upper-level ones, and then contributes to the intensification of the competition between THs and county hospitals. It can also favor technical support from county hospitals to THs.
TABLE 1
Table 2 summarizes the THs’ characteristics. THs offer two kinds of medical services: curative and preventive healthcare services. The first one consists mainly of medical consultations and inpatient cares while the second one essentially consists of vaccinations. Medical consultations represent the major share of the curative activities led by THs. It accounts for at least 95% of the volume of curative healthcare services delivered over the period. The pattern is similar when central and general THs are observed separately. Central THs are larger than general ones as shown in Table 2. Central THs delivered on average a more important volume of medical services than general ones, particularly as regard to the number of outpatients treated (almost two times more outpatient visits). Furthermore, central THs are better equipped than general ones. Overall, the volume of medical services increases over the period.
The size of the THs is relatively small with on average 39 beds, 45 curative medical staff and six preventive staff over the period. However, the number of beds varies from 16 to 150, reflecting large disparities in the size of THs. The dataset consist of nine central THs and 15 general THs. Overall, the size of THs, as measured by the human and physical resources available, increased over the period.
7 2.1 Estimation of technical efficiency
Developed in 1957 by Farrell [14], the concept of technical efficiency refers to the capacity of a decision making unit (DMU) to transform a quantity of inputs into amount of outputs. The technical efficiency of DMUs is studied through the framework of the efficiency frontiers [15]. The parametric stochastic approach, Stochastic Frontier Analysis (SFA) and the non-parametric determinist approach, Data Envelopment Analysis (DEA) are the methods the most employed in production frontier analysis literature. In this study, the DEA approach is used for three main reasons. SFA requires modeling the function of production. However, the functional form of the production frontier is not accurately known due to the multi-outputs of THs production and the difficulties in defining the objective(s) of hospital behaviors. Moreover, SFA necessitates assumptions on the distribution of the error term which partially represents the technical inefficiency. In contrast, DEA extracts the shape of the production frontier from the data and so does not requires assumption on the functional form of the production function or the distribution of the error term [16, 17]. Such method allows estimating the technical efficiency of a particular set of DMUs, measuring the efficiency of each DMU relatively to the others, which is particularly convenient in the context of this study as it treats of a case-study in a managerial perspective.
2.2 The DEA models
DEA estimates a discrete piecewise frontier from a mathematical linear program [16]. The efficiency frontier corresponds to the ‘best practice observed’ in the sample, in terms of the maximum quantity of outputs produced for a given quantity of inputs (output orientation) or in terms of the minimum use of inputs to produce a fix amount of outputs (input orientation). The efficiency frontier is constituted by the fully efficient DMUs and envelops the inefficient DMUs. Thus, the technical efficiency of a DMU is measured relatively to the achievement of the others [14, 18]2 and technical efficiency scores are included in the interval [0; 100], from total inefficiency to full efficiency.
As the purpose is to model the production function of the DMUs, DEA requires the specification of the inputs used to produce the outputs, the orientation of the model, the nature of the return to scale and the temporal dimension to run the DEA model. THs deliver two main kinds of medical activities: curative and preventive healthcare services, which are
2 DEA was described in many papers and manual books over the last decades. In this paper, the complete and mathematical
presentation of the methodology is not given. For more details, cf. this no-exhaustive list of works: [14, 16, 18-20] for a more complete overview of the approach.
8 characterized by two different production processes with two different objectives. Thus, two distinct DEA models are defined.
The model characterizing the production process of curative activities consists of one output and three inputs. THs delivered a large set of curative activities. Therefore, the number of outputs used into the DEA framework needs to be minimized3, but the diversity of activities has to be taken into account. A composite index is calculated using a workload equivalent weighting system4 suggested by a Chinese experts committee5 and already used in a previous study [24]. Two main categories of inputs enter in the curative production process of THs: staff and equipment. The former are measured by the number of curative staff members, while equipment includes the number of operational beds and a composite index which gets the endowment of the TH in equipment. It is computed from principal component analysis and incorporates the number of operational X-ray, echograph, endoscope and electrocardiogram6. The objective assigned to THs is to maximize the volume of healthcare delivered, i.e. an output orientation is relevant.
The model characterizing the production process of preventive activities consists of one output (the total volume of vaccinations delivered) and one input (the number of staff for preventive activities), as only human resources are used to produce preventive activities. The level of production is previously defined by the government. The input orientation appears more suitable as THs can minimize their use of preventive resources in order to produce the target volume of preventive activities.
For both DEA models, the nature of the variable return to scale and the temporal dimension are similarly defined. Variable returns to scale are assumed in our study as a managerial perspective is adopted [17] and as we can expect the presence of scale economies in an environment of imperfect competition over the health care market. So the BCC model is used [19]. Moreover, the size of THs differs, indicating that they are not operating on the same scale. Longitudinal data being available, a choice must be made between estimating a frontier for each year or an overall frontier by pooling all data together [25]. This former approach is mainly used when the temporal dimension is weak as the major assumption is that data can be pooled if no technical progress is assumed to drive the efficiency frontier over the period. In such case, the technological constraint is the same over the period. However, this
3 The rules of thumb are explained in Raab & Lichty [21] and Boussofiane & Dyson [22]. 4 For more details, see Coca [23].
5 Weights defined by a Chinese experts committee are the following: Outpatients visit=1, Inpatient=3, Emergency visit=2,
Medical visit=5.72, Laboratory test=1.
6 The results of the principal component analysis lead to retain only the component 1 as the Eigen value equals 2.18806. It is
9 assumption is quite strong as regard to the period studied (2000-2008). Thus, three “contemporaneous” frontiers [26] are estimated respectively over the three-year periods 2000-2002, 2003-2005 and 2006-2008. It is quite reasonable to assume that over a period of three years there is no technological progress. Moreover, this decomposition corresponds also to the implementation of the NRCMS. In 2003, the NRCMS is introduced gradually until 2006 where all townships of the sample are covered.
Despite the fact that case-mix was not taken into consideration because of the lack of data, the potential bias occurrence is not a relevant issue here as THs are homogeneous in terms of disease treated (source: personnal communication from Weifang Health Bureau). They are located in the same prefecture and face similar disease pattern. They belong to the same hierarchical level in Chinese health delivery system and have therefore common missions defined by the government. Furthermore, according to our data, severe cases are treated in county hospitals and THs mainly deal with respiratory and cardiovascular pathologies, diabete and injuries. Inpatient activity represents a weak share of the curative activities delivered by THs (less than 5% of patients in average).
3 Determinants of technical inefficiency
From a theoretical perspective, determinants of efficiency should be linked to a relevant model of THs behaviour. Explanatory variables of hospital efficiency used in the literature include a variety of hospital specific characteristics (more or less atypical such as the type of ownership, physicians as a share of medical staff, ratio of full-time-equivalent physicians to other full-time personnel, the number of referrals, financial characteristics [24, 27-29] and market factors (such as GDP, number of beds in private sector, density of health facilities [17, 30]. Experiments that link bonus to efficiency targets have also been used [31].
In line with the existing literature and the discussion with the Chinese partners, this paper focus on two kinds of factors which can contribute to explain the efficiency level of THs: the internal characteristics of THs and the characteristics of the environment in which THs are integrated. Two Tobit models are estimated, one for efficiency scores calculated from the curative DEA model and one from the preventive DEA model as explaining factors may differ for both estimations.
3.1 Internal factors
The nature, central or general, of the TH can influence differently the technical efficiency. Central THs are bigger than general ones, in terms of the volume of outputs produced and of
10 inputs available. This difference of size can influence differently the technical efficiency of THs (returns to scale for example),
The composition of the staff (balance between qualified and unqualified staff), the staff work load and staff incentives are also considered as important channels for technical efficiency [30, 31]. Variables are different according to the production process. We consider the proportion of qualified staff in the total staff for the regression on the curative technical efficiency as high ratio is expected to have an attractive effect on patients. The number of households per preventive staff is used in the regression on preventive technical efficiency as the delivery of preventive activities is often much more managed by coverage rate considerations than by qualification of staff considerations.
The efficiency of THs may be subjected to financial constraints [32], creating a hard or a soft budget constraint (SCB). As pointed out by Kornai [33] (p. 119-120), SBC is “not a single event, (...) but a mental condition, present in the head – the thinking, the perception of a decision maker (...). There are grades of harness and softness”. That means that indicators should be continuous, not discrete. Theoretical and empirical literatures provide us with some evidence showing that SBC can decrease efficiency. Regarding THs, one of the most important factors of budget constraint comes from the current share of subsidies in total expenditures (excluding staff related expenditures), rather than from the deficit, as deficit integrates a kind of informal “agreement” (the so called “guanxi”) between each TH, the health authorities and local municipalities. Therefore, a high proportion of subsidies may have a negative effect on efficiency as they lower the financial constraint of THs, creating a “soft budget” constraint”. Selecting the current amount of subsidies (ratio), instead of the lagged one, is relevant because the volume of subsidies cannot be anticipated by the TH as it is decided at the beginning of the year. A small share can pressure THs to be more efficient whereas an important one may dissuade them for improving their technical efficiency.
We then also take into consideration the potential effect that the efficiency of a TH in a specific production process (for example, in the curative healthcare delivery) can have on the efficiency of this same TH in other production process (for example, in the preventive healthcare delivery). To assess cross services potential additional effects between efficiency behaviour in different production technologies, efficiency scores of the curative DEA model are introduced into the regression of the determinants of preventive efficiency. The scores of curative DEA model are included into the regression for preventive activities.
11 The structural characteristic of the township is measured by the density of the population in the township. It can influence the demand addressed to the THs and thus the volume of medical services they delivered.
The relationship of the TH with its environment is measured by two sets of variables. The density of village health stations (measured by the number of village health stations per 10,000 households) and the distance of the TH to the nearest county hospital reflect the geographical environment of THs. The density of village health stations can have two opposite effects on the efficiency of THs. A negative effect may be expected as village health stations and THs might compete for the delivery of preventive activities and basic medical consultations. A positive effect may occur when village health stations refer some patients to the TH level [30]. In the same way, the distance can have two opposite effects. A negative effect as county hospitals are better equipped and their quality is considered by people to be higher than that of THs. A positive effect as the nearness of the county hospital can reinforce the technical support of county hospital to THs, and thus help to improve their technical efficiency. Two variables measuring the economic environment of THs are retained: the rural income per capita and the NRCMS cover rate. The development level of the township and the health insurance coverage of the population can create a stimulating environment for THs to enhance the technical efficiency. In contrast, a high level of development and a high coverage rate of the population by the NRCMS can also lower the constraint on the production process. As THs are a target of the reform of the NRCMS, it seems to be appropriate to estimate to what extend the insurance scheme can be a control tool to impact the efficiency of THs.
4 Results and Discussion
4.1 Curative technical efficiency
Table 3 presents the results from the curative DEA model.
Overall, the technical efficiency decreases over the period 2000-2008, and more particularly from 2006 to 2008. The changes in the median values lead to the same conclusions. During the period 2000-2003, the technical efficiency reaches almost 70% on average, indicating that THs are globally efficient but can improve the volume of curative activities delivered by 30% without any changes in the level of inputs used. In contrast, the average technical efficiency decreases to 50% over the period 2006-2008, reflecting a high level of inefficiency of THs, which only attract the half of the activity they can produce according to the level of inputs they mobilized. A Krukal-Wallis test confirms that efficiency
12 scores are significantly different between the three periods (P value=0.001). Coefficients of variations show that heterogeneity between THs increases over the time.
Among the inefficient units, the potential of output improvement with the same level of inputs increases largely over the period, from 35% to 57%. As previously, the Kruskal-Wallis test shows that there is a significant difference in technical efficiency scores among the inefficient units over the three periods (P value= 0.001).
Technical efficiency of THs differs between counties. For example, over the period 2000-2008, the THs of Shouguang are on average the most efficient (76%) while that of Gaomi are the less efficient (50%).
Overall, two groups emerge: one group of counties with a quite high level of technical efficiency (at least 70% on average), and one group of counties weakly efficient (at maximum 59%). The analysis per period highlights that in all counties the average technical efficiency declines over the period 2000-2008.
TABLE 3
The distribution of technical efficiency scores over the three periods shows the large increase of the proportion of inefficient THs (Graph 1). Over the period 2000-2002, 25% of THs can produce at least two times more output than they do, with the same level of inputs. This proportion reaches 60% for the period 2006-2008. Among these highly inefficient THs, the share of THs with very low technical efficiency (scores equal or inferior to 30) quadrupled. When considering intermediate levels of technical efficiency, the proportion of THs declines over the periods, especially for those with scores included in the interval ]0.7; 0.9]. In contrast, the share of highly efficient THs evolves differently among periods. The proportion of those THs increases between the first and the second periods and decreases between the second and the third periods. Moreover, the share of highly efficient THs is lower over the period 2006-2008 than over the period 2000-2002 (22% rather than 15%). The trend is similar when considering exclusively the number of fully efficient THs (score=100).
GRAPH 1
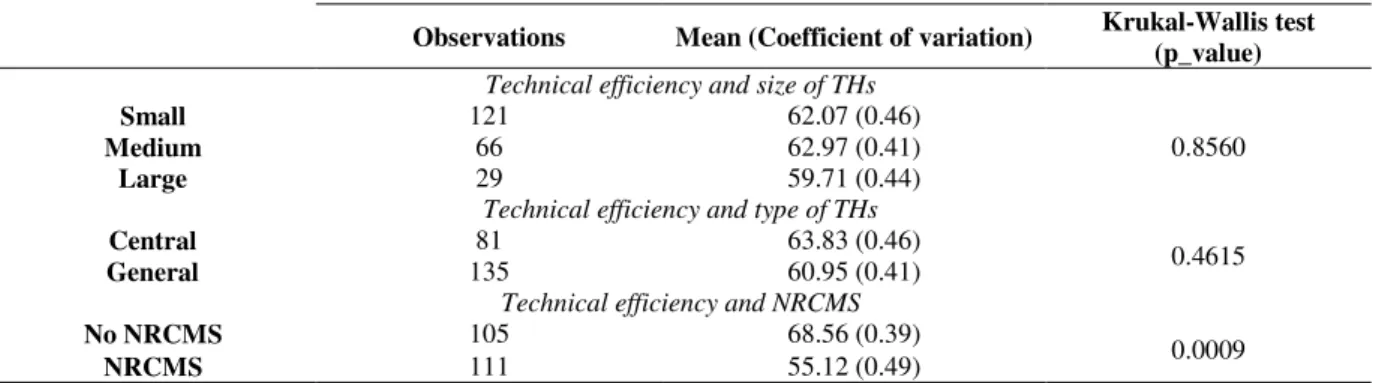
Table 4 presents the technical efficiency scores according to three criteria: the size of the THs, the type of the THs and the presence of the NRCMS in the township. The technical efficiency of THs does not significantly differ according to the size of their as shown by the means and the Krukal-Wallis test, suggesting no important returns to scale. Similarly, the
13 technical efficiency is not significantly different between central and general THs. In contrast, the technical efficiency is significantly different according to the presence or not of the NRCMS. THs’ technical efficiency is on average higher when there is no NRCMS in the township rather than when the NRCMS is implemented.
TABLE 4 5.2 Preventive technical efficiency
Table 5 presents the results from the preventive DEA model. Over the period 2000-2008, the technical efficiency of THs is weak and deteriorates. THs can reduce the quantity of inputs used by at least 40% over the whole period without any changes in the volume of output produced. The average technical efficiency of THs decreases by 42%, from an average score of 60% over the first period (2000-2002) to an average score of 35% over the third period (2006-2008). The decline occurs more especially between the first and the second periods (-27%). A Krukal-Wallis test confirms that efficiency scores are significantly different between the three periods (P value=0.0001). Standard deviations show that heterogeneity between THs slightly decreases over periods.
Among the inefficient units, the technical efficiency worsens and the potential of input reduction increases largely over the period, from 55% to 70%. The Kruskal-Wallis test shows that there is a significant difference in technical efficiency scores among the inefficient units over the three periods (P value=0.0002). As previously, the changes in standard deviations show that the heterogeneity weakly decreases among inefficient THs.
The analysis of technical efficiency per county stresses three facts. Firstly, technical efficiency declines continuously over the period 2000-2008 and is almost - for example - divided by two in some counties (Anqui, Gaomi, Qinzhou and Zhoucheng). Besides, one county (Qinzhou) always registered the lowest average score of technical efficiency whatever the considered period. The THs of this county have a very weak technical efficiency with on average a score of 24%, indicating that the volume of inputs used to produce a fix quantity of output can be reduced by 68%. Lastly, one county (Gaomi) is always ranked among the first three counties, recording the highest average level of technical efficiency.
TABLE 5
Over the three periods, the proportion of very inefficient THs enlarges while that of highly efficient ones lessens (Graph 2). During the first period, half of the THs are very inefficient
14 (scores lower than 50). Over the period 2006-2008, this share reaches 80% reflecting that the vast majority of the THs can reduce at least by the half their consumption of inputs without altered the volume of preventive activities delivered. Among these inefficient THs, the proportion of THs with a score included between the interval ]30;50] remains quite stable while that of THs recording very weak levels of technical efficiency (score equal or inferior to 30) tripled between the first and the third periods. The proportion of THs with intermediate or high levels of technical efficiency declines over the periods, especially the share of highly efficient THs (score superior to 90). In the same way, the number of fully efficient units is divided by three between 2000-2002 and 2003-2005 (from 19 to 6 fully efficient units).
GRAPH 2
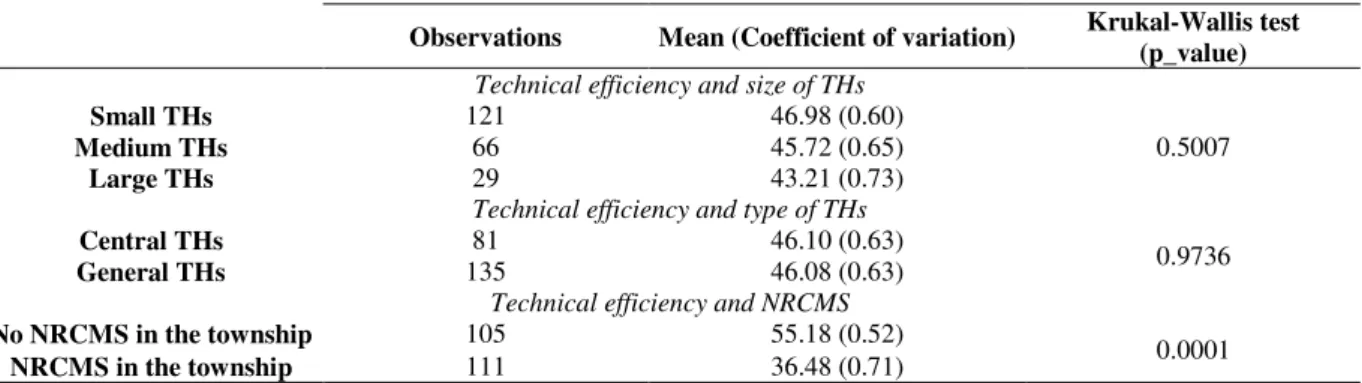
Considering the technical efficiency of THs according to the three criteria mentioned above (size, general or central TH, in an area with or without NRCMS) leads to similar conclusions than for the analysis of curative technical efficiency scores (Table 6). The Kruskal-Wallis tests show that the technical efficiency of THs does not significantly differ according to the size or to the type of THs. In contrast, the technical efficiency is on average higher when there is no NRCMS in the township rather than when the NRCMS is implemented and the difference is significant according to the Kruskal-Wallis test.
TABLE 6
4.2 The determinants of the technical inefficiency of THs
Among the factors influencing the technical efficiency of THs, few internal characteristics are significant (Table 7). The share of subsidies in total expenditures influences negatively the technical efficiency of THs. As underlined previously, the increase of the share of current subsidies create a softer budget constraint and does not incite THs to improve its technical efficiency in the curative production process by attracting patients. The number of households per preventive staff influences positively the preventive technical efficiency
On the contrary, the preventive technical efficiency plays a negative role on the technical efficiency in the curative production process. We were rather expecting a positive effect as patients discussions with medical staff during preventive activities could have pushed people to get in touch with curative services of the TH. Our results show also that the status of the TH (general or central) and their size have no significant effect on their efficiency. The
15 econometrics results confirm the conclusions of the non-parametric Kruskal-Wallis tests in the preceding paragraphs.
In contrast, the technical efficiency of THs seems to be more particularly affected by the environmental characteristics. The economic environment, measured by the rural net income per capita and the NRCMS cover rate, influences negatively the curative and the preventive technical efficiency. Potential explanations are relative to the effects created by a favorable economic environment on the production process of THs7. THs located in richer townships or in township with higher coverage by the NRCMS can expected a higher potential demand than others. Facts are similar when a TH experienced an improvement of the insurance coverage situation in the township. As a consequence, it may induce a softer budget constraint often associated with less control of cost and of expenditures. This situation leads to a deterioration of the technical efficiency. This finding is consistent for example, with Shu and Eggleston [35] who found in their study that hospitals facing softer budget constraints were less aggressive for cost control. Puenpatom & Rosenman [30] also found that if more financial reserve could help stabilize the hospital’s financial status in Thailand, it contributes to decrease efficiency. But, as suggested by Eggleston et al. [36] in their study on a sample of hospitals in Guangdong province in China (2009), a soft budget constraint can have positive effects on other dimensions of performance, such as quality8.
The density of village health station influences positively the curative technical efficiency. As THs and village health stations activities are complementary, rather than competitors, these two results suggest that the referral link between village health stations and THs reinforces the curative technical efficiency of the TH. Such a kind of link between referrals and efficiency was also found by Puenpatom & Rosenman [30] in the sense that more patients entering into the system at the bottom and more referrals improve efficiency in Thai provincial public hospitals.
Therefore, the lack of other significant traditional variables reflects the fact that efficiency of THs to produce curative activities is also driven by unobservable variables, such as the dynamism of the director of the hospital, the relations (fair or not) between the director and the staff, and the so called politico-administrative network “guanxi”, one of its effect been already captured in our analysis of SBC. The likely influence of guanxi has been confirmed by our discussion with several Chinese interlocutors.
7 There is no close correlation between the NRCMS cover rate and the ratio subsidies over expenditures at hospital level, as
the coefficient of correlation equals -0.2437.
8 Other studies have shown (for example for Brazil: La Forgia and Couttolenc, [37] that high efficiency does not necessary
16 In addition, it will be interesting to conduct more investigations on the social organization of the environment [34] to detect variables that can influence the technical efficiency of THs. But, none qualitative information were available and could be collected in that field during this study.
TABLE 7
5 Conclusion
During the last ten years, China undertook important health reforms that concern supply and demand sides of healthcare, as insurance in rural area. Health insurance reform has been ongoing into several waves. The reform of health insurance (NRCMS) displays at least two objectives. The first is to increase healthcare access for rural population; the second to improve the performance of health system, more specifically, of THs, as observed in Weifang prefecture. We focused on the second goal and studied the technical efficiency and its determinants among 24 Chinese THs using a two-stage analysis, including DEA and Tobit regressions from 2003 to 2008.
Our main results show that the potential for efficiency improvements are large both for the curative production process and for the preventive one. Moreover, the technical efficiency of THs declines over the period and the heterogeneity between countries, which is large, increases over the time. Nevertheless, no significant differences in curative and preventive technical efficiency are detected according to the status (general or central), or the size of the THs.
The analysis of the factors influencing the technical efficiency of THs confirms that internal characteristics which were possible to capture with quantitative data do not play a major role to determinate the technical efficiency level in contrast to the role of the environmental factors. Results suggest that increasing the insurance coverage created a softer budget constraint that negatively influences THs’ efficiency. They also show that village health stations and THs activities are complementary. Village health stations refer patients to THs, a fact which can also be enhanced by the potential positive effect of the NRCMS on the volume of consultations at village health stations level (more patient means more patients referred), what has a positive effect on TH efficiency. Finally, the efficiency of THs seems to also depend on unobservable factors which cannot be taken into consideration with the available data from the Chinese information system and with the data which was possible to
17 collect within our sample of TH. More research in that field would be necessary to have a better understanding of factors driving the management and efficiency of THs in China.
As far as the limitations of this study, one could consider that our results lie on a relatively small THs’ sample. But, as we mentioned it previously, our findings are representative of THs of the Weifang Prefecture (14% of all the THs) as we used a randomized process of selection of the hospitals and as they are from a nine years survey period.
18
References
[1] S. Hillier, J. Shen, Health care systems in transition: People's Republic of China. Part I: An overview of China's health care system, Journal of Public Medicines. 18 (1996) 258-265. [2] W.C., Hsiao, The Chinese Health Care system: lessons for other nations, Social Sciences & Medicine. 41 (1995) 1047-1055.
[3] World Bank, Financing Health Care: issues and options for China, World Bank, Washington DC, 1997.
[4] X. Liu, L. Xu, S. Wang, Reforming China’s 50,000 Township Hospitals: Effectiveness, Challenges, and Opportunities, Health Policy. 38 (1996) 13-29.
[5] A. Wagstaff, M. Lindelow, S. Wang, S. Zhang, Reforming China’s Rural Health System, World Bank, Washington DC, 2009.
[6] K. Eggleston, L. Ling, M. Qingyue, M. Lindelow, A. Wagstaff, Health Service delivery in China: a literature review, Health Economics. 17 (2008) 149-165.
[7] W.C. Hsiao, Transformation of health care in China. The New England Journal of Medicine. 310 (1984) 932-936.
[8] Y. Liu, K. Rao, S. Hu, People’s Republic of China. Toward Establishing A Rural Health Protection System, Asian Development Bank, Beijing, 2003.
[9] W. Yip, W.C. Hsiao, The Chinese health system at a crossroads, Health Affairs. 27 (2008) 460-468.
[10] B. Hollingsworth, Non-Parametric and Parametric Applications Measuring Efficiency in Health Care, Health Care Management Science. 6 (2003) 203-218.
[11] L. O’Neill, M. Rauner, K. Heidenberger, M. Kraus, A cross-national comparison and taxonomy of DEA-based hospital efficiency studies, Socio-Economic Planning Sciences. 42 (2008) 158-189.
[12] H. Chang, Determinants of Hospital Efficiency: the Case of Central Government-owned Hospitals on Taiwan, International Journal of Management Sciences. 26 (1998) 307-317.
19 [13] H. Chang, M. Cheng, D. Somenath, Hospital Ownership and Operating Efficiency: Evidence from Taiwan, European Journal of Operational Research. 159 (2004) 513–527. [14] M.J. Farrell, The measurement of productive efficiency, Journal of the Royal Statistical Society, Series A (General). 120 (1957) 253-290.
[15] F.R Førsund, C.A. Lovell Knox, P. Schmidt, A survey of frontier production functions and of their relationship to efficiency measurement, Journal of Econometrics. 13 (1980) 5-25. [16] A. Charnes, W.W. Cooper, A.Y. Lewin, L.M. Seiford, Data Envelopment Analysis: Theory, Methodology and Application, Kluwer Academic Publishers, Boston, 1994.
[17] R. Jacobs, P.C. Smith, A. Street, Measuring Efficiency In Health Care, Cambridge University Press, New York, 2006.
[18] A. Charnes, W.W. Cooper, E. Rhodes, Measuring the efficiency of decision making units, European Journal of Operational Research. 2 (1978) 429-444.
[19] R.D. Banker, A. Charnes, W.W. Cooper, Some models for estimation technical and scale inefficiencies in Data Envelopment Analysis, Management Science. 30 (1984) 1261-1264. [20] L. Seiford, R.M. Thrall, Recent Developments in DEA. The mathematical programming approach to frontier analysis, Journal of Econometrics. 46 (1990) 7-38.
[21] R. Raab, R. Lichty, Identifying sub-areas that comprise a greater metropolitan area: the criterion of county relative efficiency, Journal of Regional Science. 42 (2002) 579-594.
[22] A. Boussofiane, R.G. Dyson, Applied data envelopment analysis. European Journal of Operational Research. 52 (1991) 1-15.
[23] E. Coca, Les inégalités entre hôpitaux, Obstacle à l'efficacité et à l'équité de la maîtrise des dépenses hospitalières, Berger-Levrault, Paris, 1995.
[24] M. Audibert, Y. Dukhan, J. Mathonnat, N. Chen, A. Ma, A. Yin, Activité et performance des hôpitaux municipaux en Chine rurale – Une analyse sur données d’enquêtes dans la province de Shandong, Revue d’Économie du Développement. 1 (2008) 63-100.
[25] M. Mbangala, S. Perelman, L'efficacité technique des chemins de fer en Afrique Subsaharienne: une comparaison internationale par la méthode DEA, Revue d’Economie du Développement. 3 (1997) 91-115.
20 [26] H. Tulkens, La performance productive d’un service public. Définitions, méthodes de mesure et application à la Régie des Postes en Belgique, L'Actualité économique. 62 (1986) 306-335.
[27] A. Her, Cost and technical efficiency of German hospitals: does ownership matter? Health Economics. 17 (2008) 997-1105.
[28] G.P. Barbetta, G. Turati, A.M. Zago, Behavioral differences between public and private not-for-profit hospitals in the Italian national health service, Health Economics. 16 (2007) 75-96.
[29] M. Duggan, Hospital Ownership and Public Medical Spending, Quaterly Journal of Economics. 65 (2000) 1343-73.
[30] A.R. Puenpatom, R. Rosenman, Efficiency of Thai provincial public hospitals during the introduction of universal health coverage using capitation, Health Care Management Sciences. 11 (2008) 319-338.
[31] W. Yip, W.C. Hsiao, Q. Meng, W. Chen, X. Sun, Realignment of incentives for health-care providers in China, Lancet. 375 (2010) 1120-1130.
[32] A. Preker, A. Harding, Innovations in health services delivery – The corporatization of public hospitals, Human Development Network, Health, Nutrition and Population series, World Bank, Washington DC, 2003.
[33] J. Kornai, The soft budget constraint syndrome in the hospital sector, International Journal of Health Care Finance and Economics. 9 (2009) 117-135.
[34] D. Meltzer, J. Chung, P. Khalili, E. Marlowa, V. Arora, G. Schumock, R. Burt, Exploring the use of social network methods in designing healthcare quality improvement teams, Social Sciences and Medicine. 71 (2010) 1119-1130.
[35] Y.C. Shu, K. Eggleston, The effect of soft budget constraints on access and quality in hospital care, International Journal of Health Care Finance Economics. 9 (2009) 211-232. [36] K. Eggleston, Y.C. Shen, M. Lu, C. Li, J. Wang, Z. Yang, J. Zhang, Soft budget constraints in China: Evidence from the Guangdong hospital industry, International Journal of Health Care Finance and Economics. 9 (2009) 233-242.
21 [37] G.M. La Forgia, B.F. Couttolenc BF, Hospital Performance in Brazil, World Bank, Washington DC, 2008.
22 Table 1: Environmental characteristics of township hospitals
2000-2008 2000-2002 2003-2005 2006-2008 2000-2008 (%)
Number of household per square kilometers 129 (0.0053) 126 (0.0044) 127 (0.0047) 133 (0.0060) 6.4 Share of rural (%) 92.79 (0.0472) 3 (1.3239) 93 (0.0502) 92 (0.0487) -2 Rural net income per capita (Yuan) 4.259 (0.0238) 3.387 (0.0170) 4.141 (0.0165) 5.251 (0.0139) 66.48 Village health stations per 1,000 households 24 (0.0526) 2.41 (0.5425) 2.49 (0.5495) 2.28 (0.4844) -14.29 Distance to the county hospital (km) 24.85 (0.4684) 25 (0.4678) 25 (0.4678) 25 (0.4678) 0
NRCMS coverage (%) 44.2 (1.1129) 0 (0.00) 37.37 (1.1250) 95.28 (0.0514) 471a
Source: Authors’ database.
Note: Each cell presents the mean and in brackets the coefficient of variation. Monetary terms are in Yuan and are normalized to 2000 constant prices, given the price index of Shandong province. a indicates that the variation is calculated
between years 2003 and 2008.
Table 2: Summary of medical activities, human and physical resources of township hospitals
Mean of: 2000-2008 All THs
All THs Central THs General THs 2000-2002 2003-2005 2006-2008 Outpatient visits 30,398 (0.81) 44,203 (0.68) 22,115 (0.74) 26,292 (0.82) 26,184 (0.79) 38,719 (0.76)
Inpatients (0.72) 1,249 (0.66) 1,604 (0.69) 1,036 (0.74) 939 (0.70) 967 (0.54) 1,841 Vaccinations 20,832 (1.02) 28,925 1.05) 15,977 (0.67) 15,464 (0.75) 18,894 (0.91) 28,140 (1.04) Curative medical staff 45 (0.81) 70 (0.61) 31 (0.46) 29 (0.76) 31 (0.79) 38 (0.82) Preventive medical staff 6 (0.69) 8 (0.68) 5 (0.63) 6 (0.71) 6 (0.68) 7 (0.67)
Beds 39 (0.50) 49 (0.45) 32 (0.44) 33 (0.37) 35 (0.41) 47 (0.55) Equipment
X-ray 1.35 (0.47) 1.65 (0.50) 1.16 (0.34) 1.24 (0.42) 1.28 (0.46) 1.53 (0.49)
Echograph 1.55 (0.50) 1.91 (0.52) 1.33 (0.37) 1.32 (0.47) 1.44 (0.45) 1.89 (47)
Electrocardiogram 2.05 (0.64) 2.64 (0.61) 1.69 (0.55) 1.72 (0.47) 1.85 (0.49) 2.57 (0.70)
Source: Authors’ database.
Note: Each cell presents the mean and in brackets the coefficient of variation.
Table 3: Summary of the curative technical efficiency scores
2000-2002 2003-2005 2006-2008 2000-2008 All THs 68.82 (72.35) 23.91 (34.74) 66.76 (63.65) 27.57 (41.30) 50.50 (41.80) 27.33 (54.13) 62.02 (59.60) 27.46 (44.27) Inefficient THs 64.35 (68.80) 22.21 (34.51) 60.02 (55.25) 21.19 (42.25) 43.24 (39.00) 21.19 (48.79) 55.90 (51.65) 24.59 (43.99) P er C o u n ty Anqui 71.57 (80.90) 21.16 (37.95) 71.99 (88.40) 32.04 (45.71) 66.96 (71.40) 32.04 (47.84) 70.17 (43.31) 30.39 (82.10) Changyi 69.78 (71.30) 32.84 (47.05) 66.32 (72.40) 19.92 (50.43) 30.92 (30.40) 19.92 (64.43) 55.67 (48.05) 33.00 (59.28) Gaomi 55.39 (53.35) 28.04 (50.62) 57.34 (52.15) 19.51 (47.01) 38.54 (31.80) 19.51 (50.61) 50.42 (44.25) 25.77 (51.22) Qinzhou 67.85 (67.85) 17.98 (24.50) 57.20 (45.60) 18.47 (37.73) 36.37 (31.10) 18.47 (50.78) 58.81 (45.50) 23.17 (43.05) Shouguang 73.07 (69.90) 18.51 (25.34) 81.93 (86.00) 14.43 (20.62) 55.76 (55.40) 14.43 (25.88) 70.25 (69.90) 19.49 (27.75) Zhoucheng 81.68 (80.75) 3.32 (4.07) 74.35 (75.10) 23.87 (32.06) 70.85 (72.30) 23.87 (33.68) 75.63 (80.75) 18.96 (25.07)
Source: Authors’ database.
23 Table 4: Summary of the curative technical efficiency scores according to size and type of
THs and NRCMS implementation in the township
Observations Mean (Coefficient of variation) Krukal-Wallis test (p_value)
Technical efficiency and size of THs
Small 121 62.07 (0.46)
0.8560
Medium 66 62.97 (0.41)
Large 29 59.71 (0.44)
Technical efficiency and type of THs
Central 81 63.83 (0.46) 0.4615
General 135 60.95 (0.41)
Technical efficiency and NRCMS
No NRCMS 105 68.56 (0.39) 0.0009
NRCMS 111 55.12 (0.49)
Source: Authors’ database.
Note: the size of the HC is defined by the volume of medical staff. Fewer than 31 beds, HCs are considered as small. They are classified as medium from 31 to 59 beds and as large when the volume of beds is equal or higher than 60.
Table 5: Summary of the preventive technical efficiency scores
2000-2002 2003-2005 2006-2008 2000-2008 All THs 59.59 (50.25) 29.62 (49.70) 43.36 (33.30) 26.84 (61.90) 35.32 (25.20) 25.11 (71.09) 46.09 (35.90) 28.95 (62.81) Inefficient THs 45.10 (39.40) 19.67 (43.62) 38.21 (32.40) 21.53 (56.36) 29.44 (24.30) 16.36 (55.55) 37.05 (32.50) 20.19 (54.48) Anqui 67.69 (57.50) 29.77 (43.99) 45.48 (43.20) 24.44 (53.76) 33.33 (34.20) 11.34 (34.00) 48.83 (43.80) 26.94 (55.17) Changyi 65.08 (66.65) 38.29 (58.83) 35.00 (35.00) 16.43 (46.95) 60.00 (60.00) 43.82 (73.03) 53.36 (41.65) 35.47 (66.48) Gaomi 83.90 (100) 29.14 (34.73) 61.64 (56.60) 28.58 (43.37) 47.33 (39.35) 26.82 (56.67) 64.29 (64.75) 31.35 (48.76) Qinzhou 33.87 (29.75) 11.89 (35.11) 22.53 (20.85) 8.40 (37.28) 16.92 (16.85) 5.88 (34.80) 24.44 (23.15) 11.39 (46.61) Shouguang 59.47 (61.80) 20.15 (33 .88) 65.96 (69.50) 32.35 (49.06) 49.63 (45.30) 35.34 (71.21) 58.25 (56.90) 29.63 (50.78) Zhoucheng 54.45 (55.00) 17.38 (31.92) 36.28 (28.30) 20.27 (55.85) 27.32 (24.10) 7.93 (29.05) 39.35 (33.95) 19.05 (48.42)
Source: Authors’ database.
24 Table 6: Summary of the preventive technical efficiency scores according to size and type of
THs and NRCMS implementation in the township
Observations Mean (Coefficient of variation) Krukal-Wallis test (p_value)
Technical efficiency and size of THs
Small THs 121 46.98 (0.60)
0.5007
Medium THs 66 45.72 (0.65)
Large THs 29 43.21 (0.73)
Technical efficiency and type of THs
Central THs 81 46.10 (0.63) 0.9736
General THs 135 46.08 (0.63)
Technical efficiency and NRCMS
No NRCMS in the township 105 55.18 (0.52) 0.0001 NRCMS in the township 111 36.48 (0.71)
Source: Authors’ database.
Note: the size of the HC is defined by the volume of medical staff. Fewer than 31 beds, HCs are considered as small. They are classified as medium from 31 to 59 beds and as large when the volume of beds is equal or higher than 60.
Table 7: Estimation of the determinants of the technical efficiency of THs
Curative model Preventive model
Ln(1/TE) Ln(1/TE) Density 0.000466 2.16e-05 (0.000469) (0.000446) Number village health stations per 10000 households 0.0920** -0.0356
(0.0431) (0.0399) Distance to the nearest county hospital -0.000521 -0.00461 (0.00969) (0.00716) Rural net income per capita 1.300*** 1.811*** (0.485) (0.515) NRCMS cover rate 0.00192** 0.00243**
(0.000935) (0.00101) Hospital level -0.150 -0.211
(0.233) (0.175) Share of qualified staff in total staff 1.485 -
(1.479) - Number of households per preventive staff - -0.000185***
- (2.47e-05) Share of subsidies in total expenditures (without staff expenses) 0.688* 0.370
(0.354) (0.405) Preventive technical efficiency 0.234* -
(0.129) - Curative technical efficiency - -0.112
- (0.149) Constant -0.616 0.914** (0.457) (0.411) Sigma_u 0.492*** 0.352*** (0.0818) (0.0610) Sigma_e 0.305*** 0.328*** (0.0175) (0.0191) Rho 0.7226 0.5349 Observations 214 214 Number of THs 24 24
Source: Authors’ database.
Note: due to the construction of the right hand variable, a positive sign denotes a positive influence on technical inefficiency, i.e. a negative influence of the variable on technical efficiency. In contrast, a negative sign means a positive effect on technical efficiency. *, **, *** respectively indicate significance at 10%, 5% and 1%.
25 Graph 1: Distribution of the curative technical efficiency scores per period
Source: Authors’ database.
Graph 2: Distribution of the preventive technical efficiency scores
Source: Authors’ database.
0% 20% 40% 60% 80% 100% 2000-2002 2003-2005 2006-2008 P er ce n ta g e o f T H s ]90;100] ]70;90] ]50;70] ]30;50] [0;30] 0% 20% 40% 60% 80% 100% 2000-2002 2003-2005 2006-2008 P er ce n ta g e o f T H s ]90;100] ]70;90] ]50;70] ]30;50] [0;30]