HAL Id: hal-00354947
https://hal.archives-ouvertes.fr/hal-00354947
Submitted on 21 Jan 2009
HAL is a multi-disciplinary open access
archive for the deposit and dissemination of
sci-entific research documents, whether they are
pub-lished or not. The documents may come from
teaching and research institutions in France or
abroad, or from public or private research centers.
L’archive ouverte pluridisciplinaire HAL, est
destinée au dépôt et à la diffusion de documents
scientifiques de niveau recherche, publiés ou non,
émanant des établissements d’enseignement et de
recherche français ou étrangers, des laboratoires
publics ou privés.
Perceptual Effects of Packet Loss on H.264/AVC
Encoded Videos
Fadi Boulos, Benoît Parrein, Patrick Le Callet, David Hands
To cite this version:
Fadi Boulos, Benoît Parrein, Patrick Le Callet, David Hands. Perceptual Effects of Packet Loss on
H.264/AVC Encoded Videos. Fourth International Workshop on Video Processing and Quality Metrics
for Consumer Electronics VPQM-09, Jan 2009, Scottsdale, Arizona, United States. �hal-00354947�
PERCEPTUAL EFFECTS OF PACKET LOSS ON H.264/AVC ENCODED VIDEOS
Fadi Boulos
∗, Benoît Parrein, Patrick Le Callet
Nantes Atlantique Universités
IRCCyN, Polytech’Nantes
Rue Christian Pauc, 44306 Nantes, France
[email protected]
David S. Hands
BT Innovate
Martlesham Heath, Ipswich, UK
[email protected]
ABSTRACT
Video communication over IP (Internet Protocol) networks has grown significantly in recent years. However, the Qual-ity of Experience (QoE) associated with video over IP can vary dramatically. This is mainly due to bandwidth restric-tions and the fluctuating Quality of Service (QoS). Inves-tigating the perceptual effects of packet loss could lead to a better understanding of the QoE experienced by the end-user. In this paper, we present the results obtained from a se-ries of subjective video quality tests that evaluated the qual-ity of H.264/AVC videos distorted by several packet loss patterns. We draw some interesting conclusions concerning the impact on perceptual quality of (1) transmission-related factors such as the loss distribution and the lost pictures per-centage; and (2) content-related factors such as the scene cut position in the video sequence and the spatial position of the loss in the picture.
1. INTRODUCTION
Video transmission over IP (Internet Protocol) networks has grown significantly in recent years due to the proliferation of IPTV channels and, Video On Demand (VOD) and video-conferencing services. However, the Quality of Experience (QoE) associated with video over IP can vary dramatically. This is mainly due to bandwidth restrictions (particularly due to throughput limitations in the access network) and the fluctuating Quality of Service (QoS). Three parameters can define the level of QoS in a network, namely packet loss rate, packet delay and packet delay variation (commonly known as jitter). In this work, we assume that all of these network parameters can be represented by packet loss. This assumption holds in the case where the delay threshold is set to a low value, thus forcing the discard of all packets arriving later than this threshold.
QoE is an important factor from an Internet Service Provider (ISP) perspective because it is an indication of the user satisfaction. Investigating the perceptual effects of
∗The author performed the work while on an internship at BT.
packet loss could lead to a better understanding of the QoE perceived by the end-user. However, measuring the QoE of a video service is a complex task. Currently, the most re-liable way of assessing QoE is to perform subjective video quality evaluation tests. These tests consist of a group of observers assessing the quality of video sequences gener-ally distorted by coding, transmission errors or processing schemes.
In this paper, we go through a review of prior work done in the area of subjective assessment of videos affected by transmission-related distortions. Then, we explain our packet loss simulation methodology and the selection of the packet loss patterns to be used. We also describe the setup of subjective video quality tests and finally we present the results obtained from the series of tests which evaluated the quality of distorted H.264/AVC videos.
2. RELATED WORK
Although the area of measuring subjective quality for video sequences distorted by packet losses is still not investigated enough, some works have accelerated the pace of research in this field. Kanumuri et al. examined the visibility of packet loss impairments in [1, 2]. In the scope of monitor-ing video quality on a network through an objective linear model, subjective tests were performed to better understand the impact of packet loss on perceptual quality. In these tests, viewers were asked to react whenever they saw an im-pairment in MPEG-2 compressed video sequences [1]. Fac-tors such as the amount of motion present in lost slices, the number of lost slices and the lost frame types were shown to influence the visibility of impairments. Similar results were obtained in [2] for H.264/AVC videos but with one differ-ence: motion amount was not found to be such an impor-tant factor when motion-compensated error concealment is used. In [3], Reibman and Poole studied the effects of scene characteristics on the visibility of packet loss impairments. They concluded that visibility of errors increases if the loss occurs at a scene change and decreases if it occurs shortly
before or after a scene change. They also found that cam-era motion (e.g., zooming or panning) increased impairment visibility.
In [4], the impact of network and coding parameters on quality was investigated. The network parameters were: “loss rate” and “consecutive lost packets” (burstiness). Re-sults showed that the latter greatly influences the overall quality. Moreover, for poor quality conditions (low bitrate or high packet loss rate), increasing the loss burst length while keeping all other parameters constant yields better quality.
Several studies have focused on the relationship between loss burst length and video quality. In [5], Liang et al. demonstrate that the distortion resulting from a packet loss largely depends on the loss pattern. More precisely, a loss model was proposed showing that a burst loss produces more distortion than an equal number of isolated losses, for a small number of losses. Note that the distortion measure used in this work was the Mean Square Error (MSE), i.e., no subjective tests are done. In [6], subjective tests including Standard Definition (SD) IPTV sequences showed that for losses lasting less than 200ms, the overall user experience was much more affected by the number of loss occurrences than by the burst length. This means that for the same num-ber of lost packets, video quality is better in the case of a single loss event (which affects many consecutive packets) than in the case of multiple loss events (affecting only one packet each).
An extensive study of the perceptual impacts of frame dropping was performed by Pastrana-Vidal et al. in [7, 8, 9]. These studies dealt with a specific consequence of packet loss, namely the discard of one or more pictures. In [7], subjective tests were performed to determine the detection threshold of temporal discontinuities that result from frame dropping. Also, the influence of burst duration, its tem-poral position and its distribution on quality were studied. This work was further developed in [9] where an objec-tive quality assessment model is proposed and it is shown that regular frame dropping is less annoying than irregular frame dropping. In [8], the masking effect of scene changes is quantified: temporal discontinuities are more likely to be masked if they occur up to 200ms before a scene cut. Pastrana-Vidal et al. stress the content-dependency of qual-ity ratings although Mean Opinion Score (MOS) variation across contents does not generally exceed 10%.
Towards developing a full understanding of the percep-tual effects of packet losses on H.264/AVC encoded videos, the aforementioned research provides informative yet in-complete results. The work reported in [1, 2, 3] examines the visibility of packet loss impairments but not their per-ceptual effect on quality. On the other hand, the work in [4] involves H.263 encoded videos at low-bitrates while we are interested in H.264/AVC encoded videos at higher bitrates.
The contradicting results of [5] and [6] also motivated us to investigate more closely the effect of burst length on percep-tual quality. Finally, the work of Pastrana-Vidal has targeted frame dropping, a typical behavior in the context of low-bitrate low-resolution video transmissions where full frame information is contained in very few packets. In the present paper we are concerned with different loss patterns, because while losing more than one entire picture of an SD video sequence can occur, it generally involves the loss of a great number of consecutive packets. For the bitrates used in the present study, the loss of all packets associated with more than one frame was considered to be sufficiently rare for this condition to be excluded from the experiment.
The work presented here targets a better understanding of the user’s perception of spatio-temporal distortions. The current paper addresses the following questions:
1. How does the loss pattern contribute to the overall quality degradation?
2. To what extent does the video sequence content influ-ence the quality score?
3. PACKET LOSS SIMULATION
In the H.264/AVC standard [10], each slice of coded data is encapsulated in one Network Abstraction Layer Unit (NALU). We choose to perform the packet loss simulation at the NAL level of the bitstream because we can have full control over the spatial and temporal positions of the losses. The temporal position of the loss is determined by the frame number and the spatial position by the slice’s position in the NALU sequence of the bitstream. Note that the latter is coarsely identified because a slice can contain one or more rows of macroblocks.
For practical purposes, we set the maximum slice size to
1450 bytes which is less than the Maximum Transmission
Unit (MTU) for Ethernet (1500 bytes). The unused bytes (i.e., 50) are left for the RTP/UDP/IP headers (40 bytes) and the possible additional bytes that could be used beyond the predefined threshold. In this case, every NALU can fit in exactly one IP packet. This makes our simulation more real-istic because we can map the Packet Loss Rate (PLR) at the NAL level to the PLR at the application layer (e.g., RTP). In the rest of this paper, we will use the terms “packet” and “NALU” interchangeably.
The loss simulator used to generate the transmission-distorted sequences is based on [11]. We choose several loss patterns where burst length and the number of loss events (and hence the PLR) are varied. By performing some pre-liminary tests, we verified that the test set covered the whole range of subjective quality. A summary of the loss patterns used in the first subjective test is presented in Table 1. Note that the majority of the losses are introduced in I-pictures.
Table 1. The loss patterns used in the first subjective test.
Bitrate (Mbps) 1.5 4
Frequency of losses (per sequence) 1 4 8 1 4
Burst size (packets) 4 10 20 40 4 10 20 20 4 10 20 4 10 20 Packet loss percentage 0,2 0,5 1,1 2,2 0,9 2,2 4,5 8,9 0,1 0,2 0,4 0,4 0,9 1,8
In Table 1, the frequency of losses is the total number of loss occurrences of all burst lengths. The burst size is the number of consecutive packets lost and the packet loss percentage is the ratio of the number of packets lost to the total number of packets in the bitstream. For instance, for a video sequence coded at 1.5 Mbps, four 20-packet long losses yield a PLR of 1.1%. We chose to preserve the tem-poral positions of the losses across all sequences to avoid a bias in the viewers’ judgement due to their variation. That is, single losses always occur at the sixth second of the se-quence while multiple occurrences losses (4 and 8) are in-troduced between the fourth and the eighth second. The time interval separating the four and eight losses is one and half-second, respectively. The bitrates were chosen to be representative of typical residential broadband speeds.
The test files used in this experiment were encoded and decoded using the BT implementation of the H.264/AVC video codec. The error concealment algorithm implemented in the decoder was called every time a part of the bitstream was lost (due to packet loss). This algorithm searches for the best temporal neighbor macroblock to replace the lost macroblock when only part of the picture is lost. If a whole reference picture is lost, it is replaced by the previous refer-ence picture.
4. SUBJECTIVE TESTS
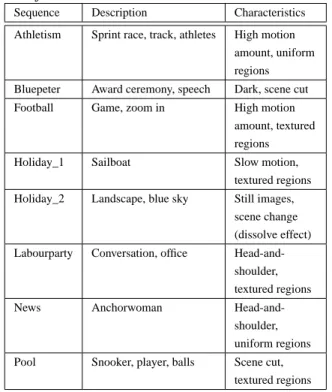
Two subjective tests were performed according to Interna-tional Telecommunication Union (ITU) Recommendation BT.500-11 [12]. The video sequences used in the tests in-cluded a wide range of contents with different levels of mo-tion and texture. In the first test, eight ten-second copy-righted sequences from the BT video database were used. Table 2 gives an overview of their contents and their char-acteristics.
In the second test, seven VQEG sequences from VQEG FR-TV phase 1 [13] were used. The single-stimulus presen-tation method with the five-level Absolute Category Rating (ACR) scale was used to collect subjective quality ratings for both tests.
4.1. Setup
The video sequences were coded in High Profile with an IBBPBBP... GOP structure of length 24. They were all in
Table 2. The characteristics of the sequences used in the
first subjective test.
Sequence Description Characteristics Athletism Sprint race, track, athletes High motion
amount, uniform regions Bluepeter Award ceremony, speech Dark, scene cut Football Game, zoom in High motion
amount, textured regions Holiday_1 Sailboat Slow motion,
textured regions Holiday_2 Landscape, blue sky Still images,
scene change (dissolve effect) Labourparty Conversation, office
Head-and-shoulder, textured regions News Anchorwoman
Head-and-shoulder, uniform regions Pool Snooker, player, balls Scene cut,
textured regions
Standard Definition (720 × 576) and displayed on a CRT monitor at a frame rate of 25 fps. Four practice sequences covering the whole subjective quality scale were used at the beginning of the test to accustom the viewers with the qual-ity assessment procedure. Viewers were asked to rate the video sequences using a wireless keypad.
4.1.1. First test
The 14 loss patterns in Table 1 were applied to the eight video sequences yielding a total of 112 distorted sequences. We integrated the sequences coded at the two bitrates in the set thus reaching a number of 128 sequences. 16 non-expert subjects participated in the test with an average completion time of 35 minutes.
4.1.2. Second test
In the second subjective test, we wanted to evaluate the im-pact of losing a specific percentage of an I-picture, namely
sub-jects participated in this test that included 42 eight-second sequences coded at 2 Mbps.
4.2. Results and discussion
The results obtained from the two subjective tests can be classified into two categories: content-related and network-related results. In the first category, we show that scene changes in a video sequence can be a “double-edged sword” w.r.t. its robustness to packet loss and that the spatial posi-tion of the loss impacts the viewers’ ratings. On the other hand, we find that loss distribution is an important parame-ter that have to be considered because of its link to temporal error propagation. Also, we quantify the quality decrease when a whole I-picture is lost.
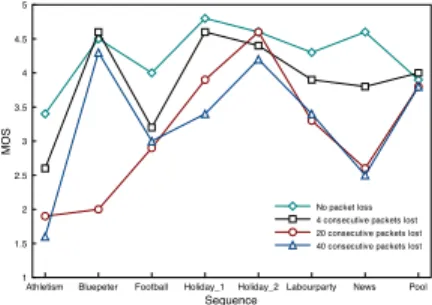
4.2.1. Scene change
We are interested in the MOS values of the sequences in Figure 1 that contain scene changes, namely Bluepeter,
Hol-iday_2 and Pool. For all other sequences, we notice that
quality decreases with the increasing number of lost pack-ets. However, this is not the case for these three sequences.
Generally, the first picture of a new scene is coded as an I-picture even if it is not the first picture of the GOP. We can infer from the Holiday_2 and Pool curves that the MOS variation across loss patterns is minimal, although the PLR increases from 0.22% to 2.2%. This is due to the fact that the temporal error propagation caused by the inter-prediction process is halted when a new I-picture is encoun-tered. In these two cases, the losses occurred in the I-picture just before the scene change and thus the distortion could not propagate to the new scene.
In the Bluepeter sequence, we observe the same trend for all loss patterns except for the 20-packet long loss which yields a sharp decrease in quality. In the latter case, the loss occurred in the first picture of the new scene (i.e., the I-picture) which makes the decoder unable to perform a proper error concealment because of the loss of the only useful reference picture. The plot in Figure 1 also shows that the versions of the three sequences aforementioned af-fected by losses just before the scene change, have a quality drop of less than 0.5 MOS compared to the zero-loss case.
4.2.2. Spatial position
We report the importance of the spatial position of the loss in the picture. Changing this position is done at the H.264/AVC bitstream level by targeting a NALU from the same picture but in a different location in the bitstream. This is illustrated in Figure 2 where the lower part of the I-picture is lost in (a) and its upper part in (b).
Athletism Bluepeter Football Holiday_1 Holiday_2 Labourparty News Pool Sequence 1 1.5 2 2.5 3 3.5 4 4.5 5 MO S No packet loss 4 consecutive packets lost 20 consecutive packets lost 40 consecutive packets lost
Fig. 1. Scene change effect. For each sequence, the version
without packet loss and three other versions corresponding to three different loss patterns are plotted.
! ! ! ! ! ! ! ! ! " " " " # #
$$$
! ! ! ! ! ! ! ! ! " " " " # #
$$$
%&'()*+,+-.+/ %&'()0123 456
476
Fig. 2. Changing the spatial position of the loss at the
bit-stream level. Assuming that slices contain the same number of macroblocks in raster scan order, the lower and upper parts of the I-picture are lost in (a) and (b), respectively.
Generally, for the same loss pattern (e.g., single loss event, regular loss events), the quality decreases when the overall number of packets increases. However, in Figure 3, we see that the trend is somewhat unusual. In Figure 3(a), when the burst size is increased from 10 to 20 (and hence the PLR from 2.2% to 4.4%), the MOS surprisingly increases by almost 1 unit value on a scale of 5. This can be due to the absence of loss distortions from the Region of Interest (RoI) of the picture; the distortions occurred only in the “stadium” region of the picture and did not hit the “ath-letes” region which was the case for the loss patterns “Four regular four events” and “Four regular ten events”.
In Figure 3(b), we notice that the quality of the sequence increases although we double the PLR (from 0.22% to
0.44%). In this case too, the highly-textured background
of the picture is hit by the loss distortion while the people’s faces are spared, the exact opposite of what happened for the other two loss patterns.
4.2.3. Loss distribution
We compare two different loss patterns that have the same overall PLR. We choose the following loss patterns: the sin-gle loss of 40 consecutive packets starting in an I-picture and the four regular losses of 10 packets each occurring in I-pictures too. They both yield a PLR of 2.2%. The results are presented in Figure 4.
Four regular four events Four regular ten events Four regular twenty events Loss pattern 0 0.5 1 1.5 2 2.5 3 3.5 4 4.5 5 MO S Without loss - 1.5 Mbs With loss - 1.5 Mbs (a) Athletism.
One time four events One time ten events One time twenty events Loss pattern 0 0.5 1 1.5 2 2.5 3 3.5 4 4.5 5 MO S Without loss - 4 Mbs With loss - 4 Mbs (b) Labourparty.
Fig. 3. The effect of the loss’ spatial position on quality
shown for two different sequences, bitrates and loss pat-terns.
Our finding is consistent with the results obtained in [6], namely that the quality of a video sequence is generally bet-ter in the case of a single loss than in the case of multiple losses. This is due to the duration of the error propagation: in the former case, the loss occurred in the I-picture and the next B and P-pictures but remained within the same GOP. In the latter case, the losses propagated to several pictures at each occurrence because they always hit an I-picture; and the losses being consecutive, the temporal propagation lasted for up to four GOPs, i.e., roughly four seconds. Note that the quality of the Athletism sequence which contains a high amount of motion is not satisfying for both patterns because the error concealment algorithm cannot yield good results at this PLR.
4.2.4. Picture loss percentage
We assess the quality of video sequences subjected to the loss of the one fifth, half and entire 5th I-picture of the se-quence. Percentages are computed as the ratio of the num-ber of NALUs lost to the total numnum-ber of NALUs in the I-picture. Lost NALUs were always consecutive and prelim-inary tests have shown that for such high loss percentages, the spatial position of the loss does not have a significant impact on quality. Figure 5 shows that the quality of the
20% case remains visually acceptable (M OS ≃ 3) for all
sequences except for Rugby, whatever the original quality
Athletism Bluepeter Football Holiday_1Holiday_2 Labourparty News Pool Sequence 1 1.5 2 2.5 3 3.5 4 4.5 5 MO S No packet loss 1x40 4x10
Fig. 4. Loss distribution effect. The two loss patterns
com-pared yield a PLR of 2.2%.
Barcelona Harp Canoe Formula One Fries Rugby Calendar Sequence 0 0.5 1 1.5 2 2.5 3 3.5 4 4.5 5 MO S No loss 20% of an I-picture lost 50% of an I-picture lost One entire I-picture lost
Fig. 5. Picture loss percentage. Percentages are computed
w.r.t. the number of NALUs.
was. Note that the high motion sequence Rugby is not of good quality when encoded at 2 Mbps.
For the 50% case, the quality slightly decreases from the
20% case going below the fair quality threshold for two
se-quences only. The PLRs are in the range 0.2 − 0.6% in the latter case and 0.6 − 1.6% in the former. Note that the num-ber of NALUs per picture is not the same for all sequences. Hence, losing the same percentage of the total number of NALUs in a picture gives different PLR values across the sequences.
The curve corresponding to the whole picture lost case is insightful: it shows the content-dependency of such a loss’ effect on quality. This is detailed in Table 3 where it is clear that the highest PLRs do not necessarily yield the worst visual qualities, ∆M OS100 being the quality difference be-tween the no-loss and the 100% cases. The high ∆M OS100 values for sequences with a high amount of motion (Canoe and Calendar) suggest a possible relation between the tem-poral complexity of the video sequence and the perceptual impact of packet loss. A contrasting relation including the spatial complexity of the sequence is suggested by the se-quence Barcelona which exhibits a low ∆M OS100due to its highly-textured content.
The results obtained in this test corroborate our earlier finding, namely that the loss distortion is attenuated if the loss occurs just before the scene change. The I-picture lost in the Fries sequence is located just before a scene change
Table 3. PLR and quality decrease for one I-picture lost.
Sequence Barcelona Harp Canoe Formula 1 Fries Rugby Calendar
P LR100 3.14 1.9 1.24 1.64 1.65 0.92 3.22
∆M OS100 1.0 1.7 1.9 1.4 0.9 1.3 1.9
which is what explains its low MOS decrease value.
5. CONCLUSION AND FUTURE WORK
We presented in this paper our work aiming at a better understanding of QoE in a video service. We described the subjective video quality assessment procedure and our packet loss methodology performing at the NAL level of the bitstream. We established a link between network parame-ters such as the loss distribution and the picture loss per-centage and the perceptual impact on quality. We showed that for the same loss percentage, multiple bursty losses are more damaging than a single contiguous long loss. We also showed that some sequences maintain a fair quality even when they lose up to the half of an I-picture.
On the other hand, we looked at content-dependent pa-rameters such as scene changes in the video sequence and semantic effects of the loss distortion. We confirmed that scene changes have a “double-edged” effect in the presence of packet loss and that the perceptual quality is very content-dependent.
This work can be used within two frameworks: an ob-jective video quality metric that deals with transmission-related distortions and a channel protection framework. For instance, the quality metric could be hybrid, looking at both the bitstream and the decoded video to know exactly which packets were lost and evaluate their impact. The channel protection could be allocated unequally, depending on the importance of each part of the bitstream. Both frameworks would be perception-oriented.
6. REFERENCES
[1] S. Kanumuri, P.C. Cosman, and A.R. Reibman. “A Generalized Linear Model for MPEG-2 Packet-Loss Visibility”. In 14th International Packet Video
Work-shop, Irvine, December 2004.
[2] S. Kanumuri, S.G. Subramanian, P.C. Cosman, and
A.R. Reibman. “Predicting H.264 Packet Loss
Visibility using a Generalized Linear Model”. In
Pro-ceedings of IEEE International Conference on Image Processing, ICIP, pages 2245–2248, October 2006.
[3] A.R. Reibman and D. Poole. “Predicting Packet-Loss Visibility Using Scene Characteristics”. In 16th
Inter-national Packet Video Workshop, Lausanne,
Novem-ber 2007.
[4] S. Mohamed and G. Rubino. “A Study of
Real-Time Packet Video Quality Using Random Neural Networks”. IEEE Transactions on Circuits and
Sys-tems for Video Technology, 12(12):1071–1083,
De-cember 2002.
[5] Y. Liang, J. G. Apostolopoulos, and B. Girod. “Analysis of Packet Loss for Compressed Video: Does Burst-Length Matter?”. In Proceedings of IEEE
International Conference on Acoustics, Speech and Signal Processing, ICASSP, April 2003.
[6] Architecture & Transport Working Group.
“Triple-play Services Quality of Experience (QoE)
Requirements”. Technical Report TR-126, DSL
Forum, December 2006.
[7] R. R. Pastrana-Vidal, J. C. Gicquel, C. Colomes, and H. Cherifi. “Sporadic Frame Dropping Impact on Quality Perception”. In Human Vision and Electronic
Imaging IX, SPIE, volume 5292, pages 182–193,
Jan-uary 2004.
[8] R. R. Pastrana-Vidal, J. C. Gicquel, C. Colomes, and H. Cherifi. “Temporal Masking Effect on Dropped
Frames at Video Scene Cuts”. In Human Vision
and Electronic Imaging IX, SPIE, volume 5292, pages
194–201, January 2004.
[9] R. R. Pastrana-Vidal, J. C. Gicquel, C. Colomes, and H. Cherifi. “Sporadic Frame Dropping Impact on Quality Perception”. In 5th International Workshop
on Image Analysis for Multimedia Interactice Ser-vices, Lisboa, April 2004.
[10] Joint Video Team (JVT) of ISO/IEC MPEG and ITU-T VCEG. “Draft ITU-T Recommendation and Final Draft International Standard of Joint Video Specification (ITU-T Rec. H.264 | ISO/IEC 14496-10 AVC)”. JVT-G050r1, May 2003.
[11] Joint Video Team (JVT) of ISO/IEC MPEG and ITU-T VCEG. “SVC/AVC Loss Simulator”. JVITU-T-Q069,
October 2005. Available athttp://wftp3.itu.
int/av-arch/jvt-site/2005_10_Nice/.
[12] International Telecommunication
Union-Radiocommunication Sector. “Methodology for the Subjective Assessment of the Quality of Television Pictures”. ITU-R BT.500-11, June 2002.
[13] Video Quality Experts Group. “Final Report from the Video Quality Experts Group on the Validation of Objective Models of Video Quality Assessment”. COM 9-80-E, June 2000.