Publisher’s version / Version de l'éditeur:
Vous avez des questions? Nous pouvons vous aider. Pour communiquer directement avec un auteur, consultez la
première page de la revue dans laquelle son article a été publié afin de trouver ses coordonnées. Si vous n’arrivez pas à les repérer, communiquez avec nous à [email protected].
Questions? Contact the NRC Publications Archive team at
[email protected]. If you wish to email the authors directly, please see the first page of the publication for their contact information.
https://publications-cnrc.canada.ca/fra/droits
L’accès à ce site Web et l’utilisation de son contenu sont assujettis aux conditions présentées dans le site
LISEZ CES CONDITIONS ATTENTIVEMENT AVANT D’UTILISER CE SITE WEB.
Technical Translation (National Research Council of Canada), 1965
READ THESE TERMS AND CONDITIONS CAREFULLY BEFORE USING THIS WEBSITE. https://nrc-publications.canada.ca/eng/copyright
NRC Publications Archive Record / Notice des Archives des publications du CNRC :
https://nrc-publications.canada.ca/eng/view/object/?id=e250c34b-783f-452d-9cb5-c494d7aeb861 https://publications-cnrc.canada.ca/fra/voir/objet/?id=e250c34b-783f-452d-9cb5-c494d7aeb861
Archives des publications du CNRC
For the publisher’s version, please access the DOI link below./ Pour consulter la version de l’éditeur, utilisez le lien DOI ci-dessous.
https://doi.org/10.4224/20386768
Access and use of this website and the material on it are subject to the Terms and Conditions set forth at
Temperature, thickness and discontinuity of permafrost
Kudryavtsev, V. A.; National Research Council of Canada. Division of
Building Research
This translation is the ninth arranged by the Permafrost
Subcommittee of the Associate Committee on Soil and sョッ|セ Mechanics
of the National Research Council of Part I of the Russian perma-frost publication, "Principles of Geocryology".
The first translation in this group was of Chapter VI entitled "Heat and Moisture Transfer in Freezing and tィ。|Gャゥョセ Soils" by G.A.
Martynov (TT-1065). The second was of Chapter IV General Mechanisms
of the Formation and Development of Permafrost" by P.F. Shvetsov (TT-1117). The third was Chapter VII "Geographical Distribution of Seasonally Frozen Ground and Permafrost" by LYa. Baranov (TT-112l). The fourth \1aS "Ground (Subsurface) Ice" by P.A. Shumskii (TT-1130). The fifth was "Ground Water in Permafrost" by V.l>1. Ponomarev and
N. L Tolstikhin (TT-1138). The sixth was "Cryogenic Physico-Geological Phenomena in Permafrost Regions" by S.P. Kachurin (TT-1157). The
seventh was "Perennially Frozen Ground and Vegetation" by A.P. Tyrtikov (TT-1163) and the eight "On Physical Phenomena and Processes in
Freezing, Frozen and Tha\oJing Soils" by N.A. Tsytovich et aL, (TT-1164). The remaining four chapters I, II, III and XIII will not be translated. The first three chapters describe the history of permafrost investiga-tions in the U.S.S.R. and the last chapter presents a summary of the
preceding chapters. It is hoped that selected chapters of Part II
(Engineering) will be translated in future.
This translation of Chapter VIII by V.A. Kudryavtsev describes the temperature regime at the ground surface and the seasonal freeZing
and thawing of the upper layer of the earth's crust. This is followed
by a discussion of ground temperatures at the bottom of the layer with
seasonal temperature variations. The influence of soil and rock type,
bodies of water, and ground water on the エィゥ」セ・ウウ of permafrost are
r-evaewed, The chapter conclude s |セゥ th an account of the influence of
olimatio and terrain features on the boundary oonditions at the
perma-fr9st table and lower surfaoe.
This translation has been prepared by G. Belkov of the N.R.C. Translations Section and checked by R.J.E. Brown of the Northern Group of the DiVision of Building Research.
Ottawa April 1965
R.F. Legget Director
Technical Translation 1187
Title: Temperature, thickness and discontinuity of permafrost
(Temperatura, moshchnost ' i preryvistost ' tolshch merzlykh porod)
Author: V.A. Kudryavtsev
Reference: Principles of geocryo1ogy (permafrost studies), Part I, General
geocryology, Chapter VIII. Academy of Sciences of the U.S.S.R.
Moscow 1959. p.219-273
(Osnovy geokrio1ogii (merzlotovedeniya), Chasti pervaya, Obshchaya
ァ・ッォイゥッャッセゥケ。L Glava VIII. Akademiya Nauk SSSR. Moskva 1959.
s.219-273)
Introduction
The formation and development of permafrost from the thermo-physical point of view are determined by the following factors:
(1) boundary conditions on the upper and lower surfaces of the permafrost; (2) the composition of the permafrost and the processes taking place in
it.
These conditions are connected with the physico-geographical and geological environment in Which the permafrost originated and eXists.
The boundary conditions at the permafrost table are the result of the
interaction of a number of complex processes. In the first place, at the
sur-face of the earth, radiant solar energy is transformed into heat energy and
heat exchange develops between the lithosphere and the atmosphere. As a
result a specific temperature regime is established in the atmosphere and in
the upper soil horizons. The latter is of particular importance for
geocryo-logists since it reflects the boundary conditions at the permafrost table. The boundary conditions beneath the permafrost will be considered in the sec-tion dealing with the thickness of the permafrost.
Initially we will deal with the thermo-physical aspect of the freeZing of the upper horizons of soil and will subsequently show the effect of various conditions on the formation of the temperature regime and the freeZing of the soil.
The problem of the freeZing of a medium, formulated by Lame and Clapeyron in 1831 (the so-called Stefan problem), had not been solved until recently when
in
1947
a solution was suggested by L.I. Rubinshtein although in a very generalform owing to the extreme complexity of the problem. At the present time a
new solution of this problem has been obtained by V.G. Melamed
(1957)
byreducing the Stefan problem to a system of ordinary differential equations. This method makes it possible to obtain a specific solution with any degree of accuracy.
According to V.G. Melamed if a single zone is considered 0 < x < セHエI
where セ
=
セHエI - the ooordinate of the boundary of the interface and the effectof the second zone on their boundary is taken into account temporarily by some
limited function q1
=
q1(t), the statement of the problem has the formOU(x, t)
=
a2OIU(x.t); 0<
x<
e
(J);u (0,t) =II>(t); u (x, 0)
=
'f(x)*; 0<
x<
セ (0); u[l;(t), t] = 0; Aau (x,t)I -
q(t) = 1;'(t),at
.r=ECt) (8.1) (8.2) a]セL アHエI]アャセエI[ 1;(0)=1=0.u(Xlt)
=
V(Xlt) +セHエIセHセセエI
X I then V(Olt) - 01where
Make the substitution: v[l;(tLt] II: O.
In this solution the possibility is shown
Fourier series for the section
(Oll;(t))
with aof expanding v(xl t) into a fixed t.
2 セN セィ
Thl!'n, v (x,t) = - セ Adt)sinセL wilueA",(t) =
S
v (x,t)sinセ dx.セ (t) I-l セ (t) 0 セ (t)
For Ak(t) and
l;(t)
an infinite system of differential equations is( ( ォセク
formulated. Multiplying 8.1) and 8.2) by sin セ and integrating from 0 to
l;(t)1
and also keeping in viewelt) elt)
S
al"(x.t) sin hx dx = _ k're' A (t)·S
au (x.t) sin hx dx = A'(t)+
。セ
e
(t) W)" k .at
セ (t) ko 0
+
eIl'(t)e(t)_・iャHエIイHエIH⦅iIiエMMャMセi[GHエI セa (t)w .Inc Inc I
e
(t) £.J I Ik.I-l
j
(_
I)/+k+1 _1_il-k" i =Fk Wlk -.!..k i=k"
We obtain, a"kln:1 , [ 2 セ ell(t)
It}
ell'(t)A..(t) = ---A",(t) -kl; (t) Mセa、エIキゥォM - ( - I ) - - e ( t )
セ (t)1 セ (t) I=l kin: k'IC
e'
<t)=
2).'1\' セ iAdt )(_1)/ _ )'eIl(t) - (t). セ (t)1 セe
(t) q I=l(8.3)
(8.4)
(8.5)
In the paper of
V.G.
Melamed it is shown that the solution of the system(8.3)1
(8.4)
can be obtained from the solution of a shortened system by passage to the limit when n -+C/):AL")'(t)
=
a'k"rel aセBI (t) _ k;(II) (ty[_2_
セ An(I)w. _ ell(t)(_I)k} _セHョIHャIQ セHョIHエI £.J I ,k kin:
l=l «1>'(t) e(n)(t)
*
It is assumed that cpl(X) and Ilil(t) are continuous, cp"(X) is integratable and cp( 0)=
セ(
0 ) •セHョIG (t) = RスNセ セMGゥaセョIHエIHMャIO - ILセHiI - (I). セHiIi LJ '
e
(n)(I) qi=l
(8.6)
(8.7)
- (8.6)
is considered to be theMoreover the solution of the system
(8.5)
one possible. Considering in only
a completely analogous way the second zone セHエI < x < 1,
n
( ) セ ( ) x - セセエセ 2 \ ' ( ) i7l:(1 - x)
u2 x,t
=
セR t 1 _ セ t + セ セ Bi t sin 1 _ セサエスG we obtain a completei=l
system of differential equations reflecting the dynamics of the temperature field in the case of a two-phase system with a mobile boundary*.
aZk1n:1 [ 2 n セ t B}セG (I)
aセMHエI
= -
_ 1 -Ak(t) - hI' (t) - セ Adt) Wi" - -!...(-I) - - l )(t),"l (1)1 "l (I)i-I kl k
• 。セォャョZQ •
[2
n 4>.(I) ]Bk(t)-=- Bk-kl)(t) MMセbゥHエIuゥォMM
-IL-"l (I)l' L-"l (I)i-I kl
セN (I)
_ _2_l)(t)(_I)k
k
(8.8)
tI tI
Tj·(t) _ _"1_
[_t_
セ iBi(t)+
<lJz(t)]-セ {MエMセゥaゥHエIHMiIO -If>l(t)].L-"l(I) L-"l (I) &1 "l(I) "l(I)i-I
(8.9)
I
_ I l*k. ), jl-kl IX1= _l_;Uik= Q1t11.
i=k 4kThe solution of the system of differential equations obtained can be carried out by the Euler method with automatic selection of steps.
To obtain a solution with accuracy of the order of 0.01 the time step
should be about 10 days (200 - 300 hours). Knowing at the outset the
right-hand part of equation
(8.9),
we find セL for this instant and substituting thevalue obtained for セL in
(8.7)
and(8.8)
we find Ak{O+
セエIL Bk{O + セエINFinally substituting-these values in the expression for u,{x,t) and U2{X,t) we have:
UI(x, ti) = _1_[<1>1(ti)X+ 2±Ak(ti)Sin
セ}キィ・ヲャ
0<x<セHエゥIL
e(Ii) "=1 "l (Ii)Uz(x,ti) = 1
サエヲャRHエOI{xMセHエゥI}K
2±Bk(ti)Sin k(/-X)}iMセHエOI k=l L-"l(l/)
when セHエOI\ク\ャ
and we obtain the temperature of the soil at any depth at the time t
=
0 + セエN* An increase in the number of phases results only in an increase in the number of equations.
It is simpler to find Ak(tn+l) and Bk(tn+l) using the formulae:
Ak(tn+!)= Ak(In)e-"'k(lnlh
+
Tk (in)-h;Bk(in+!)= Bk(in) e-Gk(/n)h
+
Rk (in)' h,where h - a step with respect to time.
a2k Ijlk(ln)
=
_1_; l)(In)1 a2k" 6n(t n)= 2 [L - l)(lnlJ"Tk(tn) and Rk(tn) - the values of the right-hand parts of
(8.7)
and(8.8)
respectively when t
=
tn without wk(t )Ak(t ) and 6. n n k(tn)Bk(t ).nBecause in most cases in practice u(x,O) is given numerically (or
graphically), Ak(O) and Bk(O) can be obtained at least by the Simpson method.
If the numerical value of the boundary conditions HセセHエI and セGHエI are
I
unknown), in equations
(8.7)
and(8.8)
one must introduce a substitution ofセQHエIQQHエI
the type z
=
Ak(t) + k • The system(8.7), (8.8)
and(8.9)
whenn
=
1,2,3,4 and under the conditionudO,i} = - 3-7,5 sin 21<i; T= 8760h""t"$
T '
U2(t, i)
=
const= - 3; l= 19,4 M.was computed with the machine "Strela" at the computation centre of the Moscow
State University. From a comparison of the results using various values for n
it follows that the convergence of a series of approximate solutions is rather
rapid. Beginning with n
=
2 the solutions differ little from each other andtherefore for specific cases can be limited to this number.
With this condition a solution may be obtained on a manually operated
computer. A large number of the time consuming operations can be nomographed
which simplifies the computations.
This solution of the Stefan problem permits the finding of the mechanisms of the seasonal freezing of soil as well as the formation of permafrost.
Because of this we will use it for analyzing the development of seasonally freezing and perennially frozen zones.
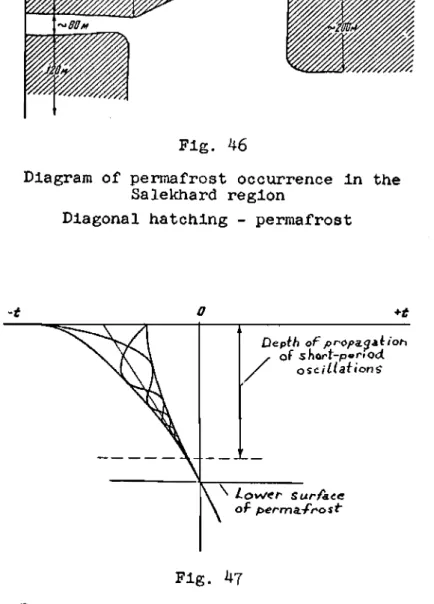
Temperature Regime of the Surface of the Soil and the Seasonal Freezing and Thawing of the Upper Layer of the Earth's Crust
The consideration of boundary conditions at the surface of the soil will be based on the interrelationship between the temperature regime and the depth
diagram (Fig. 27) of the conditions and depth of seasonal freezing and thawing
of the soil. The idea behind this diagram is explained below.
The depth of seasonal freezing and thaWing of tqe upper layer of the earth's crust as well as the temperature regime are determined by conditions
of heat exchange between the soil and the atmosphere. Therefore the thickness
of the ウセ。ウッョ。ャ freezing and thaWing layers should be determined from data on
the heat cycle and thermal balance of the soil. However, the quantitative
aspect of the heat cycle in the soil is not well known and therefore the
dis-cussion must be restricted only to giving those simple mechanisms in the freezing and thawing of the earth's crust which have been established at the present time.
Boundary conditions of heat exchange at the surface of the soil are
determined 「ケセァ・ッァイ。ーィゥ」 factors. Their influence is reduced to variations in
the mean annual temperature and the temperature range at the surface of the
soil. The nature of the temperature field and the propagation of thermal
waves in the various soil horizons are governed by geological factors. Under the same boundary conditions soils of different composition and
structure freeze to different depths. On the other hand the same Boil but
under different boundary conditions also freezes to different depths. Because of this the classification of layers of seasonal freeZing and thawing should be constructed with respect to the use of two mutually related
indicators: the temperature regime at the surface and the composition of the
soil.
In the classification given the subdivisions, with respect to mean annual
temperatures of the soil, are based on the considerations given below.
The periodic changes in the mean annual temperatures of the air and soil have a range of from 0 to ±loC; variations of ±l to ±2°C occur only for
individual years. Because of this when there is a perennial mean annual
temperature with a range of 0 to ±loC there is a periodic transition of the temperature through the OoC point and correspondingly the seasonally freeZing
layer transforms periodically to a seasonally thawing layer. Thus at
tempera-tures from 0 to ±loC the seasonally thawing and seasonally freeZing layers are
called transitional. In the temperature range of ±l to ±2°C such a transition
can occur only occasionally in individual years; correspondingly this type of
seasonal freezing and seasonal thawing is called semi-transitional. In the
range of ±2 to ±5°C the transition through OoC can occur only as a result of prolonged changes in the conditions of heat exchange between the soil and the atmosphere; correspondingly this type of freeZing and thawing is called
pro-longed stable. At temperatures above +5°C and below _5°C even prolonged changes
and therefore this type of seasonal freezing and thawing is called stable. Temperatures below _10°0 are characteristic of severe climatic conditions and therefore the type of layers of soil with changes of temperature reaching
-15°0 is called arctic and below -15°0 - polar. Temperatures above 10°0 occur
only in southern regions, above 14°0 in subtropic regions and above 18°0 in
the trop;cs. These layers are called southern, subtropical and tropical,
respectively.
When the above 0°0 mean annual temperature is equal to the temperature range of the soil, seasonal freezing does not occur since the minimum tempera-ture of the soil barely reaches 0°0 and will nevertheless remain above
freez-ing. But taking into account the fact that the mean annual temperature varies
from year to year by ±2°0 as a ュ。クセオュL the conditions excluding the
possibil-ity of a seasonally freeZing layer can be written in the form tm
^セ
+2·.
where A - the meteorological amplitude in temperature of the 30i1 at the surface equal to twice the usual physical amplitude in the temperature of the soil.
The condition for the development of a stable seasonally frozen layer would correspondingly be
tm\セMRᄋ 2 •
Hence it follows that in the interval between these two ャセゥエウL i.e. under
the condition
セK 2>(l» セM 2·
2 2
there will be unstable types of seasonally freeZing and seasonally thawing
layers. Depending on the ratio of the mean annual. temperatures and amplitudes
of the soil temperatures it is convenient to subdivide the unstable types of seasonal freezing into the follOWing subtypes:
when スMゥ^HOᄏセMRM occasionally disappearing, when セ >(t )>セ -1- periodically disappearing,
z m 2
when セ +1>1",
>
1
-periodically developing,when セ +2>I
>
セ +i _occasionally developing,2 m 2
when lin
>
セK 2 _daily freeZing of the soil;2 seasonal freezing is completely
absent
A ウセゥQ。イ subdivision can be made also for the classification of
A similar derivation of subtypes depending on the amplitude of Boil
temperature was based on the changes in depth of seasonal freezing and thawing of the soil corresponding to changes in the amplitude of soil temperatures. It is known for example that in the European part of the U.S.S.R., in Western
Siberia and in Yakutia these depths vary. It is therefore convenient to
intro-duce the following numerical gradations with respect to amplitudes correspond-ing to specific climatic regions and simultaneously derive types of seasonal freezing and thawing:
when A < 15°C - sea coasts - maritime,
when A
=
15 to 22°C - sea coasts - moderate maritime,when A
=
22 to 27°C - European part of the U.S.S.R. to theUrals - moderate continental,
when A
=
27 to 34°C - Western Siberia - continental,when A
=
30 to 42°C - central Siberian Plateau - elevatedwhen A
=
42 to 48°C - Eastern Siberia - severe continental,when A > 48 central part of the Siberian mainland
-extreme continental.
The classification of seasonally freezing and thawing layers by geological indicators should be based on the lithological features and moisture content of
the soils comprising these layers. With respect to lithological features and
water permeability 9 types of soil are identified: (1) peat, (2) clay,
(3)
clay loam, (4) sandy loam,(5)
silt,(6)
fine sand, (7) medium sand,(8) coarse sand, (9) gravel and stones in the absence of fine-grained material.
With respect to moisture content it is convenient to identify the follow-ing three types of seasonal freezfollow-ing and thawfollow-ing.
1) Wu < wf < Wu +
セ
(Wf - wu) - deep freezing and thawing,2) Wu
+
j
(wf - wu) > w > wu+
セ
(Wf - wu) - medium freezing and thawing;3) wf > w > Wu
+
セ
(wf - wu) - shallow freezing and thawing.Here w - natural moisture content of seasonally freezing or seasonally thaw-ing soil;
wf - full moisture capacity of the layer; W
u - quantity of unfrozen water at the given temperature.
The above classification scheme can be used to find the general mechanism in the latitudinal zone for the distribution of seasonal freezing and thaWing layers with respect to depth.
The scheme takes in the basic natural features which determine the depth
of seasonal freezing and thawing of the soil. The depth (accurate to
centi-metres) can be determined for each specific point only with the simultaneous
amplitude in the variations of the mean monthly temperatures, the lithological composition of the soil and the moisture content.
A similar approach is applicable also for vertical zones with the one
セ
difference that changes in the distribution of seasonal freezing and seasonal thawing of the soil with respect to depth will be taken from sea level up to
higher altitudes instead of from south to north. The effect of latitude and
altitude is complicated by changes in lithological composition of the soil and its moisture content.
The derivation of types of seasonal freezing and thawing and knowledge of the laws governing their formation provides a new approach to the mapping of
this phenomenon. The four main factors noted above should be plotted on the
map (Table XVI).
The Temperature of the Soil at the Bottom of the Layer With Seasonal Variation in Temperature
Let us now consider the formation and development of the temperature regime of the seasonal freeZing and thawing of the SOil, i.e. the boundary
conditions at the permafrost table. The general mechanisms in the formation
and development of the temperature regime are considered in Chapter IV. We
will therefore deal only with some particular mechanisms depending on specific conditions.
It is generally known (Voeikov, 1904; Kudryavtsev, 1954) that the mean annual temperature of the air and of the soil are not the same; the mean annual air temperature in the permafrost zone is usually lower than the mean annual
soil temperature by several degrees. The difference between them is denoted
by Sz' then
(8.10) where t s is temperature of the soil and
t a is temperature of the air.
The inequality of the soil and air temperatures is due to a variety of
geological and geographic factors. It would be desirable to determine the
contribution of each of the component factors. It would then be possible to
determine the mean annual soil temperature from the mean annual air tempera-ture and vice versa.
An important factor in forming the temperature regime of the soil is snow
cover. This question is very complex and extensive and therefore we will deal
only with the dependence of the mean annual temperatures and annual
tempera-ture amplitudes of the soil on snow cover. In most cases snow cover results
first a case when anow cover during the wintertime plays the role of a heat insulator.
We will use the emperica11y established relationship (Kudryatsev, 1954)
Amm (
t)
S
= -
I-I 2 t I ' (8.11)
where Amm - the annual amplitude of the mean monthly air temperature, and
f
=/z
Vir
where
z -
thickness of snow cover,k - heat conductiVity coefficient for snow, T - period of oscillation equal to one year.
SUbstituting the value of Sz from (8.11) we obtain:
ts= ta
+
セ
(1
-+).
Introducing the correction for the change in the mean annual air
temperature for height セエ m 1/213 degrees we obtain:
metres'
ts
=
ta+
Hat+
A;m (
1 -t) ;
(8.12)
(8.13 )
where ta - the mean annual temperature of the air at sea-level;
H - the height of the place in metres.
From this relationship it follows that the mean annual temperature of the soil increases with the mean annual temperature of the air.
The value of S depends on the thickness and density of the Suow cover
z 1
and on the amplitude of the air temperature. The value of (1 - f) depending
on thickness h and density p and the coefficient of heat conductivity k of the
snow cover are given in Table XVII.
In using formula 8.13 one should take the calculation thickness of the snow cover hca1c to be
h m k . h
calc c max'
where hmax - is the maximum mean depth of snow cover taken over a 10 yearperiod,
kc - the coefficient for determining the calculation thickness of snow
cover (Table XVIII).
The apprOXimate dependence between the thickness and density of snow
cover is given in Table XIX.
Using the data of Tables XVII, XVIII and XIX and knowing the annual mean
monthly temperature amplitUde of the air (according to meteorological
To facilitate computation, Table XVII gives the most frequently encoun-tered values of (1 -
j)
depending on the thicl<ness of the snow cover.With formula
8.13
the dependence of temperature ,of the soil on thethick-ness and density of snow cover can be refined and a quantitative estimate can be given.
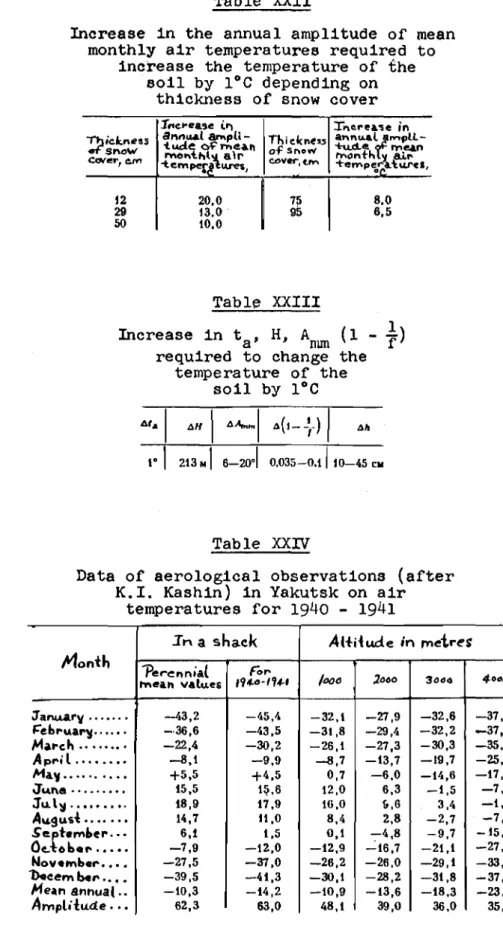
It is important to note the different insulating effect of snow cover
under different climatic conditions. The greater the amplitude of the air
temperature, under otherwise equal conditions, the greater the insulating
effect of snow cover. With the saIne thickness and density of snow cover and
with the same mean annual temperature of the air under conditions of continen-tal climate, the mean annual temperature of the soil will be higher than in a
maritime climate. Therefore the insulating effect of snow cover can be
considered only with respect to climate. In this connection to increase the
mean annual temperature of the soil by 1°C different amounts of increase in snow cover are required.
For illustration we present Tables XXI and XXII.
According to formula
8.13
the mean annual temperature of the soil isdetermined by the following factors: the mean annual temperature of the air
at sea-level, the altitude of the location, the annual amplitude of the mean
monthly air temperatures, thickness and density of snow cover. The value of
each of these factors is shown in Table XXIII.
The remaining climatic factors are not considered in formula
8.13.
This,however, does not mean that they do not exert an influence on the formation of
mean annual temperatures of the soil. Some of them show up in the mean annual
temperature of the air and its amplitude, whereas others are generally not
taken into account since their values are as yet unknown. By virtue of this,
formula
8.13
elucidates only one aspect of the phenomenon and does not expressthe general picture. The mean annual temperature depends also on all other
factors of the geological and geographic medium which will be considered below.
In the comparison of results of calculations using formula
8.13
with alarge number of data it has been established that the mean quadratic error is セoNUᄚN This accuracy is completely sufficient for the practical application
of formula
8.13
in calculating the mean annual temperature of the 60il frommeteorological data.
Using formula
8.13,
calculations were made of the difference between themean annual temperature of the air and of the soil (Sz) for the entire
terri-tory of the U.S.S.R. from which a map was drawn (Fig. 28). On this map it can
be Been that the value of Sz increases with the thickness of the snow cover
and with the extent to which the climate is continental. The maximum value of
70 for Sz is reached in the region of Igarka and in central Yakutia.
regions the value of Sz reaches 11°C (Middle Kolyma), where heavy snow cover is observed (up to 1.1 m) with a relatively large annual amplitude in the mean monthly temperatures of the air (up to 55 - 60°0).
In the south, where the thickness of the snow cover may be 0, Sz will
also be equal to O. By insulating the SOil, the snow results in a decrease of
the annual mean monthly amplitude of the soil temperature. If one takes the
value of the amplitude at the surface of the snow to be equal to the amplitude of the air temperature, under the snow at the surface of the vegetation cover
the amplitude will be less by the value of Sz. Correspondingly, the
meteoro-logical amplitude will be decreased by 2Sz. Thus using formula 8.13 and the
map shoWing the isolines of Sz one can determine the decrease in amplitude of
the エ・ョセ・イ。エオイ・ due to snow cover.
Using formula 8.13, a computation was made of the critical thickness of snow cover at which the mean annual temperature of the soil must be equal to 0
under otherwise equal conditions. Tne computation was carried out for a
net-work of points distributed over the entire territory where permafrost occurs
and from these data a map was drawn (Fig. 29). The values of the critical
thickness of snow cover (hk) have been converted to sea level. For computing these values taking into account absolute altitude, annual temperature ampli-tude of the air and density of snow cover, two nomograms (Fig. 30 and 31) are
applied to this map. The isolines of hk are drawn on the map at an interval
of 0.25 mfrom 0 to 15 m; south of the O°C line, isolines are given for the
altitude of the place where the mean annual temperature is equal to O°C. These
isolines are dotted.
The second nomogram (Fig. 31) shows that the denser the snow the greater
will be its critical thickness and vice versa. The map does not show isolines
of the thickness of snow cover above 1.5 metres which is observed very rarely in some negative types of relief (ravines, gorges, "etc.). Thus north of the isoline of 1.5 metres the OoC temperature of the soil and the separation of the pernmfrost from the seasonally freezing layer cannot be explained by the
thickness of snow cover and is the result of other causes. In the territory
between the isolines of 1 and 1.5 m this phenomenon can be explained by the
influence of snow only in exceptional cases. Finally, south of the 1 m isoline
snow cover may be one of the fundamental causes for the separation of perma-frost from the seasonally freezing layer.
These nomograms can be used also for determining t s of the soil and Sz for various densities and thicknesses of snow cover which is particularly important for regions where density and thickness of snow cover are not
uniform. This refers for example to tundra regions where as the result of
unifornl over individual micro sections of the region. Great differences in thickness of snow cover is also observed in fold-mountain regions.
Using formula 8.131 computations were made of the mean annual temperature
of the soil for a number of points (200 calculation points and 400 observation
points) for the territory of the U.S.S.R. (Fig. 32). This map shows the
temperature zones with respect to latitude and the soil temperatures have been converted to sea level; the map gives a' good indication of the influence of the Atlantic, Arctic and Pacific Oceans on the formation of the geothermal
zones. As a result the isolines protrude far south in the central part of
the continent and rise to the north in the west and east. The distance between
the isolines with a temperature spacing of 1°C, called the latitudinal temper-ature stage, varies from 70 - 80 up to 400 - 500 kilometres and has a mean value of 150 - 300 kilometres.
The minimum mean annual temperature of the soil at sea level reaches -11°C in the Taimyr Peninsula and in the delta of the Lena River.
The isotherms on this map were drawn only with consideration of climatic
factors (snow1 mean annual air temperature and its annual amplitudes). The
influence of other factors should be considered in addition.
It should be noted that snow cover acts as an insulator and moreover
reflects and absorbs radiant energy. Its influence on the temperature regime
of the soil depends on the combination of the above-mentioned influences and
will be different in different regions. In winter the snow reflects a
con-siderable part of the incident solar energy and retards radiation from the
soil to the atmosphere. In the spring a considerable part of the solar energy
is spent on melting the snow. In this case snow is a factor acting to cool
the soil.
In high latitudes where there is evaporation of snow at low air
tempera-tures the thickness of snow cover is greatly reduced by the time the air temperature increases to above freezing values and thus relatively less solar
energy is spent on melting the snow; howeverl the cooling effect of snow on
the soil occurs much earlier than the advent of warmer air temperatures.
In the far south where the thickness of snow cover is measured in several
centimetres its insulating effect is relatively small and can be neglected.
The main effect herel is the reflection of radiant energy from the white
sur-face of the snow. In this case the snow acts to cool the soil and the mean
annual temperatures would therefore be lower than the mean annual temperature
of the air. This effect has been noted for the northern Caucasus (Stotsenkol
1953).
No one has yet made a detailed study of the role of snow cover in the thermal exchange between the soil and the atmosphere and it is therefore
difficult to give it
any
quantitative estimation. Qualitatively it can becharacterized by
the
graph shown 1n Pig.33.
vfuen the anow oover 16 l1ght
(from
0 to h1 ) the cooling effect of snowis predominant; its 1nsulat1ng
efreot
is close to zero and snow acts to coolthe soil. As the thiokness of the anow cover increases its insulating effect
increases with a relatively small increase in reflecting capability. When the
snow cover reaches the value of h2 the insulating effect of snow decreases
owing to the expenditure of energy on melting the snow and the reflection of
solar energy from the snow surface. Consequently# as the thickness of the
snow cover increases its insulating effect gradually decreases and sUbsequently
has a cooling effect*. セィ・ョ the thickness of snow cover reaches h3 the snow
does not have time to melt during the summer and firns and glaciers begin to
be formed. From this time on the white surface of the firn or glacier reflects
part of the solar energy all year round and thus cools the soil to the maximum degree.
Thus Fig.
33
illustrates a complex relationship between the changes inthe temperature of a frozen soil stratum and the thickness of the snow or ice cover.
Snow cover also has a great influence on the depth of seasonal freeZing
of the soil. In a section where the snow cover has been removed the depth of
freezing in some cases may be 50 -
60%
greater than on a section with naturalsnow cover.
Let us consider this problem in more detail.
In the schematic diagram (Fig. 34) let us take two points - one
corre-sponding to a plot with a soil temperature of t 1 under natural snow cover with
an amplitude of A2 and the second - a plot from which snow has been removed.
The removal of snow results in a decrease in the mean annual temperature of the soil from t 1 to t 2 • Correspondingly because of this change# at the same
amplitude of A2 there should be a change in the depth of seasonal freeZing
from h1 to ィセN However# the removal of snow cover increases the amplitude
from A2 to A3 and consequently changes the depth of seasonal freeZing of the
soil from ィセ to h2• Snow cover decreases the depth of seasonal freeZing of
the soil by increasing its mean annual temperature as well as by decreasing the amplitude.
For seasonal thawing a different mechanism is observed. Let us again
consider two points in Fig. 35 - one for a section with natural snow cover and
the other for a section from which the snow has been removed. The removal of
* Editor's note: The author does not take into account the duration of the
snow results in a decrease in temperature from t, to t 2 • Correspondingly with
unchanged amplitude A2 there should be a decrease in the depth of seasonal
thawing from h, to ィセN However , the removal of snow cover leads to an increase
in amplitude from A2 to A3 • Correspondingly there should be an increase in
the depth of seasonal thawing from ィセ to h2•
Thus the absence of snow cover decreases the depth of seasonal thawing of the soil owing to a decrease in winter temperature and to an increase in the
depth of seasonal thawing owing to an increase in amplitude. One compensates
the other and the total effect of the snow cover is insignificant.
From the above one can see an important difference between the influence of snow cover on the formation of seasonal freezing and seasonal thawing of the soil.
In addition to the mechanisms considered above some regional climatic
features connected with the formation of the mean annual temperature of the
soil should be considered. One of these is the winter temperature inversion.
In fold-mountain terrain and in regions of winter anticyclone the mean annual
temperature of the air in the valleys is lower than on water divides and
slopes. This phenomenon has not been studied to any extent and a quantitative
characteristic cannot be determined. It is therefore difficult to connect it
with mean annual temperatures of the soil. The changes in mean annual
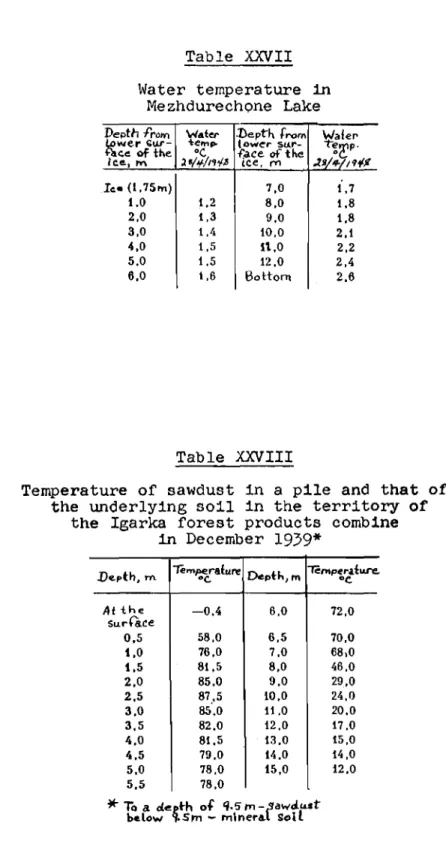
temper-ature and amplitude of the air with altitude has been quite fully determined for Yakutsk (Table XXIV).
From this table it is seen that, for the first thousand metres the increase in temperature of the air is from _14.2°C to -10.9°C , i.e. almost 0.37°C per
100 metres. Approximately from the altitude of 1 ,000 metres upwards there is
a decrease in temperature with altitude: from 1 ,000 to 2 ,000 metres - 0.27°C
per 100 metres , from 2 ,000 to 3,000 metres - 0.47°0 and from 3 ,000 to 4 ,000 metres - 0.50°C.
The annual mean monthly amplitude of air temperature in a hut was 63°C , at an altitude of 1,000 m - 48.loC, at an altitude of 2 ,000 m - 39°C , at 3 ,000 m - 36°C and at 4 ,000 m - 35.9°C.
In connection with the winter temperature inversion the variation in mean
annual temperature of the soil compared with the vertical temperature gradient
can vary within the range of 0 to 6°C. This deviation is a maximum. It is
impossible to give a general quantitative estimate.
The position of the section with respect to relief. Relief is an
impor-tant factor and in nlany ways determines the temperature regime of the soil. An increase in altitude of 100 metres corresponds to a decrease in soil
relationship and influence the change in vertical temperature gradient of the
soil. Depending on the location of the gauge point the エ・イイセ・イ。エオイ・ of the
soil may vary by 10 - 20°C and more.
It is lcnown that the quantity of solar energy reaching the surface of the earth depends on the slope and exposure.
Correspondingly there is a difference in the temperature of the soil. As
an illustration we give an example of variations in the temperature of the soil in eastern Transbaikal in Padi Mul'tsai (after P.I. Koloskov); the
measurement was carried out on July 3-6 at 1:00 PM (Table XXV). The variation
in mean annual temperature of the soil on a north-facing slope is governed by a decrease in annual amplitude and on a south-facing slope by an increase in amplitude.
The range between the mean annual temperature of the soil on north and
south-facing slopes will vary depending on the steepness of the slopes. As
the steepness of the slope increases this range will increase and vice versa. For slopes of up to 30° the difference may reach 1.5 - 2°C.
The exposure of slopes also influences the variation in the annual
temperature amplitude of the soil. During the winter when the slope is
covered with snow the temperature becomes apprOXimately the same for all
expo-sures. A large difference is observed in the summer when a change occurs in
the temperature regime of the soil.
The temperature regime of the soil for north and south-facing slopes is shown schematically in Fig. 36 where the annual temperature variation with depth for a horizontal surface is plotted.
The effect of exposure may be complicated by other factors, for example,
uneven distribution of snow cover. In this respect the region of Vorkuta is
typical where many investigators have established the absence of any influence
of exposure of slopes on soil temperature. Here the prevailing winds are from
the south and southwest and snow cover blown from these slopes is deposited on the north and east-facing slopes which result in their relatively high
temper-ature. In the summer, on the other hand, the south and west-facing slopes
receive more heat than the north and east-facing slopes. As a result, these
two factors compensate each other and the temperature of the 80il on all exposures is equalized.
Micro, meso and macro relief affect the temperature of the soil primarily
because of uneven distribution of the snow cover. Various types of positive
forms of micro relief (for example mounds) usually have a relatively light
snOvl cover and are frequently bare. On the other hand, all negative forms of
high temperature for negative forms of relief as compared with positive forms. The influence of macro and meso relief on the temperature of the soil extends
over considerable areas and depth; the effect of micro relief is limited to very small areas (frequently measured in fractions of a metre) and insignifi-cant depth.
Many investigators have established that on the hummocky peat bogs of eastern Siberia the permafrost table is usually a mirror image of the surface
relief. Under the mounds the permafrost table is deeper than between the
mounds, resulting in a difference in the temperature regime of the soil
particularly to the 0.5 m depth. At a depth of 2.5 m the temperature is
equilized. For large mounds and depressions, up to several tens of metres in
cross-section, the depth to which their influence is felt in the soil is
correspondingly greater - it is equal approximately to the minimum
cross-section. The amplitude of the temperature on the mounds increases because of
winter cooling, as well as because of greater summer heating as compared with the depressions between the mounds where the amplitude is decreased.
In considering the role of relief in the formation of the temperature
regime of the soil it is necessary to deal with the age of the relief and its
importance with respect to the problem under consideration. Some investigators
have noted that on relatively young relief the temperature of the soil is as a rule higher than on older forms of relief; it therefore becomes necessary to consider the process of formation of the perlnafrost in connection with the general history of the development of the relief.
It is quite natural that in considering permafrost under development one
must also consider the dynamics of the medium in which it takes place. In
this case one must keep in view the different rates of development of relief
and permafrost. If the rate of permafrost development is comparable to the
rate of change in relief, the history of the development of relief should be of primary importance; if these two rates differ substantially they cannot be in direct relationship to each other.
The thermal inertia of permafrost for various depths is different. For
upper horizons within the range of about 50 metres it is measured from tens to
several hundred years. According to the data of the Igarka Permafrost Station
the thermal inertia for depths of
5 - 8
metres barely reaches 10 years. Thesame is observed for a number of points. As regards depths of several hundred
metres, the thermal inertia is measured in thousands, tens of thousands and
hundreds of thousands of years. The time of formation of river terraces is
measured in thousands of years. Correspondingly the historical progress of
the development of relief may be of decisive importance in the formation of only the lower horizons of the permafrost.
Since the mean annual エ・ョセ・イ。エオイ・ of the soil in the stratum with annual temperature variation is the result of present-day climatic conditions
occurring during the past 10 - 20 years, the age of the relief cannot have any important effect.
Vegetation cover. The vegetation cover being on the boundary between the
lithosphere and the atmosphere has an important effect on the temperature
exchange between thenl and on the temperature of the soil. It has an influence
on the amount of radiant energy absorbed and reflected by the surface; it pro-tects the surface of the soil from the effect of winds and finally, to an
important degree, it determines the ョセゥウエオイ・ exchange between the air and the
soil. The absorption of water by vegetation and transpiration, the
precipita-tion of dew on vegetaprecipita-tion, the decrease in evaporaprecipita-tion from a surface covered with vegetation, etc., unquestionably have an important effect on the heat
exchange between the upper soil horizons. The processes of moisture exchange
occurring with the participation of vegetation cover are very complex and
cannot in all respects be subjected to a quantitative estimation. The
dif-ficulty in taking them into account is complicated by the multiplicity in
forms of the vegetation cover and its variation with respect to time. Forest,
shrub, meadow and tundra vegetation have different influences on moisture exchange and heat exchange between the air and the soil.
All of this indicates that vegetation cover, in contrast to snow cover,
cannot be regarded simply as some additional thermal resistance. Its influence
on the temperature of the soil is varied and complex and requires further study.
The investigation of the influence of vegetation cover on the formation of the mean annual temperature of the soil was undertaken as a secondary study
primarily by agrocl1matologists. The only one who made a special study of
this problem was P.I. Koloskov (1925) in connection with a general study of seasonal freeZing but he had at his disposal only data published by agro-climatologists.
In recent times the V.A. Obruchev Permafrost Institute has made a new step towards the study of the part played by vegetation cover in the heat exchange between the soil and the atmosphere and the frozen subsoil (see Chapter XII).
Vegetation cover protects the soil from winter cooling and summer heating,
thus reducing the amplitude of temperature variation. In the south the
decrease in summer amplitudes will be greater than the decrease in winter amplitudes; therefore vegetation cover in the south has primarily a cooling
effect on the soil and in the north a warming effect. In addition under
has been established that for the Far East when there is a snow cover of up to 20 cm the removal of the forest results in a cooling of the soil but when the snow cover is deeper the removal of the forest results in warming of the
soil. The increase in annual amplitude due to removal of the forest reaches
10 - l3°C.
After the cutting of the forest and removal of the vegetation cover in the Far East, either with a light snow cover or with a heavy snow cover, there is an increase in the mean annual temperature of the soil and the value of the
increase depends on the thickness of the snow cover. It can be said that
under conditions of a continental climate with a prolonged warm summer and severe winter, when there is a snow cover of 10 - 20 centimetres, the vegeta-tion cover protects the soil from summer heat and from winter cold to
approxi-mately the same extent. With a heavier snow cover the warming effect of the
vegetation cover during the winter will be greater than the cooling effect during the summer.
In northern regions the insulating effect of grass and shrub vegetation
increases the mean annual temperature of the soil by not more than 1 - 2°C. Grass and shrub cover, like forest cover, decreases the annual temperature amplitude by apprOXimately 15 - 25% and when taken together by 30 - 50%.
The role of moss cover in the formation of the temperature regime of the soil is determined by its low thermal conductivity, high moisture capacity and
hygroscopic properties. The moisture capacity of Hypnum mOBS according to
available data reaches 360% and for Sphagnums 1,300 - 5,000% (in relation to
dry weight). To evaporate the moisture to produce 1 gram of dry moss requires
up to 8,000 calories (Sumgin, 1937).
Under a moss cover there is a greatly reduced amplitude in temperature.
During the winter the heat conductivity of frozen moss increases greatly. The
resultant decrease in soil temperature causes a decrease in the mean annual
temperature of the soil by 1 - 3°C. For regions with heavy snow cover there
is an inverse relationship. The decrease in annual amplitude of the soil due
to moss cover reaches 50 - 60% and when there is a thick moss cover it may be 80 and even 90%.
To determine the influence of vegetation cover on the depth of seasonal freezing and thawing we use the diagrams shown in Fig. 37.
Let us take a southern region where the vegetation cover has a cooling
effect on the soil. Let us plot two points on the diagram: one for a section
with natural vegetation cover and the second for a section from which the
vegetation cover has been removed. In the first case the temperature will be
lower and the amplitude less than in the second. The effect of vegetation
In regions of seasonal freezing the above-mentioned effect does not occur to any extent whereas in permafrost regions the removal of the vegetation cover results in a very rapid increase in the depth of seasonal thawing .
.
For the second case let us take a northern region where the vegetation
cover has a warming effect on the soil. This case is diagrammatically
repre-sented in Fig.
38.
Here the temperature of the section with natural coverwill be higher and the amplitude lower than for a section from which the
vegetation has been removed. The effect of the vegetation cover in this case
will be similar to that of a snow cover. In a region where there is seasonal
freezing the depth of freezing will increase greatly for the section that has been stripped of vegetation as compared with that retaining its natural cover.
In the permafrost region there will be no important difference in the depth of
freezing.
Lithological differences in soil composition have different thermo-physical properties and have different properties on freezing and thawing. These differences have an effect on the formation of the mean annual tempera-ture and amplitude of the soil.
In this problem, moisture content and ice content of the soil are of
great importance. They determine the expenditure of heat on freezing and
thawing and have an important effect on the thermo-physical properties of the
soil. Of greater importance is the filtration property since the infiltration
of warm precipitation into deeper lying soil horizons bring in substantial
quantities of heat. This quantity varies with climate and conditions of
surface run-off and ground water. For example, in the Aldan Plateau the water
divide is frequently comprised of highly weathered bedrock covered by coarse
fragmented residual rock and talUS. During the summer more than half of the
annual precipitation occurs here which infiltrates and heats up the layer of residual rock and talus and also the fissured part'of the weathered bedrock. As a reSUlt, in such regions permafrost is frequently absent and the
tempera-ture of the ground varies within the range of 1 to 2°C although by climatic
data it shOUld be of the order of -1 to _4°C. Such temperatures are in fact
observed for areas composed of clay soil where there is no infiltration of warm precipitation.
Smaller differences in temperature resulting from this factor are observed
by many investigators for highly varied regions. In the Selemdzha River region
in the Far East where there are sandy gravelly soils and clay soils this
dif-ference reaches 2.8°C (Kudryavtsev,
1939).
In western Siberia along thevalleys of the Dakh, Elogui and ObI Rivers the difference is
1.5 -
2.0°C(Popov,
19531).
For the Vorkuta region approximately the same values areUsing this particular feature the research workers and mining engineers of Dalstroi developed a method of artificially thawing the upper horizons of the per-mat'r-ost by passing water through the seasonallY thawed layer. Using
this method it is possible to thaw a layer of permafrost 4 -
8
metres deepduring a summer. In addition to good infiltration an appropriate slope of
the terrain is required which will ensure a satisfactory rate of filtration.
セヲオ・イ・ the flow of ground water is blocked swampy areas are frequently formed
within whf ch the mean annual temperature of the soil is sUbstantially lower
than that of the surrounding area.
In the absence of extensive infiltration of surface water, the mean
annual temperature may be 1 - 2°C lower than in areas where there is filtra-tion if this difference is due entirely to the lithological character and
moisture content of the soil. If the temperature of sandy loam is taken as an
average the temperature of clay and peat soils will be
0.5 -
1°C lower and insand and coarse gravel it may be
0.5 -
1°C higher. The infiltration ofsurface water and circulation of ground water may increase this difference to
3 - 5°C.
These data agree completely with the classification of different types of seasonal freeZing and thaWing of soils given above and the depths in both cases are determined by the temperature regime of the soil, its composition
and moisture content. In this case it is interesting to note the difference
depending on moisture content in the depth of seasonal freezing and thawing
for sand and clay soils. For sand the depth of seasonal freezing decreases
with increase in moisture content and for clay there is first an increase in depth of freeZing with increase in moisture content up to a certain value of W
u corresponding to the maximum quantity of bound water at a given temperature but with a further increase in water content there is a similar effect to that
observed for sand. These differences are explained as follows. With an
increase in the moisture content there is an increase in the heat conductivity coefficient and also in the heat capacity of the soil as well as in the
liber-ation of heat due to ice formliber-ation. The first factor leads to an increase in
the depth of seasonal freezing and the second to a decrease.
Bound frozen water plays no part in the heat of crystallization and there-fore its increase leads only to an increase in the coefficient of heat
conduc-tivity and an increase in the depth of seasonal freezing. For sand containing
small quantities of frozen moisture the dominating role is played by the heat
of crystallization. For clay within the range of 0 - Wu there is only an
increase in the coefficient of heat conductivity. The heat of crystallization
does not playa part in this case. \fuen the moisture content is above Wu the
dominating role is played by the heat of crystallization and the same effect is observed as indicated for sand.
ゥャセッイエ。ョエ factors in governing the depth of freezing and thawing of the
soil are density, structure and conditions of occurrence of the soil. The
heat conductivity coefficient increases \'lith densitY.,which in general should result in an increase in depth of seasonal freezing and thawing; however a simultaneous variation in moisture content complicates this relationship.
For uniform soils and for laminar structures made up of different types
of soils the depth of seasonal freezing and thawing will be different. In the
first case the depth will be greater than in the second.
Salinization of the soil. There are no data in the literature on special
studies devoted to the influence of salinization on the temperature regime of
the soil. Some papers on permafrost indicate salinity as a factor favouring a
decrease in temperature of permafrost.
On an experimental plot of the Anadyr' Permafrost Station the temperature
of the upper horizons of highly saline clay Boils is
1.0 - 1.6°C
lower thanfor the surrounding areas (Shvetsov,
1938).
In the region of the Kempendyaisalt deposits (Yakut ASSR) the usual temperature of the soil is close to
-3.5°C
and in individual highly saline regions it reaches
-8.0°c.
Thus salinizationresults in a decrease in the temperature of permafrost since saline soils
con-stitute a particular type of saline cooling mixture. The decrease in
tempera-ture of the soil due to this factor varies from 1 -
2°C
(Anadyr') and from4 - SoC
(Kempendyai).Swampiness. The effect of swampiness on the temperature regime of the
soil is generally known and has been noted frequently in the literature on
permafrost. It is generally considered that swampy areas generally have
temperatures of
0.5 - 1.0°C
lower than on dry and well-drained areas. Thisregularity is observed in the Far East from the Amur-Yakutsk Road to
Komsomol'sk*, in the Transbaikal (Kachurin,
1950)
and in a number of otherregions which have a light snow cover. For Vorkuta (Redozubov,
1946),
western Siberia (Popov,
19531),
Igarka (Meister,1948)
with heavy snow cover(0.8 - 1.0
m) an inverse effect is observed: in swampy areas the temperature is higher than where there is good drainage.To explain the above-mentioned differences the following considerations
may be advanced. In summer a large quantity of the heat is consumed by
evaporation over swampy areas. As a result the heating of the soil is retarded
and the エ・ョセ・イ。エオイ・ of the underlying horizons is decreased. In winter if
there is a light snow cover there are sufficient heat losses for the heavily saturated soil to freeze and the underlying horizons undergo intensive cooling.
*
Report of the Baikal-Amur Road Expedition, holdings of the PermafrostIf there is heavy snow cover the heat transfer from the soil is retarded and as a result there is only partial freezing of the heavily saturated soil. During the summer this thin layer of frozen soil rapidly thaws and the soil heats up more than in areas that are well drained.
Thus, moisture saturation of soil leads basically to a decrease in mean
annual temperatures but the effect is varied and, depending on the thickness of snow cover, may result in an inverse effect, i.e. an increase in the mean annual soil temperature.
Surface water run-off. The particular features of the temperature regime
of the soils in valleys of large and medium size rivers have been noted by
many geocryologists. It has been established that for the Yenisei River in
the Igarka region there is a decrease in temperature along the cross-section of the valley from the river bed to the water divide by approximately 2.5°e
(Meister, 1948). The same was noted for the ObI River (Popov, 1953) and for
the Lena River (Mellnikov, 1951). The warming influence of these rivers is
approximately of the same order, 2 - 3°C. A similar picture is observed in
the valley of the Selemdzhi River (Kudryavtsev, 1939). Figure 39 shows a
temperature profile along the route traversed indicating a transition of soil
temperatures from above freezing to below freezing. As a result of the
warm-ing effect of the Selemdzhi River and its water flow, permafrost is absent in
the flood plain and in the first terrace. The typical temperature regime for
the region (-l.OOe) is observed only on the ancient terrace and the water
divide. The same picture is observed also in northern regions (Ponomarev,
1952). Within the limits of the river bed the temperature of the underlying
soil may differ from the temperature typical for the region by 10 or more
degrees owing to the influence of large rivers. Along the terraces of the
valley it usually does not exceed 2 - 3°e.
In conclusion it should be noted that large and medium sized rivers are
one of the most important factors which affect the temperature regime of the upper soil horizons above the permafrost over large areas under any general temperature conditions.
In the literature (Kudryavtsev, 1954) there are indications that in some
cases small streams have the reverse effect of cooling the permafrost under
the stream bed. This effect frequently takes place near the sources of streams
(the Selemdzhi River basin) or in places where there is intensive meandering over clay loam soil (between the Lena and Amga Rivers) and is explained as
follows: the clay loam soils prevent infiltration of water into the adjacent
horizons as a result of which summer precipitation flow along the surface
without giving off heat to the underlying horizons. The source of these
is very little precipitation. The main source of water is from the summer
thawing of the soil. Thus the temperature of the water at the source of the
stream is close to ooe and the temperature of the wat.er increases only
sUbstantially further downstream. The flow of water thus has the effect of
removing the summer heat from the horizon under the river bed and transports
it downstreanl. Further downstream this effect is not observed and there is a
general warming effect due to the river flow.
Lakes. The temperature regime of the bottom deposits of fresh-water,
land-locked lakes depends on their depth. When the water is shallow the mean
annual temperature in the bottom deposits may be either above or below
freez-ing. In deep lakes the temperature is above the freezing-point and the soil
is unfrozen, forming taliks which either partially or completely penetrate the permafrost.
To indicate the characteristics of the temperature regime of water and bottom deposits in deep, fresh-water lakes we cite the following two examples
(Shvetsov, 19512 ) : (1) Lake Pereval'noe (63°7'N, l39°82IE) located on the
divide between the Kebyume and Khandyga Rivers at an altitude of 1418 metres; the width of the lake is 400 metres, the length 800 metres and the depth 17.9 metres; (2) Lake Mezhdurechnoe (63°2l'N, l4l0 0 8 ' E ) located between the
Kebyume and Suntara Rivers at an altitude 1,060 metres; the width of the lake
is 2,000 metres, the length 2,000 metres and the depth 12.85 metres. The
results of measuring the temperature of the lake waters carried out in winter
are given in Tables XXVI and XXVII. The region is characterized by a low mean
annual temperature of the soil (to -lOGe).
From the tables it can be seen that the temperature of the water adjacent
to the bottom increases with depth and a temperature of 4.ooe occurs only at
depths above 17 metres.
vllien the width of the lake is much less than the thickness of the perma-frost it appears that a pseudo-talik is formed under the lake and underlain by
permafrost. In this case the incomplete thawing of the permafrost is explained
by lateral flow of heat into the surrounding frozen mass. If the width of the
lake is greater than the thickness of the permafrost then in all probability a talik will form thrOUgh the permafrost.
Surface water influences the depth of seasonal freeZing and thawing of bottom deposits affecting the heat exchange at their surface which influences
the mean annual temperature and amplitude. In the first approximation this
variation can be presented in the form of the diagrams shown in Fig. 40. Seasonal freeZing and thawing of bottom deposits can take place only when the depth of the lake H is less than the depth of seasonal freeZing of open lakes
this situation can only occur in shallow lakes less than 2.5 m deep and
usually much less. At these depths the temperature of the water in the summer
can be considered uniform throughout its entire deptp. ThuB t max - the
maximum temperature of the water during the summer in this diagram is
repre-sented by a vertical line. The minimum temperature at the surface of the ice
is determined by climatic data and is equal to t mi n. At the lower surface of the ice this temperature is
aOc.
For simplicity let us assume that the minimum annual temperature in the ice varies according to the linear law from t mi n at the upper surface of the
ice to
aOc
at the lower surface. Then at each point at depth h in the ice themean annual temperature t m will be
(8.14)
From the diagram (Fig. 40) and the formula it can be seen that an increase
in the depth of the lake results in an increase in the mean annual temperature and a decrease in amplitude in the bottom deposits.
Let us suppose that at a certain depth h, the mean annual temperature
will be
aOc.
When the depth of the lake is less than h, the mean annualtem-perature of the bottom deposits will be below freeZing and consequently in this case there will be a seasonally thaWing layer underlain by permafrost. When the depth of the lake is greater than h, there will be a seasonally
freeZing layer underlain by unfrozen soil. The value of h, from formula
8.14
is:
As the depth of the lake increases there will be a rapid decrease in the depth of seasonal freeZing of the bottom deposits which is explained by an increase in the mean annual temperature in the deposits and a decrease in temperature amplitude.
In a region where permafrost prevails when there is a gradual increase in
the depth of the lake, the seasonally thawing layer of bottom deposits will at first increase and then, having reached a maximum at a mean annual temperature
of
aOc,
will convert to a seasonally freezing layer, the thickness of whichwill gradually decrease. If the lake dries out gradually a reverse process
will take place, i.e. there will be an increase in the depth of the seasonally freeZing layer of bottom deposits with a subsequent conversion to a seasonally
thawing layer at a mean annual temperature of OOC. The thickness of this
layer of seasonal thawing will decrease to the value of the depth of thawing typical of the soil in the given region.