HAL Id: hal-02264225
https://hal.archives-ouvertes.fr/hal-02264225
Submitted on 6 Aug 2019
HAL is a multi-disciplinary open access
archive for the deposit and dissemination of
sci-entific research documents, whether they are
pub-lished or not. The documents may come from
teaching and research institutions in France or
abroad, or from public or private research centers.
L’archive ouverte pluridisciplinaire HAL, est
destinée au dépôt et à la diffusion de documents
scientifiques de niveau recherche, publiés ou non,
émanant des établissements d’enseignement et de
recherche français ou étrangers, des laboratoires
publics ou privés.
Visual explanation of simple neural networks using
interactive rainbow boxes
Jean-Baptiste Lamy, Rosy Tsopra
To cite this version:
Jean-Baptiste Lamy, Rosy Tsopra. Visual explanation of simple neural networks using interactive
rainbow boxes. 23rd International Conference Information Visualisation (iV), Jul 2019, Paris, France.
�hal-02264225�
Visual explanation of simple neural networks using interactive rainbow boxes
Jean-Baptiste Lamy
LIMICS, Université Paris 13, Sorbonne Université, Inserm, 93017 Bobigny, France
Email: [email protected]
Rosy Tsopra
Université Paris 13, SMBH, Bobigny AP-HP, Paris, France
Email: [email protected]
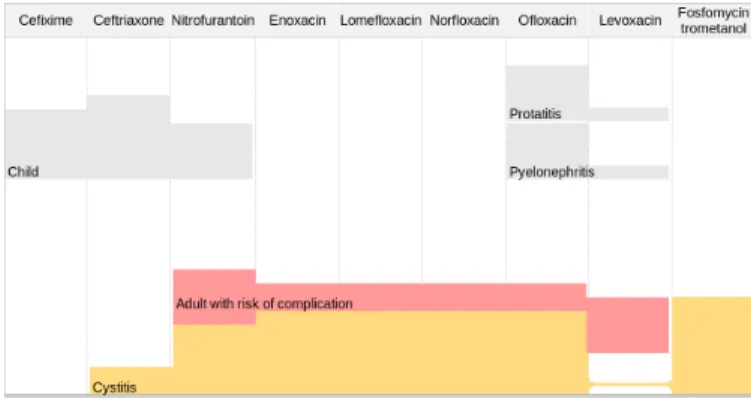
Figure 1. Interactive rainbow boxes for supporting antibiotic prescription decision. The available drugs for urinary infections are shown in columns. Each of the five boxes represent a patient condition. Colored boxes stacked at the bottom are the selected one, the grayed boxes are unselected. Here, the user selected “Cystitis” and “Adult with risk of complication”. The vertical stacked height of the colored boxes gives a score for each drug. Here, the drug with the highest score is “Nitrofurantoin”, and thus the system recommend Nitrofurantoin for treating this patient.
Abstract—Artificial neural networks are machine-learning al-gorithms inspired by biological neural networks. Their main inconvenient is their “black-box” nature: while they are very efficient for making predictions, it is difficult to explain these predictions. In this paper, we propose a visual translation of the reasoning performed by simple neural networks, i.e. without hidden layers. This visualization relies on rainbow boxes, a recently-introduced technique for set visualization, and on three improvements we propose for rainbow boxes, including interactivity. We also present a small application of the proposed approach to decision support in antibiotherapy, for helping a physician to choose an antibiotic in urinary infections.
Index Terms—Explainable artificial intelligence (XAI), artificial neural networks, medical decision support, set visualization.
I. INTRODUCTION
Artificial neural networks [1] are algorithms inspired by biological neural networks in the brain. They are used for machine-learning and for making prediction. The base unit of an artificial neural network is the perceptron, which is an artificial neuron. A perceptron has n inputs I and produces one output O. A weight wi is associated with each input Ii.
As a processing unit, the perceptron computes the weighted sum of its inputs, by multiplying the value of each input by its weight and summing them, and then it applies on the result the activation function f. Typical activation functions
are the threshold function (returning 1 if x is above the threshold and 0 otherwise) or the sigmoid function. Thus, the output is computed with the following formula: O = f (I1× w1+ I2× w2+ ... + In× wn).
Perceptrons can be organized in networks. Simple neural networks, made of a single layer of perceptrons, can achieve simple reasoning and solve linearly separable problems. On the contrary, non-linear problems require several layers. Deep learning usually involves many layers. However, despite this limitation in terms of reasoning power, a single layer of perceptrons may be sufficient for decision support in some real-life problems. An example is antibiotherapy: the physician has to choose an antibiotic drug to prescribe, and R Tsopra et al.[2] have shown that the most appropriate antibiotic can be determined by the linear computation of a score.
One of the main problems of neural networks is that they are “black-boxes”: they make a prediction but they do not explain to the user why they made this particular prediction. Explainable Artificial Intelligence (XAI) is a research field that focuses on designing intelligent systems able to explain their recommendations to a human being. Two main approaches were distinguished [3]: (a) interpretable models, which rely on non-black box systems such as rules or formal ontolo-gies, and (b) prediction interpretation and justification, for generating explanations for the prediction made by a black box algorithm. The same authors also mention visualization as another approach. In particular, visualization can be used along with approach (a): through visual reasoning, it can be used to turn a “black-box” model into a visually interpretable model. In a previous work, we proposed a visual translation of the reasoning of a single perceptron [4], using rainbow box, a technique we recently introduced for set visualization [5], [6]. In this paper, we will increase the complexity and focus on neural networks with several perceptrons but a single layer. We will also propose several extensions to rainbow boxes, and present a simple application to medical decision support in urinary antibiotherapy.
The rest of the paper is organized as follows. Section II presents related works in the literature, as well as our previous work on the visualization of a single perceptron. Section III describes three extensions to rainbow boxes, that will be used in the following of the paper. Section IV shows how these extensions allow using rainbow boxes to represent the reasoning of a simple neural network. Section V describes
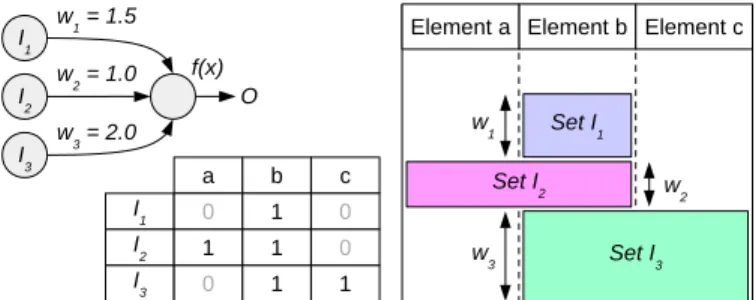
Figure 2. An example of a perceptron with 3 boolean inputs (I1, I2and I3,
left) and a dataset. The table (middle) shows the value of the inputs for each of the 3 input vectors labelled a, b and c. Weight w1, w2and w3the three
inputs. Each input corresponds to a set/box on the rainbow boxes (right), and each input vector to an enlement/column.
a small application in the field of medical decision support. Finally, section VI discusses the results of the presented works and their limits, and concludes with perspectives.
II. RELATED WORKS
In the literature, many recent works focused on the visu-alization of the learning of neural networks [7]. However, many of the proposed approaches were designed for helping engineers to understand how learning evolves, and to identify possible problems or suggest improvements. On the contrary, few aimed at explaining to the final user the reasoning performed by the neural network, or at allowing them to reproduce visually the reasoning. In Hohman et al. [7] survey, almost all surveyed papers were interested on explainability (36 out of 38, 95%), but only 11 out of 38 (29%) targeted the final user. In addition, all of them were focused on computer vision. Explaining computer vision is usually done by annotating the image and highlighting the image regions that lead to the system’s output, e.g. [8]. While this approach is easy to understand, it does not generalize outside computer vision.
Here are a few example of proposed works: (1) Decision Boundary Maps [9], [10], [11] consists in projecting the input space in two dimensions, and using colors to indicate the output of the classifier at each point. They can be applied to any classifiers, including neural networks. Boundary Maps show whether the various classes are well-separated, and which are the “near-missed” classes for a given input, but they do not explain why an input is classified in a given class. (2) Several approaches consist in visualizing part of the weights learned in neural networks as multidimensional data, e.g. using dimension reduction such as PCA (Principal Component Analysis) [12] or the grand tour [13]. (3) Beyond visualization, verbalization has been proposed for explaining the prediction of machine learning [14], but the authors focused on decision trees, which are “less black-boxy” and easier to analyze and interpret, compared with neural networks.
In a previous work [4], we introduced the use of weighted rainbow boxes, a typed-set visualization technique, for
trans-Figure 3. An example of non-rectangular weighted rainbow boxes, with wAb= 1.5, wBc= 1.0, wBd= 2.0 and wCb= wCc= 2.0.
lating visually the reasoning of a single perceptron. Figure 2 shows a simple example. The visualization of the reasoning of a perceptron with boolean inputs can be formulated as a set visualization problem : we considered each input vector as an element and each input as a set.
Rainbow boxes display the elements to be compared in columns, and the sets in labeled rectangular boxes that cover all the columns corresponding to the elements in the set. Larger boxes are placed at the bottom and two boxes can be side-by-side as long as they do not cover the same columns. A box can have holes, if the elements in the set are not displayed in consecutive columns. Finding the optimal column order that minimizes the number of holes is a combinatorial optimization problem with a factorial complexity. We proposed heuristic [5], [6] and metaheuristic [15] algorithms to solve this problem in a satisfying time, up to about 50 columns in real time and more than 200 otherwise. Finally, in weighted rainbow boxes, box height is used as an additional visual variable to encode the weight of the input.
III. EXTENSIONS FOR RAINBOW BOXES
A. Non-rectangular weighted rainbow boxes
Non-rectangular weighted rainbow boxes extend rainbow boxes with weights defined on a per-membership basis, i.e. for each (element, set) pair. The weight indicates the “importance” of the membership: a strictly positive weight implies that the element belongs to the set, while a weight of zero implies that the element does not belong to the set. Negative weights are not allowed, nor weight strictly between 0 and 1 (because a sufficient vertical space is needed for writing the box label).
Graphically, the weight of a (element, set) pair is repre-sented by the height of the set’s box in the given element’s column. This leads to irregular or non-rectangular boxes when the weights are not the same for the various elements of a given set (Figure 3).
B. Deformable “soft” boxes
In some circumstances, holes or gaps may be present in the visualization (see examples in Figure 4). A deformable “soft” boxis a box that can be deformed in order to tight the box stack and fill gaps or holes. They are especially useful in non-rectangular weighted rainbow boxes, because the irregular shapes of the boxes increase the number of gaps between them.
Figure 4. Example of a gap (for Element a) and a hole (for Element c).
Figure 5. Examples of normal “rigid” boxes (left) and deformable “soft” boxes (middle and right). The example on the right shows the restriction of the deformation, in order to keep the box in a single part.
A deformable “soft” box is made of several rectangular parts, one for each column the box spreads over. Each part has a fixed height and can move vertically independently, to fit to the boxes below it. The vertical movement is allowed as long as the parts of the box remain connected, i.e. the box must remain a single visual entities and cannot be split in two parts. Figure 5 shows examples of the behavior of standard rigid boxes vs deformable “soft” boxes.
C. Interactive rainbow boxes
Interactive rainbow boxes let the user select a subset of the boxes, in order to display them and in particular to visualize and compare their weights. By default, all boxes are unselected. Unselected boxes are grayed and “floating” at the top of the visualization (see Figure 6). Then, the user can select a box by clicking on it. Selected boxes are colored and moved at the bottom of the visualization. They are stacked, using deformable “soft” boxes as detailed above. The boxes at the top and at the bottom are ordered vertically independently from each other, using the standard rules for rainbow boxes (i.e. largest boxes at the bottom). Finally, selected boxes can be deselected by clicking them again. When a box is deselected, it becomes grayed again, and moves back to the top of the visualization.
IV. VISUALIZATION OF THE REASONING OF SIMPLE NEURAL NETWORKS
In this section, we show how we can visualize the reasoning of simple neural networks, with (a) Boolean inputs (the false and true values being represented by 0 and 1, respectively), (b) a positive real output, (c) strictly positive weights, (d) no
Figure 6. Examples of interactive rainbow boxes, before user interaction (left), after the user clicks on the Set B box (middle) and after a second click, on the Set A box (right).
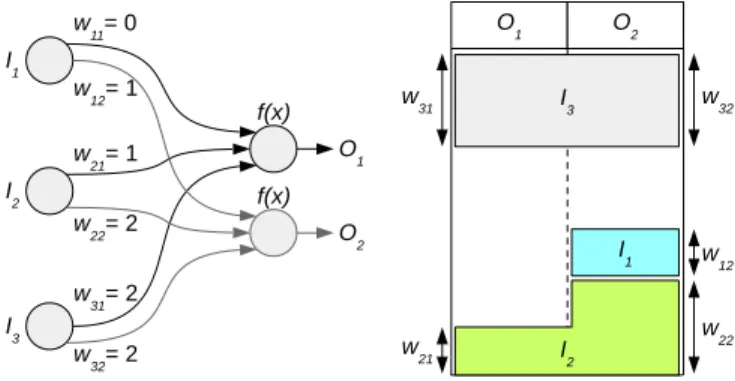
Figure 7. An example of an artificial neural network with 3 inputs and 2 outputs (left) and the corresponding visual representations using interactive non-rectangular weighted rainbow boxes (right), after the user clicked on the I1 and I2boxes to activate the corresponding inputs. Thus, the input vector
visualized is (1, 1, 0).
bias, (e) several output perceptrons but no hidden layer, and (f) a no-op activation function fnoop with fnoop(x) = x.
The visualization of such a neural network can be con-sidered as a set visualization problem, in which the inputs neurons I1,..., Ii,..., In are the sets (i.e. the boxes in rainbow
boxes) and the output O1,..., Oj,..., Omare the elements (i.e.
the columns). For each input, we define the set SIi of the
outputs Ojfor which the weight wij between Iiand Ojis not
zero, i.e. SIi= {Oj : wij 6= 0}. These sets can be represented
using non-rectangular weighted rainbow boxes For a given (Ii,
Oj) pair, the box height is the corresponding weight wij in
the neural network. Figure 7 shows a simple example. Using interactive rainbow boxes, we can make the system dynamic, allowing the user to select the desired boxes. Boxes correspond to inputs, and selected boxes to activated inputs: Ii = 1 if box Ii is selected and Ii = 0 otherwise. By
clicking on boxes, the user can activate or inactivate the corresponding inputs. This allows the user entering the input values interactively. Boxes corresponding to activated inputs are moved at the bottom of the visualization; this allows the visual computation of the weighted sum of the activated inputs, in each column (i.e., for each output). In Figure 7, two inputs have been activated.
Cystitis Prostatitis Pyelo. Child Adult
comp.
I1 I2 I3 I4 I5 First choice Second
choice R1 1 0 0 0 1 nitrofurantoine enoxacine lome-floxacine norfloxacine ofloxacine R2 1 0 0 1 0 nitrofurantoine ceftriaxone R3 1 0 0 0 0 fosfomycine trométamol enoxacine lome-floxacine norfloxacine ofloxacine R4 0 1 0 0 1 ofloxacine levofloxacine R5 0 1 0 1 0 ofloxacine levofloxacine R6 0 1 0 0 0 ofloxacine levofloxacine R7 0 0 1 0 1 ofloxacine levofloxacine R8 0 0 1 1 0 ceftriaxone cefixime R9 0 0 1 0 0 ofloxacine levofloxacine Table I
THE9RULES DERIVED FROM THE ANTIBIOTIC KNOWLEDGE BASE. “ADULT COMP.”STANDS FOR“ADULT WITH RISK OF COMPLICATIONS”.
V. APPLICATIONS TO VISUAL DECISION SUPPORT IN ANTIBIOTHERAPY
In this section, we will present an application in the field of antibiotherapy for urinary infections in primary care. Antibi-otic prescription consists in choosing one antibiAntibi-otic among all the antibiotics which are potentially efficient for treating the infection and safe for the patient (or possibly choosing to not prescribe an antibiotic, e.g. for viral infections). Inappropriate prescriptions increase the risk of complications and favors the emergence of antimicrobial resistance. The optimal treatment depends on the specific indication, i.e. the organ infected (urinary bladder → cystitis, prostate → prostatitis, kidney → pyelonephritis), and the patient profile (normal, child, or adult with risk of complications). We propose an interactive decision support system, in which the physician enters the patient infection type and profile, and obtains the antibiotics recommended in first and second choices.
A. Designing and learning the neural network
In a previous work [16], we built a knowledge base on antibiotic properties. From this knowledge base, we extracted 9 rules for the prescription of antibiotics for urinary infections (Table I). Each rule correspond to a specific indication and a patient profile, and lists the antibiotics recommended in first and second choices. For instance, the first rule states that
Cefixime Ceftriaxone Nitrofurantoin Eno/Lomeflo/Norfloxacin Ofloxacin Le
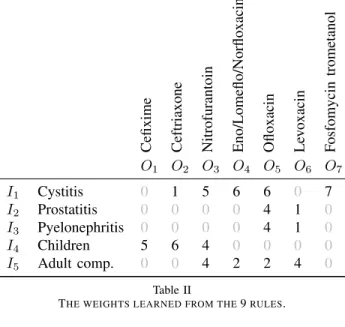
v oxacin F osfomycin trometanol O1 O2 O3 O4 O5 O6 O7 I1 Cystitis 0 1 5 6 6 0 7 I2 Prostatitis 0 0 0 0 4 1 0 I3 Pyelonephritis 0 0 0 0 4 1 0 I4 Children 5 6 4 0 0 0 0 I5 Adult comp. 0 0 4 2 2 4 0 Table II
THE WEIGHTS LEARNED FROM THE9RULES.
Figure 8. The resulting neural network. Weights are given in Table II.
cystitis in adult with risk of complication should be treated by nitrofurantoin or (if not possible) by enoxacine, lomefloxacine, norfloxacine or ofloxacine.
In a second step, we designed a neural network with 5 inputs (corresponding to the 5 conditions considered by the rules in Table I) and 7 outputs (corresponding to the antibiotics in Table I; 3 of them, enoxacine, lomefloxacine and norfloxacine, were grouped together for learning purpose, because they behave identically in Table I). This neural network has 35 (= 5 × 7) weights. In order to guarantee that the weights are visually distinguishable, we used positive integer values for weights. For a given specific indication and patient profile, the neural network compute a score for each antibiotic. The antibiotic with the highest score is the one recommended by the system in first choice, and the second best is the second choice. In case of ex-aequo, several antibiotics are ranked at the same level.
The values of the weights were learned using the Artificial Feeding Bird (AFB) metaheuristic [15]. We minimized both the error rate (compared to the antibiotics recommended by the rules in Table I) and the total sum of weights, in order to limit the visual space needed by the visualization and to maximize the number of 0 in the weights. The 35 weights define a
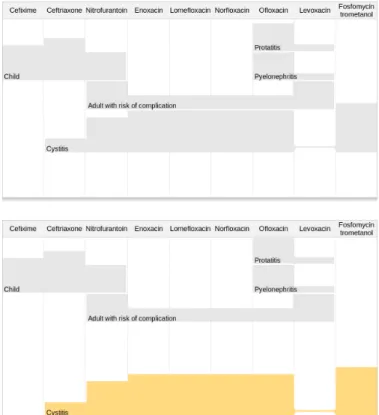
35-Figure 9. Interactive non-rectangular weighted rainbow boxes showing the available antibiotics for urinary infections. The screenshot at the top shows the unselected boxes before user interaction. The bottom screenshot shows the boxes after the user clicked on the “Cystitis” box to select it. Figure 1 shows the boxes after the user clicked on both the “Cystitis” and “Adult with risk of complication” boxes.
dimension space. In this space, a point is a potential solution, represented by the position of a bird in the AFB algorithm. The possible number of solutions is very high (about 2.8×1038
if we consider only weights between 0 and 10); the algorithm tested about 2.6 × 10⁶ solutions and found one with an error rate of 0. Table II shows the resulting weights and Figure 8 the resulting network.
B. Interactive visual decision support application
The resulting decision support application is shown in Figure 9 and 1. Antibiotics are shown in columns, and the patient conditions are shown in non-rectangular boxes. By default, all boxes are inactive, grayed and floating at the top of the screen. Then, the user can click on a box to activate it; activated boxes are colored (in arbitrary colors), moved to the bottom of the screen, and deformed so as they fit with the boxes below them.
By summing the height of the selected boxes in each column, it is possible to compute a score for each an-tibiotic. In this application, higher scores are the best. Therefore, in Figure 9 (bottom), the first-choice antibiotic is fosfomycine-trometanol (highest boxes), and the second-choice are enoxacin, lomefloxacin, norfloxacin and ofloxacin (second highest). In Figure 1, the first-choice is nitrofurantoin
and the second-choice are enoxacin, lomefloxacin, norfloxacin and ofloxacin. The visualization supports the determination of the first and second choice antibiotics according to the patient profile entered by the user, but it also shows visually the contribution of each patient condition in the final result. For example, in Figure 1, it is clear that nitrofurantoin is the first choice due to the “Adult with risk of complications” condition, but it was not the first nor the second choice for cystitis in the general situation. Finally, it also allows answering “what-if” question even before interacting with the system: before the user clicks on a box, he can already see the shape of the box and deduce how it will impact the recommendation of the system. For example, one can see in the grayed boxes that the “Child” condition mainly favors Ceftriaxone, while “Adult with risk of complication” mainly favors Nitrofurantoin and Levoxacin.
VI. DISCUSSION AND CONCLUSION
In this paper, we extended rainbow boxes with irregular boxes, deformable boxes and interactivity, and we showed how these extension allows to translate visually the computation performed by a simple neural network with Boolean input and no hidden level. In particular, the proposed visualization method can be used to compute a score for ranking vari-ous items displayed in the columns of rainbow boxes. We described a decision support application in antibiotherapy.
Many methods exist for training a neural network made of several perceptrons, the most common being back-propagation. However, visual constraints must also be satisfied in addition to the domain constraints, in order to obtain an efficient visualization. The visual constraints here were related to the minimum height of the boxes (in order to display a label), the limited height of the computer screen, the difficulty of the Human vision to compare very similar heights, and the exclusion of negative weights. This is why we used AFB, a more general optimization algorithm than back-propagation, for learning the neural network.
While machine learning was necessary to design the system and learn the weights of the neural network, it is important to notice that, when using the resulting decision support tool, no neural network computation is performed on the computer. Consequently, the proposed approach can be seen as a visual algorithm, i.e. an algorithm specifically “compiled” for been “executed” by the human vision. Human vision is known to be very efficient, and highly parallel, at least for some specific task [17]. In our previous works, we proposed similar visual algorithms for the perceptron [4], but also for a specifically-designed case-based reasoning algorithm [18]. These examples illustrate two possible approaches for designing visual algo-rithms: either translating visually an existing formal reasoning, or design a new and specific formal reasoning that takes into account visual constraints and requirements. This is quite different from the visual algorithm simulation described in the literature [19], and consisting in visual simulation of
algorithms for teaching purpose. It is closer to a formalized form of visual reasoning.
Another possibility for extending interactivity in rainbow boxes would be to let the user adjust the height of the boxes (and thus the weight of the inputs). This would provide a mean for the user to specify his personal preferences, for example by increasing or decreasing the weight associated to a given input. In the antibiotherapy application, evidence-based medical recommendations must be followed and thus it does not really make sense to adjust the weights. However, in a different application, it can be an interesting option.
The main limitation of this work is the low complexity and size of the presented neural network (5 inputs and 7 outputs). In addition, usual limitations of neural networks with no hidden level apply, notably the well-known impossibility to perform exclusive-or and solve non-linear problem. However, while the complexity and the learning abilities of simple neural networks are far beyond the capabilities of deep learning with many perceptrons and layers, simple neural networks can still be sufficient for solving some real-world problems, even in complex domains like medicine. Moreover, these simple network can be fully explained visually, as we showed here. In the literature, stacked bar charts were proposed to explain linear models [20]. In the future, we plan to work on more complex networks.
Another limitation is the presence of gaps and holes in boxes, which complicate the visual computation of the output value, because in these cases the boxes are not tightly stacked. However, at least when a single hole or gap is involved, this does not totally prevent the visual comparison of the output values. Moreover, deformable “soft” boxes (section III-B) reduce the impact of gaps.
We also restricted our work to neural network with real output and not activation function. However, our work could easily be adapted to networks with Boolean output and a threshold activation function, by showing an horizontal line behind boxes, as we proposed previously with the perceptron. Compared to our previous work in antibiotherapy [4], using a single perceptron, the proposed decision support tool does not describe the properties of each antibiotic, but it is able to manage several clinical situations. On the contrary, in the previous one, a given visualization was restricted to a single clinical situation (e.g. cystitis in child).
The main perspectives of this work are following: (1) test our approach on bigger neural network, (2) evaluate these decision support applications with users, e.g. through user study or case studies, (3) extend the proposed approach to more complex neural networks, e.g. with one hidden level, and (4) explore the ability to let the user adjust the box height for taking into account user preferences.
ACKNOWLEDGEMENTS
This work was funded by the French drug agency (ANSM, Agence Nationale de Sécurité du Médicament et des produits
de santé) through the RaMiPa project (AAP-2016).
REFERENCES
[1] Abraham A, Handbook of Measuring System Design. John Wiley & Sons, 2005, ch. Artificial neural networks.
[2] R. Tsopra, A. Venot, and C. Duclos, “An algorithm using twelve properties of antibiotics to find the recommended antibiotics, as in CPGs ,” in AMIA Annu Symp Proc, vol. 1115-24, 2014.
[3] O. Biran and C. Cotton, “Explanation and justification in machine learning: A survey,” in Workshop on Explainable AI (XAI), 2017, pp. 8–13.
[4] J. B. Lamy and R. Tsopra, “Translating visually the reasoning of a perceptron: the weighted rainbow boxes technique and an application in antibiotherapy,” in International Conference Information Visualisation (iV), London, United Kingdom, 2017, pp. 256–261.
[5] J. B. Lamy, H. Berthelot, C. Capron, and M. Favre, “Rainbow boxes: a new technique for overlapping set visualization and two applications in the biomedical domain,” Journal of Visual Language and Computing, vol. 43, pp. 71–82, 2017.
[6] J. B. Lamy, H. Berthelot, and M. Favre, “Rainbow boxes: a technique for visualizing overlapping sets and an application to the comparison of drugs properties,” in International Conference Information Visualisation (iV), Lisboa, Portugal, 2016, pp. 253–260.
[7] F. M. Hohman, M. Kahng, R. Pienta, and D. H. Chau, “Visual Analytics in Deep Learning: An Interrogative Survey for the Next Frontiers,” IEEE transactions on visualization and computer graphics, 2019.
[8] C. Olah, A. Satyanarayan, I. Johnson, S. Carter, L. Schubert, K. Ye, and A. Mordvintsev, “The building blocks of interpretability,” Distill, vol. 3, no. 3, p. e10, 2018.
[9] M. A. Migut, M. Worring, and C. J. Veenman, “Visualizing multi-dimensional decision boundaries in 2D,” Data Mining and Knowledge Discovery, vol. 29, no. 1, pp. 273–295, 2015.
[10] F. C. M. Rodrigues, R. Hirata Jr, and A. C. Telea, “Image-based visualization of classifier decision boundaries,” in Proc. SIBGRAPI, vol. in press, 2018.
[11] M. Espadoto, F. C. M. Rodrigues, and A. C. Telea, “Visual analytics of multidimensional projections for constructing classifier decision bound-ary maps,” in International Joint Conference on Computer Vision, Imag-ing and Computer Graphics Theory and Applications (VISIGRAPP), vol. 3, 2019, pp. 28–38.
[12] E. M. Smith, J. Smith, P. Legg, and S. Francis, “Visualising state space representations of LSTM networks,” in Workshop on Visualization for AI Explainability (VISxAI), 2018.
[13] M. Li, Z. Zhao, and C. Scheidegger, “Visualizing neuron activations of neural networks with the grand tour,” in Workshop on Visualization for AI Explainability (VISxAI), 2018.
[14] R. Sevastjanova, F. Beck, B. Ell, C. Turkay, R. Henkin, M. Butt, D. Keim, and M. El-Assady, “Going beyond visualization: Verbalization as complementary medium to explain machine learning models,” in Workshop on Visualization for AI Explainability (VISxAI), 2018. [15] Lamy JB, Advances in nature-inspired computing and applications.
Springer, 2019, ch. Artificial Feeding Birds (AFB): a new metaheuristic inspired by the behavior of pigeons, pp. 43–60.
[16] R. Tsopra, J. B. Lamy, and K. Sedki, “Using preference learning for detecting inconsistencies in clinical practice guidelines: methods and application to antibiotherapy,” Artif Intell Med, vol. 89, pp. 24–33, 2018. [17] Ware C, Visual thinking for design. Burlington, USA: Morgan
Kaufmann, 2008.
[18] J. B. Lamy, B. Sekar, G. Guezennec, J. Bouaud, and B. Séroussi, “Explainable artificial intelligence for breast cancer: a visual case-based reasoning approach,” Artif Intell Med, vol. 94, pp. 42–53, 2019. [19] Korhonen A, “Visual algorithm simulation,” Ph.D. dissertation, Helsinki
University of Technology, 2003.
[20] S. Gratzl, A. Lex, N. Gehlenborg, H. Pfister, and M. Streit, “Lineup: Visual analysis of multi-attribute rankings,” IEEE transactions on visu-alization and computer graphics, vol. 19, no. 12, pp. 2277–2286, 2013.