O
pen
A
rchive
T
oulouse
A
rchive
O
uverte (
OATAO
)
OATAO is an open access repository that collects the work of Toulouse researchers and
makes it freely available over the web where possible.
This is an author-deposited version published in:
http://oatao.univ-toulouse.fr/
Eprints ID:
3875
To link to this article:
DOI: 10.1039/b916940g
URL:
http://dx.doi.org/10.1039/b916940g
To cite this version: Li, Gao-Ren and Qu, Dun-Lin and Wang, Zi-Long and
Su, Cheng-Yong and Tong, Ye-Xiang and Arurault, Laurent ( 2009) Ceria–
terbia solid solution nanobelts with high catalytic activities for CO
oxidation. Chemical Communications,
n° 48. pp. 7557-7559. ISSN
1359-7345
Any correspondence concerning this service should be sent to the repository
administrator:
[email protected]
Ceria–terbia solid solution nanobelts with high catalytic activities
for CO oxidation
w
Gao-Ren Li,*
aDun-Lin Qu,
aZi-Long Wang,
aCheng-Yong Su,
aYe-Xiang Tong*
aand
Laurent Arurault
bDOI: 10.1039/b916940g
Ceria–terbia solid solution nanobelts were prepared by an electrochemical route and tested as catalysts of high activity for CO oxidation.
Air pollution has become one of the major global problems. Three-way catalysts (TWC) for automotive exhaust treatment, which can transform three environmentally hazardous gases, namely, CO, NOx, and hydrocarbons to environmentally benign or less hazardous form, is therefore a topic of intensive research.1–5 Ceria-based materials are very important components of promoters for automotive TWCs.6–9It is well known that rare earth ion-doped ceria can increase the ionic conductivities,10 and therefore may generally enhance the catalytic activity of ceria by making oxygen from the bulk more accessible for surface reactions.11
As is well known, Ce4+and Ce3+always coexist in CeO2. 12
The ionic radius of Ce3+ion (1.14 A˚) is larger than that of
Ce4+ion (0.97 A˚) and so the surrounding fluorite lattice will
be distorted when Ce3+vacancies are formed in CeO2. When
different +4 cations are doped into the CeO2 lattice, the
oxygen diffusivity within the lattices will be influenced. The energetic cost of these distortions in CeO2can be decreased by
formation of solid solutions with 4+ ions of smaller size than Ce4+ions, such as Zr4+, Hf4+, Pr4+, Tb4+.11–15In addition, the ion mobility inside the CeO2 lattice will be changed,
resulting in the formation of a defective fluorite-structured solid solution. Such modifications in the defect structure of CeO2will confer new properties to the catalyst such as high
catalytic activity.16 The use of variable valence dopants in CeO2 has attracted much attention.17–18 Herein, special
emphasis is given on the influence of Tb4+ doping on the catalytic performance of ceria-based mixed oxides. The element Tb can exhibit variable valence states (3+ and 4+), which may have some special impact on the final product.
Constructing novel nanostructures to obtain enhanced properties appears a viable route in designing and selecting catalysts and catalyst promoters for specific catalytic reactions.19,20 CeO2-based composites with nanostructures
usually have high surface areas, improved sintering properties and high oxygen storage capacities, which may highly enhance the catalytic performance. To the best of our knowledge, there have been no reports on the successful synthesis of one-dimensional ceria-based mixed oxide nanobelts. Herein, detached Ce1 xTbxO2 d nanobelts are first synthesized by
electrochemical deposition at room temperature and usual atmospheric pressure without any surface-capping agent. The Ce1 xTbxO2 dnanobelts as a new family of CeO2-based
oxide nanostructures are desirable because of their unique physical and chemical properties.11 The electrochemical deposition is a simple and low-cost route to this material.
In this experiment a simple three-electrode cell was used. A highly pure Pt foil (99.99 wt%, 0.25 cm2) was used as the
auxiliary electrode. A saturated calomel electrode (SCE) was used as the reference electrode that was connected to the cell with a double salt bridge system. The electrochemical deposition was carried out in a solution of 0.01 M Ce(NO3)3+ 0.001 M
Tb(NO3)3 + 0.1 M NH4NO3 with a current density of
4.0 mA cm 2 in a configured glass cell at room temperature,
in which a Cu plate (99.99 wt%, 0.25 cm2) served as the substrate. The oxygen was dissolved in the deposition solution through bubbling in the electrolyte. Before electrodeposition, the Cu substrate was cleaned ultrasonically in 0.1 M HCl, distilled water, and acetone and then rinsed in distilled water again. The products were characterized by X-ray diffractometry (D/MAX 2200 VPC with Cu-Ka radiation), and an Oxford Instruments INCA energy-dispersive spectrometer (EDS) was employed to analyze chemical composition. Microstructures of the deposits were characterized by field emission scanning electron microscopy (FE-SEM; JSM-6330-F) and X-ray photo-electron spectroscopy (XPS, ESCALAB 250) was used to assess the chemical state and surface composition of the deposits.
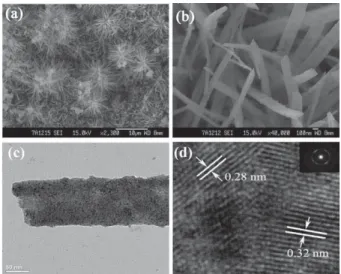
SEM images of Ce1 xTbxO2 d composites with different
magnifications are shown in Fig. 1(a) and (b), which reveal that the deposit consists of a large quantity of nanobelts with length of about 0.5–2.0mm, width of 100–250 nm and thickness of only about 30 nm. The microstructural details of Ce1 xTbxO2 d
nanobelts were further investigated by TEM as shown in Fig. 1(c) and (d). High-resolution TEM (HRTEM) images of individual nanobelts clearly display lattice fringes for nano-crystals, indicating that these Ce1 xTbxO2 d nanobelts possess
high crystallinity. The measured interplanar spacings from HRTEM are about 0.31 and 0.28 nm, which are in good agreement with (111) and (200) facet distances of the CeO2phase,
respectively. The SAED pattern (inset in Fig. 1(d)) indicates that the prepared nanobelts have a polycrystalline structure.
a
MOE Laboratory of Bioinorganic and Synthetic Chemistry/School of Chemistry and Chemical Engineering/Institute of Optoelectronic and Functional Composite Materials, Sun Yat-Sen University,
Guangzhou 510275, P. R. China.
E-mail: [email protected], [email protected]; Fax: 86-20-84112245; Tel: 86-20-84110071
bCIRIMAT-LCMIE, Universite´ Paul Sabatier, 31062 Cedex 9, France
w Electronic supplementary information (ESI) available: Catalytic activity measurements; characterization; EDS pattern; XPS spectrum; SEM images; TG curves. See DOI: 10.1039/b916940g
A representative EDS pattern of Ce1 xTbxO2 dnanobelts is
shown in Fig. S1 (ESIw) which revealed O, Ce and Tb to be present. The content of Tb in Ce1 xTbxO2 dcomposites was
determined to be about 6.5 at.%, and the Ce content is about 93.5 at.%. XPS analyses of Ce1 xTbxO2 d nanobelts were
carried out and the O 1s core level XPS profile is shown in Fig. S2 (ESIw). The peak centered at 530.1 eV corresponds to the O2 contribution, and can be attributed to the lattice oxygen associated with Ce1 xTbxO2 d. Another peak at a
slightly lower binding energy side can be attributed to absorbed oxygen species (presumably from absorbed water). It is well known that a small amount of Ce3+coexists at the surface of CeO2.
21
Two sets of spin–orbit multiplets corres-ponding to 3d3/2and 3d5/2are present as peaks labelled u and v,
respectively in Fig. 2(a). The peaks centered at 899.0 eV (u1),
908.3 eV (u2) and 917.1 eV (u3) eV can be attributed to the
Ce4+ contribution while the peaks centered at 884.2 eV (v1)
and 902.2 eV (v2) can be attributed to the Ce3+contribution.
Thus, the surface of the present samples contains Ce both in the 4+ and the 3+ states. Fig. 2(b) shows the Tb 4d spectrum of a Ce1 xTbxO2 dnanobelt sample. As the kinetic energies of
the photoemitted electrons are very low, Tb 3d core level analysis is very difficult by a conventional laboratory spectrometer (with either Mg or Al KR radiation). Thus the most intense core level (Tb 4d) is used for analysis. There is an agreement that Tb3+
gives a signal below 150 eV and Tb4+is
related to features well above 150 eV.22–24 The spectrum in Fig. 2(b) obviously shows a pronounced shoulder below 150 eV, a maximum at 152.3 eV and a tailing toward 160 eV, indicating the presence of more than one oxidation state, i.e., the 3+ and the 4+ oxidation states. Therefore, the XPS results further demonstrated Ce1 xTbxO2 d composites were successfully
synthesized.
Fig. 3(a) shows the XRD pattern of as-prepared Ce1 xTbxO2 d(x = 6.5 at.%) nanobelts. Peaks corresponding
to CeO2(111), (200), (220) and (311) planes were observed,
indicating a face-centered cubic-phase CeO2(JCPDS 34-0394).
The diffraction peaks of TbO2or Tb2O3were not observed,
indicating Tb has entered into the CeO2lattice. The calculated
cell parameter (a) is equal to 0.5378 nm, a little smaller than that of bulk CeO2(0.5411 nm). This may be due to a lattice
constriction effect resulting from Tb4+ ions as Tb4+ has a
smaller ionic radius than that of Ce4+(the ionic radii values for Ce4+, Tb4+, Ce3+ and Tb3+ are 0.97, 0.88, 1.14 and 1.04 A˚, respectively).25The lattice constriction is additional evidence for the formation of solid solutions. The broadening of the reflections of Ce1 xTbxO2 dnanobelts in Fig. 3(a) can
be attributed to the smaller nanocrystallites. The average crystallite sizes of Ce1 xTbxO2 d nanobelts were calculated
from X-ray line broadening of the (111) reflection using Scherrer’s equation (D = Kl/(bcos y), where l is the wave-length of the X-ray radiation, K is a constant, y is the diffraction angle, and b is the full width at half-maximum). The average crystallite size of Ce1 xTbxO2 dnanobelts was
determined to be about 5.5 nm. The peak shift of CexTb1 xO2 d(x = 6.5 at.%) nanobelts compared with pure
CeO2 can be estimated as about 0.41. The XRD pattern of
Ce1 xTbxO2 d nanobelts calcined at 1100 K are shown in
Fig. 3(b). The same monophasic composition is retained, and no phase segregation is observed.
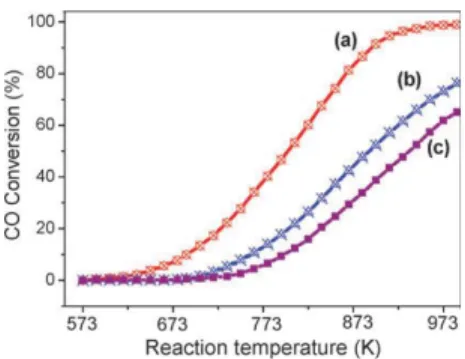
The catalytic activity of the Ce1 xTbxO2 d(x = 6.5 at.%)
nanobelts was investigated by performing the CO conversion reaction. Fig. 4 shows the catalytic activities of Ce1 xTbxO2 d
nanobelts, nanoparticles and nanosheets (all x = 6.5 at.%) as a function of reaction temperature (the surface areas of CexTb1 xO2 d nanobelts, nanosheets and nanoparticles are
about 115, 72 and 23 m2g 1, respectively). It can be clearly observed the CO conversion increases with increasing reaction temperature for all samples. For Ce1 xTbxO2 dnanobelts as
catalyst, a 96% CO conversion is achieved at about 913 K. However, only 43 and 57% CO conversions are obtained at
Fig. 1 SEM images of (a) low magnification and (b) high magnification;
(c) TEM image; (d) HRTEM image; and SAED (inset) of Ce1 xTbxO2 d
nanobelts prepared in solution of 0.01M Ce(NO3)3 + 0.001 M
Tb(NO3)3+ 0.1M NH4NO3with current density of 4.0 mA cm 2.
Fig. 2 (a) Ce 3d and (b) Tb 4d core level spectra of Ce1 xTbxO2 d
nanobelts.
Fig. 3 XRD patterns of the obtained samples: (a) as-prepared
Ce1 xTbxO2 d nanobelts; (b) Ce1 xT xO2 d nanobelts calcined at
the same temperature for Ce1 xTbxO2 d nanoparticles and
nanosheets as catalysts, respectively. (SEM images of Ce1 xTbxO2 d nanoparticles and nanosheets are shown in
Fig. S3 and Fig. S4, ESI,wrespectively) Therefore, the catalytic activity of Ce1 xTbxO2 dnanobelts is much higher than those
of Ce1 xTbxO2 dnanoparticles and nanosheets. Interestingly,
a significant lowering of the starting reduction temperature is noticed for Ce1 xTbxO2 d nanobelts compared to
Ce1 xTbxO2 dnanoparticles and nanosheets.
Since the components of Ce1 xTbxO2 ddeposits were kept the
same, the above different catalytic activities must originate from the different structures that have different oxygen storage capacities (OSCs). As is well known, the value of OSC is a crucial parameter for catalytic activity. Herein, the OSC properties of Ce1 xTbxO2 d nanobelts, nanoparticles and nanosheets were
tested by oxygen release characteristics of the samples calcined at different temperatures under dry air atmosphere in the temperature range 450–1100 K. The change of weight of the sample was monitored by thermogravimetry (TG) under cyclic heat treatments in flowing air. Ce1 xTbxO2 d samples were
subjected to consecutive cycles of heating and cooling, and typical TG curves of various samples were shown in Fig. S5 (ESIw). In the above results, a large decrease of weight was observed in the first heat treatment (A- B) and this can be attributed to the release of both water molecules and oxygen from Ce1 xTbxO2 dsolid solutions. In the cooling back stage
(B - C), a partial recovery of the weight of Ce1 xTbxO2 d
sample was observed. In the second heating cycle (C- B), a small decrease of weight was also observed corresponding to the potential oxygen release capacity of the powders in ordinary air atmosphere.12 The Ce
1 xTbxO2 d nanobelts show the highest
weight loss, which is followed by Ce1 xTbxO2 dnanosheets and
nanoparticles. Accordingly the Ce1 xTbxO2 d nanobelts have
the highest OSC among various Ce1 xTbxO2 dnanostructures.
These results are consistent with the catalytic activity order of CO oxidation, where Ce1 xTbxO2 dnanobelts showed better
activity than that of Ce1 xTbxO2 d nanosheets, followed by
Ce1 xTbxO2 dnanoparticles.
In summary, a novel design of ceria–terbia solid solution nanobelts led to catalysts of high activity for CO oxidation. Ce1 xTbxO2 dnanobelts (x = 6.5 at.%) have been synthesized
by electrochemical deposition at room temperature and ordinary atmospheric pressure without any surface capping agent. The electrochemical deposition route shows a facile and low-cost route. The results of XRD and TEM show
Ce1 xTbxO2 dnanobelts are well crystallized and have a cubic
structure. A strong shape/crystal structure effect of Ce1 xTbxO2 dcomposites for the catalytic activity has been
identified. The Ce1 xTbxO2 dnanobelts are most active for the
CO conversion reaction compared with Ce1 xTbxO2 d
nano-particles and nanosheets. The high catalytic activity of Ce1 xTbxO2 d nanobelts can be attributed to the special
nanostructures with high OSC. These findings can be extended to new studies of other ceria-based mixed oxides with high surface areas.
This work was supported by NSFC (20603048, 20873184 and 90923008) and Guangdong Province (2008B010600040 and 9251027501000002).
Notes and references
1 J. Kasˇpar, P. Fornasiero and M. Graziani, Catal. Today, 1999, 50, 285–298.
2 H. S. Gandhi, G. W. Graham and R. W. McCabe, J. Catal., 2003, 216, 433–442.
3 J. Kasˇpar, P. Fornasiero and N. Hickey, Catal. Today, 2003, 77, 419–449.
4 M. Yang, M. Shen, J. Wang, J. Wen, M. Zhao, J. Wang and W. Wang, J. Phys. Chem. C, 2009, 113, 12778–12789.
5 W. Wang, P. Lin, Y. Fu and G. Cao, Catal. Lett., 2002, 82, 19–27. 6 G. Kim, Ind. Eng. Chem. Prod. Res. Dev., 1982, 21, 267–274. 7 N. Hickey, P. Fornasiero, R. Di Monte, J. Kasˇpar, J. R.
Gonza´lez-Velasco, M. A. Gutie´rrez-Ortiz, M. P. Gonza´lez-Marcos,
J. M. Gatica and S. Bernal, Chem. Commun., 2004, 196–197. 8 B. M. Reddy, P. Bharali, P. Saikia, A. Khan, S. Loridant, M. Muhler
and W. Gru¨nert, J. Phys. Chem. C, 2007, 111, 1878–1881. 9 M. Shen, M. Yang, J. Wang, J. Wen, M. Zhao and W. Wang,
J. Phys. Chem. C, 2009, 113, 3212–3221.
10 (a) H. Yahiro, K. Eguchi and H. Arai, Solid State Ionics, 1989, 36, 71; (b) K. Eguchi, T. Setoguchi, T. Inoue and H. Arai, Solid State Ionics, 1992, 52, 165.
11 G. Zhou and R. J. Gorte, J. Phys. Chem. B, 2008, 112, 9869–9875.
12 Be. M. Reddy, P. Lakshmanan, P. Bharali, P. Saikia,
G. Thrimurthulu, M. Muhler and W. Gru1nert, J. Phys. Chem. C, 2007, 111, 10478–10483.
13 Q. Yuan, Q. Liu, W.-G. Song, W. Feng, W.-L. Pu, L.-D. Sun, Y.-W. Zhang and C.-H. Yan, J. Am. Chem. Soc., 2007, 129, 6698. 14 (a) W. Chun, G. W. Graham, J. A. Lupescu, R. W. McCabe, M. M. Koranne and R. Brezny, Catal. Lett., 2006, 106, 95; (b) M. Y. Sinev, G. W. Graham, L. P. Haack and M. Shelef, J. Mater. Res., 1996, 11, 1960.
15 B. M. Reddy, P. Bharali, P. Saikia, S.-E. Park, M. W. E. van den Berg, M. Muhler and W. Gru¨nert, J. Phys. Chem. C, 2008, 112, 11729. 16 (a) S. Bernal, G. Blanco, M. A. Cauqui, M. P. Corchado,
C. Larese, J. M. Pintado and J. M. Rodr´ıguez-Izquierdo, Catal. Today, 1999, 53, 607–612; (b) S. Bernal, G. Blanco, M. A. Cauqui, P. Corchado, J. M. Pint-ado and J. M. Rodrı´guez-Izquierdo, Chem. Commun., 1997, 1545–1546.
17 G. Blanco, J. J. Calvino, M. A. Cauqui, P. Corchado, C. Lo´pez-Cartes, C. Colliex, J. A. Pe´rez-Omil and O. Stephan, Chem. Mater., 1999, 11, 3610–3619.
18 (a) X. Wang, J. C. Hanson, G. Liu, J. A. Rodriguez, A. Iglesias-Juez and M. Ferna´ndez-Garcı´a, J. Chem. Phys., 2004, 121, 5434; (b) X. Wang and R. J. Gorte, Appl. Catal., A, 2003, 247, 157–162. 19 F. Zhang, S.-W. Chan, J. E. Spanier, E. Apak, Q. Jin, R. D. Robinson and I. P. Herman, Appl. Phys. Lett., 2002, 80, 127. 20 J. Rodriguez, J. C. Hanson, J.-Y. Kim and G. Liu, J. Phys. Chem.
B, 2003, 107, 3535.
21 Z. Wang, Z. Quan and J. Lin, Inorg. Chem., 2007, 46, 5237. 22 H. X. Dai, C. F. Ng and C. T. Au, J. Catal., 2001, 199, 177.
23 G. Blanco, J. M. Pintado, S. Bernal, M. A. Cauqui,
M. P. Corchado, A. Galtayries, J. Ghijsen, R. Sporken, T. Eickhoff and W. Drube, Surf. Interface Anal., 2002, 34, 120. 24 L. Li, Q. Wei, H. Li, D. Zhang and W. Z. Su, Phys. B, 1995, 96, 451. 25 A. B. Hungria, A. M. Arias, M. F. Garcia, A. I. Juez, A. G. Ruiz, J. J. Calvino, J. C. Conesa and J. Soria, Chem. Mater., 2003, 15, 4309.
Fig. 4 Conversion of CO over (a) Ce1 xTbxO2 d nanobelts,
(b) Ce1 xTbxO2 d nanosheets and (c) Ce1 xTbxO2 dnanoparticles