HAL Id: hal-02973457
https://hal.uca.fr/hal-02973457
Submitted on 12 Nov 2020
HAL is a multi-disciplinary open access archive for the deposit and dissemination of sci-entific research documents, whether they are pub-lished or not. The documents may come from teaching and research institutions in France or abroad, or from public or private research centers.
L’archive ouverte pluridisciplinaire HAL, est destinée au dépôt et à la diffusion de documents scientifiques de niveau recherche, publiés ou non, émanant des établissements d’enseignement et de recherche français ou étrangers, des laboratoires publics ou privés.
African Rift
Doudou Batumbo Boloweti, Patrick Giraudoux, Catherine Deniel, Emmanuel
Garnier, Frederic Mauny, Celestin Mahinda Kasereka, Roger Kizungu, Jean
Jacques Muyembe, Didier Bompangue, Gudrun Bornette
To cite this version:
Doudou Batumbo Boloweti, Patrick Giraudoux, Catherine Deniel, Emmanuel Garnier, Frederic Mauny, et al.. Volcanic activity controls cholera outbreaks in the East African Rift. PLoS Ne-glected Tropical Diseases, Public Library of Science, 2020, 14 (8), pp.e0008406. �10.1371/jour-nal.pntd.0008406�. �hal-02973457�
RESEARCH ARTICLE
Volcanic activity controls cholera outbreaks in
the East African Rift
Doudou Batumbo Boloweti1, Patrick Giraudoux
ID2, Catherine Deniel3,
Emmanuel Garnier4, Frederic Mauny5, Celestin Mahinda Kasereka6, Roger Kizungu7, Jean Jacques Muyembe8, Didier Bompangue9, Gudrun Bornette
ID10*
1 UMR CNRS 6249 Chrono-Environnement, University of Bourgogne Franche Comte´, Besanc¸on, France, 2 UMR CNRS 6249 Chrono-Environnement, University of Bourgogne Franche Comte´, Besanc¸on, France, 3 UMR CNRS 6524 Laboratoire Magmas et Volcans, University of Blaise Pascal-CNRS-IRD, Clermont
Ferrand, France, 4 UMR CNRS 6249 Chrono-Environnement, University of Bourgogne Franche Comte´, Besanc¸on, France, 5 UMR CNRS 6249 Chrono-Environnement, University of Bourgogne Franche Comte´, Besanc¸on, France, 6 Volcano Observatory of Goma (VOG), Goma, Democratic Republic of Congo,
7 Faculty of Agronomy, University of Kinshasa, Kinshasa, Democratic Republic of Congo, 8 Department of
Microbiology, Faculty of Medicine, University of Kinshasa, Kinshasa, Democratic Republic of Congo, 9 UMR CNRS 6249 Chrono-Environnement, University of Bourgogne Franche Comte´, Besanc¸on, France, 10 UMR CNRS 6249 Chrono-Environnement, University of Bourgogne Franche Comte´, Besanc¸on, France
*gudrun.bornette@univ-fcomte.fr
Abstract
We hypothesized that Cholera (Vibrio cholerae) that appeared along Lake Kivu in the African Rift in the seventies, might be controlled by volcano-tectonic activity, which, by increasing surface water and groundwater salinity and temperature, may partly rule the water characteristics of Lake Kivu and promote V. cholerae proliferation. Volcanic activity (assessed weekly by the SO2flux of Nyiragongo volcano plume over the 2007–2012 period)
is highly positively correlated with the water conductivity, salinity and temperature of the Kivu lake. Over the 2007–2012 period, these three parameters were highly positively corre-lated with the temporal dynamics of cholera cases in the Katana health zone that border the lake. Meteorological variables (air temperature and rainfall), and the other water characteris-tics (namely pH and dissolved oxygen concentration in lake water) were unrelated to cholera dynamics over the same period. Over the 2016–2018 period, we sampled weekly lake water salinity and conductivity, and twice a month vibrio occurrence in lake water and fish. The abundance of V. cholerae in the lake was positively correlated with lake salinity, tempera-ture, and the number of cholera cases in the population of the Katana health zone. V.
cho-lerae abundance in fishes was positively correlated with V. chocho-lerae abundance in lake
water, suggesting that their consumption directly contaminate humans. The activity of the volcano, by controlling the physico-chemical characteristics of Lake Kivu, is therefore a major determinant of the presence of the bacillus in the lake. SO2 fluxes in the volcano plume can be used as a tool to predict epidemic risks.
a1111111111 a1111111111 a1111111111 a1111111111 a1111111111 OPEN ACCESS
Citation: Batumbo Boloweti D, Giraudoux P, Deniel C, Garnier E, Mauny F, Kasereka CM, et al. (2020) Volcanic activity controls cholera outbreaks in the East African Rift. PLoS Negl Trop Dis 14(8): e0008406.https://doi.org/10.1371/journal. pntd.0008406
Editor: Elsio Wunder, Jr, Yale University Yale School of Public Health, UNITED STATES
Received: August 27, 2019 Accepted: May 21, 2020 Published: August 10, 2020
Copyright:© 2020 Batumbo Boloweti et al. This is an open access article distributed under the terms of theCreative Commons Attribution License, which permits unrestricted use, distribution, and reproduction in any medium, provided the original author and source are credited.
Data Availability Statement: All relevant data are within the manuscript and its Supporting Information files.
Funding: The author(s) travels were partly funded by a CNRS Programme Interdisciplinaire Collaboratif Scientifique, France, which also contributed to support some of the measures (measures of physico-chemical characteristics and cholera occurrence in water and fishes over the second survey). The measures were also partly found by the Health ministery of the Democratic
Author summary
The area of the African Great Lakes has been an endemic area for cholera since the late 1970s. We focused on the Katana health zone, bordering Lake Kivu, as during outbreaks, this is, (together with the Kalemie health zone located along the west coast of the Tangan-yika lake) the health zone in which the first cases of Cholera are usually observed, and the highest number of cases are also usually reached in this area. The persistence of this aquatic bacillus, usually associated with warm and salty waters, led us to formulate the hypothesis that the geothermal springs supplying Lake Kivu, mainly from the Nyiragongo volcano, should control the physico-chemical characteristics of the lake and promote the persistence of the bacillus. The lake would thus be a reservoir of the pathogen, which could contaminate local residents through the consumption of water and fish. Over the 2007–2012 period, we demonstrated a long-term unidirectional relationship between vol-canic activity and cholera cases in the Katana health Zone. Contamination of the lake’s water and fish was also correlated to the lake characteristics. The activity of the volcano can thus be used for predicting epidemic risks.
Introduction
Cholera is a severe infectious disease caused byVibrio cholerae. This bacillus thrives in alkaline
saline aquatic environments with high temperatures and rich in organic matter and plankton [1–6]. The bacillus is found in coastal areas, where fresh water from rivers mixes with salt water from the sea [1,2,7–10]. Contamination frequently occurs via the consumption of water, fish, and other foods containing cholera bacilli [11–13]. The disease was introduced to continental Africa in 1970, during the seventh pandemic. It became endemic far from coastal areas, particularly in the Lake Chad basin and the Great Lakes region [14–16]. The Great Lakes are highly suspected of being reservoirs for the cholera bacillus, while human infection and movement are considered to propagate the disease inland [17]. However, studies have failed to identify the physico-chemical parameters of the lakes or/and socio-anthropological conditions that may explain cholera persistence [18,19]. A significant role of meteorology has been found, with rainfall increasing the number of cholera cases, e.g., in Kivu province, but without excluding the role of population movements [20].
Tectonic and volcanic activities are strongly coupled in the Kivu area of the Rift (Fig 1). Indeed, Lake Kivu is located in the western branch of the East African Rift, south of the Nyira-gongo and Nyamuragira volcanoes. Volcanic plumes from these very active, strongly alkaline volcanoes produce very large amounts of acidic gases and ash, which have significant direct and indirect impacts on lake surface water via interactions between acidic rain and rocks that modify the physico-chemical characteristics of rivers and groundwaters before they reach Lake Kivu [21–26]. In addition, sub-groundwaters clearly originating from hydrothermal sources linked to the major NE-SW fault system between the Nyiragongo crater and Lake Kivu also discharge into the lake [22,27–29]. Especially in the north-western region and Kabuno Bay, Lake Kivu is supplied by hydrothermal sub-groundwaters from a deep contiguous geothermal reservoir associated with major faults [29,30].
Volcano-tectonic activity, by controlling the salinity and/or temperature of both streams and groundwaters that feed the lake, might control the salinity and temperature of the lake, the occurrence ofVibrio in water and fish, and cholera dynamics. To test this hypothesis, we used
2 data sets. Firstly, using 6 years of data collected weekly from 2007 to 2012, we modelled the statistical relationships between the long-term dynamics of cholera cases in the Katana health
Republic of the Congo. The funders had no role in study design, data collection and analysis, decision to publish, or preparation of the manuscript.
Competing interests: The authors have declared that no competing interests exist.
zone and 1) the intensity of the volcanic activity, assessed through the SO2flux measured in
the Nyiragongo plume; 2) rainfall and air temperature; and 3) the physico-chemical character-istics of the surface water of Lake Kivu, including temperature and salinity, which are usually considered to be the main parameters controllingVibrio growth. Second, using 2 years of data
collected in 2016 and 2017, we modelled the relationships between the temperature and salin-ity of the lake water,Vibrio occurrence and abundance in the lake (water and fish), and the
number of cholera cases in the Katana health zone, which borders the lake close to the Nyira-gongo volcano.
Materials and methods
Study area and data
The Katana Health Zone is located in Kabare territory, in South Kivu province, in the eastern part of the Democratic Republic of Congo (DRC) (Fig 1). It covers the territory located along the west and north coast of Lake Kivu, together with the islands of the lake. The Katana health zone was selected because it was one of the first zones affected by cholera in 1978 in the rift val-ley. Furthermore, the Katana health zone is (together with the Kalemie health zone located along the west coast of the Tanganyika lake), the health zone in which the first cases of Cholera are usually observed, and the highest number of cases are also usually reached in this area [31]. Lake Kivu is supplied by many hydrothermal groundwater springs and highly mineralized riv-ers [30,32,33]. The northern basin of the lake is located at the end of a deep, major NE-SW fracture zone originating at the Nyiragongo crater and closely associated with volcanic (includ-ing hydro volcanism) and hydrothermal activity.
Two data sets were used for testing the hypothesis. A first data set grouped data collected twice a month over the 2007–2012 period: the number of cholera cases in the Katana health
Fig 1. Map of the Katana health zone bordered by Kivu Lake, the two large active volcanoes in the area are shown (right) and other Lakes in the African Rift Valley (middle). This map was created using QGIS version 2.18 (http://qgis.org).
zone, meteorological data, physico-chemical characteristics of the lake water, and the SO2flux
(Tonnes/day) of the Nyiragongo plume as a proxy of the intensity of volcanic activity (S1 Table).
We documented a second data set that grouped data collected over the 2016–2017 period: water temperature and salinity measured weekly in the surface water of the lake, the number of cholera cases in the Katana health zone, and the SO2flux (Tonnes/day) of the Nyiragongo
plume as a proxy of the intensity of volcanic activity, and the abundance ofVibrio in the lake’s
surface water and fishes measured twice per month (S2andS3Tables).
Geochemistry of volcanic gases
The SO2flux, which directly reflects the intensity of magmatic degassing in the Nyiragongo
crater, was chosen as a proxy of the intensity of volcanic activity. Quantification of the SO2
flux of the Nyiragongo plume was performed continuously by remote sensing UV absorption spectroscopy (280–420 nm) with telemetric data transmission [25,34–36]. Data covering the study period were obtained at the Rusayo station, located on the southwestern flank of the Nyiragongo volcano and belonging to the database of the Volcanological Observatory of Goma (VOG). Mean of SO2values were calculated for each week to be compared with the
other data.
Physico-chemical characteristics of Lake Kivu
Water temperature, pH, electrical conductivity, and dissolved oxygen potentially regulateV. cholerae [20,37,38]. Over the 2007–2012 period, these parameters were measured twice per month in surface water collected in the lake near Ishungu. Water temperature and electrical conductivity were measured using a portable conductivity meter (HACH CO150, Hach Com-pany, USA). Dissolved oxygen and pH were measured using a HACH portable dissolved oxy-gen meter (HACH DO175, Hach Company, USA) and an Orion pH meter (Model 210A, Orion Laboratories), respectively. Air temperature and rainfall, which are frequently consid-ered to be key factors affecting cholera outbreaks, were compiled over the same time period. These observational data were obtained from the Modern-Era Retrospective Analysis for Research and Applications (MERRA) of the National Aeronautics and Space Administration (NASA).
Over the 2016–2017 period, temperature was measured weekly in the same place using a portable conductivity meter. Salinity was measured using water collected at the same place using a salinity kit (Chloride CL 500, Visocolor HE).
V. cholerae occurrence in water and fishes
Twice a month over the 2016–2017 period, the abundance ofV. cholerae in the lake was
assessed in surface lake water samples collected near Ishungu (same location and sampling dates as salinity and temperature). We filtered one litre of water using a 0.22μm-pore size ster-ile polycarbonate membrane filter. If the sample was too turbid, several membranes were used. The filters were then put in Alkaline Peptone Water (APW; Difco, Detroit, MI, USA) and incubated at 37˚C for 24 h. Five microlitres of enriched APW broth were then streaked with an inoculating loop onto plates containing Thiosulfate Citrate Biliary Salts Sucrose (TCBS) ([39], American Public Health Association, American Water Works Association, Water Pollu-tion Control FederaPollu-tion 1999). The plates were incubated at 37˚C for 16 to 24 h in TCBS. Yel-low, flat, 1–3 mm diameter colonies were counted and expressed as the number of colonies per 100 ml (number of Colony Forming Units (CFUs) per 100 ml).
ForV. cholerae identification, suspected colonies were transplanted onto non-selective
Alkaline Nutrient Gelose (ANG) agar and incubated at 37˚C for 24 h. The Gelatin-positive cul-tures were subjected to an oxidase test. Oxidase-positive colonies were then subjected to fur-ther biochemical characterization using an API 20E gallery.
The search forV. cholerae in fishes was carried on the same dates as water sampling over
the 2016–2017 period. Six fishes were collected twice a month from the Ishungu Basin. A total of 288 fish were sampled and brought to the laboratory, where intestinal and gill samples were systematically collected and checked forV. cholerae occurrence. One gram of fish sample was
inoculated into a tube filled with 9 ml of APW. The tube was vortexed, and its content was then successively diluted in three tubes to 1/10, 1/100 and 1/1000. The exact volume used for dilution allowed us to express the result as the number of colonies per gram of sample. Then, 0.1 ml of each dilution was plated onto TCBS agar and incubated overnight at 37˚C. Yellow colonies on the TCBS medium suspected of beingV. cholerae were counted and transplanted
onto lysogeny broth agar for identity confirmation. The final number of colonies was counted and expressed in CFUs per gram of intestine or gill (see microbiological protocol for more details).
Epidemiological Data
Weekly notifications of cholera cases in the Katana zone were used as epidemiological data. The cases of cholera were defined according to the recommendations of the World Health Organization (WHO). These epidemiological data covered the periods of 2007–2012 and 2016–2017.
Statistical analyses
We first searched for a significant correlation between the number of cholera cases (2007– 2012 period) and 1) the SO2 flux, 2) lake water characteristics and 3) meteorological data. We analysed the data by week, incorporating 147 time-points during the study period (2007– 2012). Direct and lagged cross-correlations between each environmental variable and the log-transformed number of cholera cases (transformation done to normalize the data) were com-puted and tested using Pearson’s correlation coefficient. We verified that log-transformation led to a normal distribution of the variable “number of cholera cases”. Moreover, we visually verified that the assumption of linearity was not abusive for the different relationships tested. Considering that data might be auto correlated to some degree (they are parts of a time series), p(H0) was computed using permutation tests. Then, highly correlated and statistically
signifi-cant predictors were selected to construct a multivariate time series Vector Auto Regressive model (VAR) [40,41], which allow to test the correlations between several time series. A VAR model describes the evolution of a set of k variables (called endogenous variables) over the same sampling period as a linear function of their past values. It is a natural extension of the univariate autoregressive model to dynamic multivariate time series. It also determines how each endogenous variable responds over time to a shock (aberrant behaviour due to sudden and unexpected events) in its own value and in every other variable [41,42].
The basic form of the VAR model of order p as suggested by [43] has the form: Yt¼A0þA1Yt 2þA2Yt 2þ � � � þApyt pþεt
Where:
Yt= (y1t,y2t,. . .,ykt)’ is a vector of k observable endogenous variables and p the time lag.
For this study,yt= (Cholerat,Tt, Raint, Cdt, pHt, SO2t)’, where Cholera represents the number
(mm), Cd is the water conductivity (μS/cm), pH is water pH, and SO2is sulphur dioxide
con-centration of the volcanic plume (Tonnes/day). A0is vector of constant term andεtis vector of
error terms.
The parameters in the model were estimated by generalised least squares. We tested the sta-tionarity of each time series (cholera cases, water temperature, rainfall, conductivity, pH and the SO2 volcanic flux) to be included in the model with the Augmented Dickey Fuller Test (ADF). The number of lags was chosen based on four tests: The Final Prediction Error (FPE) test [44], the Hannan Quinne (HQ) test [45], and the Information Criteria suggested by Akaike (AIC) [46] and by Schwarz (SC) [47]. The parameters in the model were estimated by generalised least squares. Despite the fact that VAR coefficients capture the anticipated impact of a variable, there are usually more important to examine the model residuals, which repre-sent unforeseen contemporaneous events. Thus, to examine the fit of the model, we performed diagnostic tests on the residuals of the model. To test the correlation of series, we applied the Portmanteau test. To test for heteroscedasticity in the residuals, we used a multivariate ARCH Lagrange-Multiplier test. To consider the distribution of residues, a normality test was applied. Both the Granger-causality and instantaneous causality were investigated. For both tests, the vector of endogenous variables was divided into two subvectors, Y1tand Y2t, with dimensions
k1and k2, respectively, so that k = k1+k2. The subvectory1twas said to be Granger-causal for
y2tif the past ofy1tsignificantly helped predicting the future ofy2tvia the past ofy1talone [48].
We then tested the impulsive responses to describe the response of the cholera incidence to the various predictor shocks.
Second, for the data set covering the 2016–2017 period and incorporating 48 time-points, we looked for significant correlations between lake temperature and salinity and 1) the SO2 flux, 2) the V.cholerae concentration in water and fish, 3) cholera cases, and 4) the V. cholerae
concentration in water and fish, and cholera cases using direct and lagged cross-correlations. The small size of this second data package did not allow the multiple regression models of time series to be developed.
Difference of contamination between intestines and gills were analysed using a linear mixed effect model with intestine contamination as the response variable and gill contamina-tion as independent variable, with a random effect on time. Sampling over time might lead to some degree of autocorrelation along time series, and subsequent non-independence of data (with possible overestimation of degrees of freedom). This was avoided using a permutation test based on 1000 replicates for testing the null hypothesis of independence between intestine and gill contamination.
All tests were two-sided, and the level of statistical significance was set at 0.05. Computing and graphing were performed using R 3.4.4.
The study used cholera data aggregated at the health-zone level; thus, it did not require any ethical review board approval.
Results
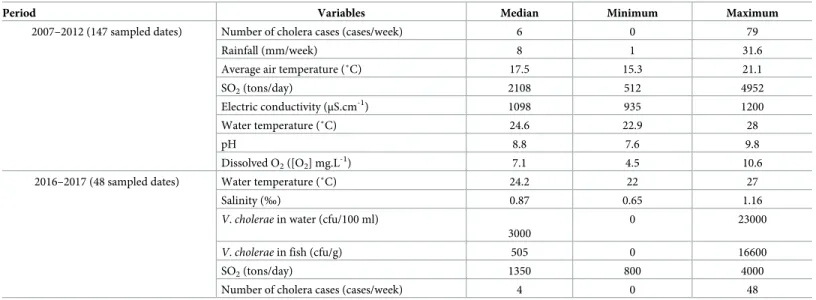
Summary of the data set and descriptive statistics are presented inTable 1.
Time series plots of cholera cases and of environmental variables collected from 2007 to 2012 are presented inFig 2. The global correlation analysis of the data set covering the period of 2007–2012 showed that the sulphur dioxide concentration of the volcanic plume was strongly and positively correlated with lake water temperature and conductivity, and cholera cases. Water temperature and conductivity were also strongly and positively correlated with the number of cholera cases. The other correlations were much weaker, but some were signifi-cant (Table 2).
The result of the cross correlation and univariate model between cholera cases and environ-mental variables are presented inTable 3. The table shows a significant positive linear associa-tion between the number of cholera cases with sulphur dioxide concentraassocia-tion of the volcanic plume, water temperature and conductivity. A value higher than the average of sulphur diox-ide concentration of the volcanic plume, temperature and water conductivity was likely to lead
Table 1. Summary of data collected during the two sampling periods.
Period Variables Median Minimum Maximum
2007–2012 (147 sampled dates) Number of cholera cases (cases/week) 6 0 79
Rainfall (mm/week) 8 1 31.6
Average air temperature (˚C) 17.5 15.3 21.1
SO2(tons/day) 2108 512 4952
Electric conductivity (μS.cm-1) 1098 935 1200
Water temperature (˚C) 24.6 22.9 28
pH 8.8 7.6 9.8
Dissolved O2([O2] mg.L-1) 7.1 4.5 10.6
2016–2017 (48 sampled dates) Water temperature (˚C) 24.2 22 27
Salinity (‰) 0.87 0.65 1.16
V. cholerae in water (cfu/100 ml)
3000
0 23000
V. cholerae in fish (cfu/g) 505 0 16600
SO2(tons/day) 1350 800 4000
Number of cholera cases (cases/week) 4 0 48
https://doi.org/10.1371/journal.pntd.0008406.t001
Fig 2. Time series plot of cholera cases and environmental variables for the period of 2007 to 2012, Katana health zone, DR Congo (n = 147).
Table 2. Pearson correlation coefficients between logarithmic transformation of observed number of cholera cases and environmental variables over the 2007–2012 period (n = 147 sampled dates).
Variables Cholera cases (/week) Rainfall (mm/ week) Average air temperature (˚C) SO2(tons/ day) Electric conductivity (μS.cm-1) Water temperature (˚C) pH Dissolved O2 (mg.L-1)
Cholera cases (/week) 0.32� 0.26� 0.73�� 0.80�� 0.82�� 0.28� -0.04
Rainfall (mm/week) 0.21� 0.30� 0.18� 0.26�� -0.02 0.20� Average air temperature (˚C) 0.27� 0.16� 0.28�� -0.09 0.05 SO2(tons/day) 0.65�� 0.69�� 0.07 0.10 Electric conductivity (μS.cm-1 ) 0.69�� 0.29�� 0.05 Water temperature (˚C) 0.24� 0.11 pH 0.10 Dissolved O2(mg.L-1) ��p <0.01.
�p< 0.05; the correlations greater than 0.5 and highly significant are bolded.
https://doi.org/10.1371/journal.pntd.0008406.t002
Table 3. Cross-correlation coefficients and univariate model of logarithmic transformation of observed number of cholera cases and environmental variables over the 2007–2012 period (n = 147 sampled dates).
Variables Univariate model
Cross correlation lags (weeks) Correlation coefficients (r) Odd ratios1 95% CI P-value Rainfall
(mm/week)
0 0.33� 1.01 0.99–1.025 0.36
1 0.35� 1.01 0.99–1.023 0.3
2 0.37� 1.02 1.001–1.03 0.03
Average air temperature (˚C) 0 0.27� 1.01 0.97–1.17 0.16
1 0.21� 0.98 0.90–1.08 0.79 2 0.26� 0.98 0.91–1.07 0.78 SO2 (tons/day) 0 0.76�� 1.0004 1.0003–1.0005 < 0.001 1 0.48�� 1.0001 1.00002–1.0002 0.012 2 0.38�� 1.0001 0.98–1.0002 0.07 Water conductivity (μS.cm-1) 0 0.75�� 1.006 1.005–1.01 < 0.001 1 0.34�� 1 0.99–1.00 0.74 2 0.30� 1.001 0.99–1.001 0.07 Water temperature (˚C) 0 0.80�� 1.43 1.35–1.52 < 0.001 1 0.41�� 1.03 9.74–1.10 0.27 2 0.32� 1.04 0.98–1.039 0.17 pH 0 0.27� 1.36 1.15–1.62 < 0.001 1 0.03 0.89 0.97–1.065 0.21 2 0.01 0.98 0.83–1.17 0.87
Dissolved oxygen ([O2] mg.l-1) 0 0.16 1.08 0.96–1.21 0.165
1 0.09 0.97 0.86–1.09 0.699
2 0.04 1.03 0.93–1.14 0.53
1
Obtained by exponentiating the estimates obtained from the model ��p <0.01.
�p< 0.05�
to a higher than average number of cholera cases during the same week. Also, the positive effects of sulphur dioxide concentration of the volcanic plume on cholera cases were observed one week after the increase in volcanic activity. Nevertheless, despite a weak correlation (r = 0.37; p = 0.03), the effects of rainfall on cholera cases were better observed four weeks after their increase. A direct effect of water pH on cholera cases was also observed despite the low correlation (r = 0,27, p<0.001;Table 3).
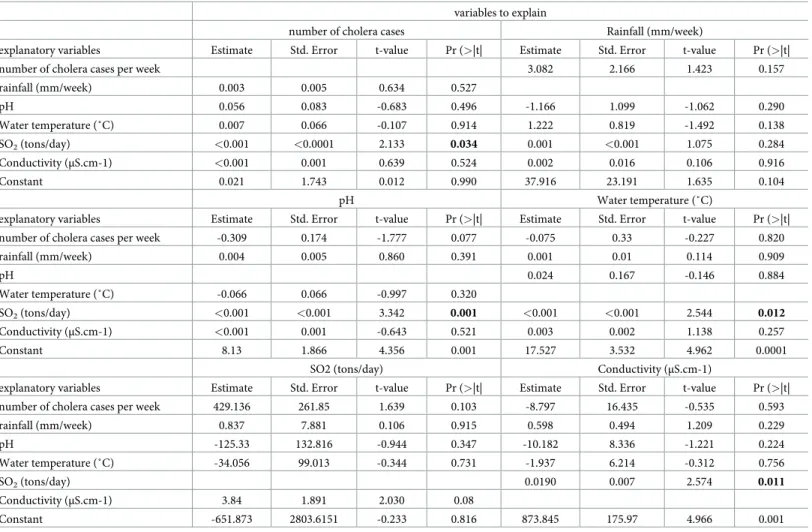
Table 4grouping linear interdependencies among multiple time series using multivariate Vector Autoregression (VAR) models confirmed that volcanic activity influenced the time series of lake parameters (temperature, pH, conductivity) as well as the incidence of cholera cases in the population.
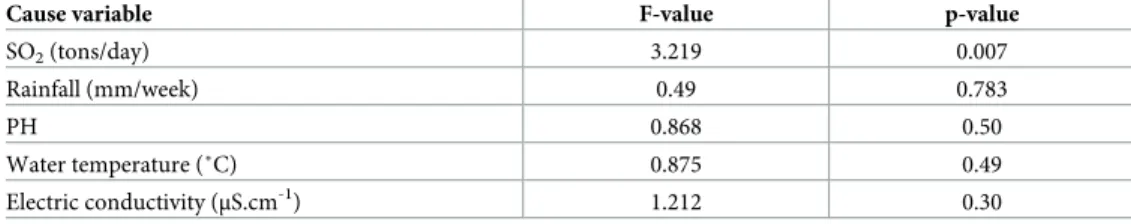
The instantaneous and Granger-causality tests are simple ways to ascertain whether a vari-able is affected by changes in other varivari-ables. These tests indicate if changes in one varivari-able help forecast a one-step ahead figure in another variable. The test statistics are summarized in Tables5and6. Each column contains the values of F-statistics testing the marginal effect of inclusion of lagged values of the environmental variables in the row on cholera. Both tests indi-cated that the number of cholera cases was influenced by volcanic activity. In addition, the instantaneous causality tests showed that cholera was influenced by rainfall, Ph, temperature and water conductivity.
Table 4. Linear interdependencies among multiple time series using multivariate Vector Autoregression (VAR) models. Six variables were selected to build this model: cholera cases. rainfall. water temperature. water electric conductivity. pH. volcanic sulphur dioxide emission. For the 2007–2012 period. Katana Halth Zone. DR Congo (n = 147 sampled dates). The significant correlations are bolded.
variables to explain
number of cholera cases Rainfall (mm/week)
explanatory variables Estimate Std. Error t-value Pr (>|t| Estimate Std. Error t-value Pr (>|t|
number of cholera cases per week 3.082 2.166 1.423 0.157
rainfall (mm/week) 0.003 0.005 0.634 0.527 pH 0.056 0.083 -0.683 0.496 -1.166 1.099 -1.062 0.290 Water temperature (˚C) 0.007 0.066 -0.107 0.914 1.222 0.819 -1.492 0.138 SO2(tons/day) <0.001 <0.0001 2.133 0.034 0.001 <0.001 1.075 0.284 Conductivity (μS.cm-1) <0.001 0.001 0.639 0.524 0.002 0.016 0.106 0.916 Constant 0.021 1.743 0.012 0.990 37.916 23.191 1.635 0.104 pH Water temperature (˚C)
explanatory variables Estimate Std. Error t-value Pr (>|t| Estimate Std. Error t-value Pr (>|t| number of cholera cases per week -0.309 0.174 -1.777 0.077 -0.075 0.33 -0.227 0.820
rainfall (mm/week) 0.004 0.005 0.860 0.391 0.001 0.01 0.114 0.909 pH 0.024 0.167 -0.146 0.884 Water temperature (˚C) -0.066 0.066 -0.997 0.320 SO2(tons/day) <0.001 <0.001 3.342 0.001 <0.001 <0.001 2.544 0.012 Conductivity (μS.cm-1) <0.001 0.001 -0.643 0.521 0.003 0.002 1.138 0.257 Constant 8.13 1.866 4.356 0.001 17.527 3.532 4.962 0.0001
SO2 (tons/day) Conductivity (μS.cm-1)
explanatory variables Estimate Std. Error t-value Pr (>|t| Estimate Std. Error t-value Pr (>|t| number of cholera cases per week 429.136 261.85 1.639 0.103 -8.797 16.435 -0.535 0.593
rainfall (mm/week) 0.837 7.881 0.106 0.915 0.598 0.494 1.209 0.229 pH -125.33 132.816 -0.944 0.347 -10.182 8.336 -1.221 0.224 Water temperature (˚C) -34.056 99.013 -0.344 0.731 -1.937 6.214 -0.312 0.756 SO2(tons/day) 0.0190 0.007 2.574 0.011 Conductivity (μS.cm-1) 3.84 1.891 2.030 0.08 Constant -651.873 2803.6151 -0.233 0.816 873.845 175.97 4.966 0.001 https://doi.org/10.1371/journal.pntd.0008406.t004
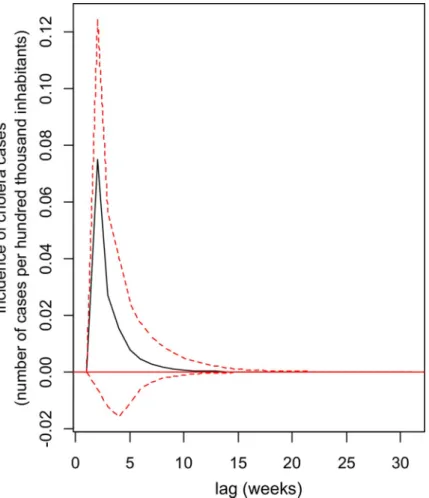
Impulse response analysis was utilized to analyse the dynamic interactions between cholera and the volcanic activity of the VAR process. The orthogonal impulse response of cholera to the volcanic activity is presented inFig 3. The highest positive effect of volcanic activity on cholera is in the fourth week. The positive effect of volcanic activity on cholera incidence is observed from the fourth week and persists until the 15th week, while impulsive responses of volcanic activity on the physico-chemical of the lake are perceptible from the first week.
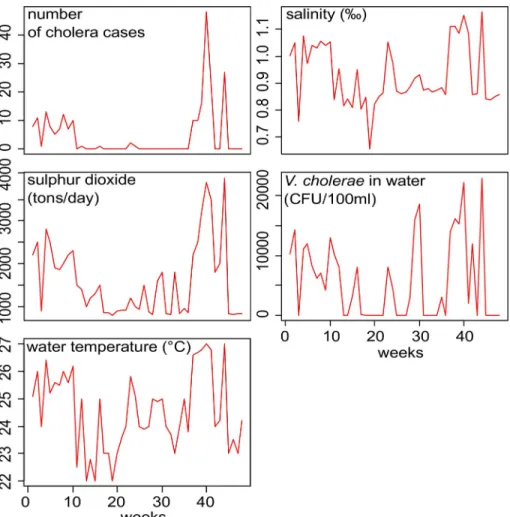
The main time series plots (cholera cases, fish contamination, and environmental variables collected from 2016 to 2017) are presented inFig 4. During the 2016–2017 period, the abun-dance ofV. cholerae in the lake was positively correlated with lake salinity and temperature
and the number of cholera cases in the population. Fish contamination was positively corre-lated withV. cholerae abundance in lake water (r = 0,94, p = 0,001) (Table 7). Cross-correlation analyses also showed strong direct correlations between sulphur dioxide concentration of the volcanic plume, temperature and salinity of lake water and the concentration ofV. cholerae in
the lake. Also, statistically significant correlations were observed after 2-week lag (Table 8). Contamination was significantly higher in intestines than in gills (5% higher in average, lin-ear mixed effect model, permutation test, p < 0.001).
Discussion
Over the 2007–2012 period, we demonstrated a strong and positive correlation between (1) cholera dynamics, (2) volcanic activity, assessed by sulphur dioxide content of volcano plume, (3) water temperature and conductivity of Lake Kivu and, to a lesser extent, (4) rainfall. More precisely, an above-average rise in volcanic sulphur dioxide modifies the physico-chemical characteristics of the lake in the same week, and the action can persist for several weeks.
Table 5. Granger causality tests for the number of cholera cases and environmental variables (rainfall. water tem-perature. water electric conductivity and pH. volcanic sulphur dioxide emission) for 2007–2012 period. Katana Health Zone. DR Congo (n = 147 sampled dates).
Cause variable F-value p-value
SO2(tons/day) 3.219 0.007
Rainfall (mm/week) 0.49 0.783
PH 0.868 0.50
Water temperature (˚C) 0.875 0.49
Electric conductivity (μS.cm-1) 1.212 0.30
Null hypothesis: environmental variable not Granger cause cholera Reject the null hypothesis if p-value is < 0.05.
https://doi.org/10.1371/journal.pntd.0008406.t005
Table 6. Instantaneous causality tests for number of cholera cases and environmental variables (rainfall. water temperature. water electric conductivity. water Ph. volcanic sulphur dioxide emission) for 2007–2012 period. Katana Health Zone. DR Congo (n = 147 sampled dates).
Cause variable Chi-squared-value p-value
SO2(tons/day) 49.289 0.0001
Rainfall (mm/week) 11.712 0.038
pH 25.68 0.0001
Water temperature (˚C) 53.22 0.0001
Electric conductivity (μS.cm-1) 51.729 0.0001
Null hypothesis: No instantaneous causality between environmental variable and cholera Reject the null hypothesis if p-value is <0.05.
There is a poor correlation between air temperature and water temperature, whereas the correlation between volcanic activity and lake temperature is strong, outlining that the lake temperatures are partly controlled, at least during periods of high volcanic activity, by volcanic activity.V. cholerae usually colonizes warm brackish waters [38,49], the temperature of which being usually dependent on the climate. In the present situation, volcanic activity may increase the temperature of hydrothermal springs and tributaries in such a way that it leads to favour-able thermal conditions forV. cholerae. Previous studies conducted in hydrothermal areas
have demonstrated that lake water temperature increase may lead to the occurrence of cholera cases (e.g. two days after thermal peaks, [50]). Temperature increases are involved in the risk of cholera outbreaks because the abundance ofV. cholerae in water increases as the
tempera-ture increases [51,52]. Under higher temperatures, the growth and multiplication ofV. cho-lerae might be promoted [53], increasing the risk that the concentration ofV. cholerae in water
would be sufficient to be pathogenic if ingested [54,55].
We demonstrated also an instantaneous causality between the electric conductivity of Lake Kivu water and cholera cases in the population. A study conducted in Lake Victoria and sev-eral lakes of the Rift valley demonstrated also a positive relationship between electric conduc-tivity and the number ofV. cholerae colonies in lake waters, but it did not link this relationship
to any other environmental variation, nor to epidemiological data [37]. Our results
Fig 3. Time series plot of cholera cases, water vibrio occurrence and environmental variables for the period of 2016 to 2017, Katana health zone, DR Congo (n = 48).
Fig 4. Impulse Response Function (IRF) showing the impact of an increase in volcanic activity (through the flow of volcanic sulphur dioxide) on the incidence of cholera cases in the population of the Katana Health Zone, DR Congo, over a 15-week period. The largest positive effect is observed about three weeks after the shock due to volcanic activity and the return to equilibrium is only observed around the 15th week. Black line: Impulse Response Function, dotted lines: 95% confidence level curves (obtained through 100 runs of the bootstrap method).
https://doi.org/10.1371/journal.pntd.0008406.g004
Table 7. Pearson correlation coefficients between logarithmic transformation of observed cholera cases in the Katana health zone. physico-chemical characteristics of lake Kivu. and the concentration of V. cholerae in lake water and fish over the 2016–2017 period (n = 48 sampled weeks).
Variables number of cholera cases per week
water temperature (˚C)
Salinity (‰)
V. cholerae in fish (CFU/
100 g)
V. cholerae in water (CFU/
100 ml)
SO2(tons/
day) number of cholera cases per
week
0.89�� 0.90�� 0.70�� 0.69�� 0.89��
Water temperature (˚C) 0.93�� 0.71�� 0.71�� 0.77��
Salinity (‰) 0.75�� 0.75�� 0.82��
V. cholerae in fish (CFU/100
g)
0.94�� 0.77�� V. cholerae in water (CFU/
100 ml)
0.77�� SO2(tons/day)
��p <0.01.
�p< 0.05; the correlations greater than 0.5 and highly significant are bolded.
demonstrated for the first time that the strong correlation between water electric conductivity and the occurrence ofVibrio cholerae in the lake is linked to environmental factors (namely
volcano activity, rainfall, and their possible combined impact on lake water quality), and likely impact the incidence of cholera in the Katana population along the lake shore.
We also demonstrated for the first time that the temporal variation of cholera cases is strongly and at a short time scale, controlled by the temporal variability of volcano activity, together with, in a lesser extent, and in a more delayed way, by rainfall. Indeed, rainfall posi-tively influenced the number of cholera cases 4 weeks after its increase. Heavy rains can pro-vide, through the percolation of volcanic soils in the region, significant quantities of minerals in the lakes, thus promoting bacterial occurrence and the occurrence of cholera outbreaks in the region. The temporal delay between rain peaks and cholera outbreaks may relate to the time required for rainfall to infiltrate in the soil surface, and exfiltrate in the lake tributaries or the lake itself. Rainfall can also affect the growth of the pathogen and its survival. Indeed, high rainfall increases the levels of insoluble iron, which improves the survival ofV. cholerae in
aquatic environments. Moderate levels of iron also increase expression of the cholera toxin. It has also been suggested that high rainfall might wash away the vibriophages that prey onV. cholerae in water, leading to the epidemics of cholera [56,57].
The significant but low pH positive effect on cholera cases may be due to the known niche of the bacillus, that develop preferably in alkaline waters.
These correlations can reinforce the environmental hypothesis on the endemicity of this region to cholera. Volcanic activity, by modifying the physico-chemical composition of water, may create a niche favourable to the survival ofV. cholerae. These physico-chemical conditions
may also have a positive effect on plankton blooms, essential for the growth ofV cholerae ([58]). Over the 2016–2017 period, the salinity of the lake water was positively correlated with the occurrence ofV. cholerae in lake water. A positive correlation between the salinity of lake
water and the number of cholera cases in the population of the Katana Health zone was also demonstrated. Salinity has been previously demonstrated to be strongly involved in the ecol-ogy ofV. cholerae and therefore to contribute indirectly to cholera epidemics [38]. Studies con-ducted in coastal and estuarine regions in different parts of the world have outlined that temperature and salinity rule partly the occurrence ofV. cholerae in aquatic environments
[38,49].
According to data from the Demographic and Health Survey published in 2014 [59], nearly three out of ten households in the Katana population have access to an improved water source with a regular flow during the year, which explains why the population frequently uses stream
Table 8. Cross correlations between the concentration of V. cholerae in the Kivu lake. the number of cholera cases in the Katana health zone. and environmental variables over the 2016–2017 period (n = 48 sampled weeks). Variables Cross correlation lags (weeks) Correlation coefficients (r)
SO2 (tons/day) 0 0.77�� 1 0.35�� Salinity (‰) 0 0.74�� 1 0.26�� Water temperature (˚C) 0 0.71�� 1 0.27��
Number of Cholera cases per week 0 0.65��
1 0.32��
��p <0.01. �p< 0.05
and lake water as a drinking water source. Thus, this permanent contact between man and the at-risk lake environment may explain the endemicity of cholera in this area of the rift valley bordering Lake Kivu. The population is indeed chronically exposed to potentially contami-nated water. It can therefore be realistically hypothesized that it is variations in vulcanological functioning and associated hydrothermalism that govern the degree of contamination of sur-face waters, and the epidemiology ofV. cholerae.
We also demonstrate a significant and positive link between cholera dynamics in the popu-lation and fish and water contamination. The fish caught in the lake have a bacillus load that is highly correlated with the load in lake water. Depending on the studies,Vibrio may be found
[60] or not [61]), but the studies usually not try to correlate the occurrence ofVibrio
simulta-neously in the water and in the animals (but see [62] for example). The local residents fre-quently eat these fish raw or salted, without emptying them nor cooking them. These
consumption practices can consequently increase the risk of consumer contamination [63]. It is also possible that the bacillus survives at least for a few days, in salted food [64–66]. Contam-inated fish may remain sufficiently wet for maintaining alive someV. cholerae and may
there-fore be a source of contamination for consumers for several days after collection. Transport and trade of salted or fresh fishes to other provinces may then spread the bacillus to preserved populations.
The findings of this study consistently support, for the first time, the idea that volcano-tec-tonic activity, by largely controlling the hydrothermal functioning of Lake Kivu, determines the physico-chemistry of the lake and consequently likely induces cholera outbreaks. The cor-relations are so strong that the volcanic signal can be used as an environmental predictor of cholera blooms in the lake and thus as an alert signal for populations.
The Rift paradox concerning cholera occurrence along saltwater lakes of the Rift [12,24,
31] can be explained by the salinization and warming of water as volcanic activity increases. The high variability ofVibrio cholerae contamination in a series of large lakes in the African
rift recently observed may relate to the hydro-geological and volcano-tectonic context of each lake [67]. These factors would control the physico-chemical characteristics of each lake, and therefore their susceptibility to constitute habitats forVibrio cholera [67]. Consequently, the bacillus niche does not appear to be significantly different from that described in previous studies in coastal areas [2,3,5,6,68], such as the lagoon areas of India [4].
However, the question of when and how cholera appeared in the rift valley remains open. The first cases of cholera in the Great Lakes region of Africa were observed in 1971, mainly in Kenya and then in Uganda [69,70]. In a report from September 1971, the "Belgian cooperation mission" was already concerned about the risk of cholera in the eastern Congolese region. For this reason, the mission decided to send 20 kg of cholera vaccines [69,71]. The part of the Great Lakes located in the present Democratic Republic of Congo (DRC), then called Zaïre, was affected only in September 1977, whereas the first epidemic had already occurred (in 1974) in the littoral part of the country (province of Kongo Central, then called Bas Zaïre) more than 1700 km away, in the lakeside city of Kalemie, located on on the west right bank of Lake Tanganyika (water flows from the north to the south in this part of the rift chain of lakes). From this point on, the disease spread rapidly throughout the eastern part of the DRC. The 1978 epidemic in the eastern DRC (In Kalemie, on the right bank of Lake Tanganyika), originated from Tanzania and concentrated near the Great Lakes. On this occasion, contami-nated water was proven to play a role in the transmission of the disease [72].
The Nyiragongo volcano has erupted only twice (10thof January 1977 and 17thof January 2002) since it has been monitored [28]. Both eruptions were preceded by the appearance of mineral sources close to the city of Sake (NW Kabuno Bay), indicating the circulation of water in the fracture system just before the eruptions [28]. Hydro volcanism also occurred in the
past in the southern part of the main NE-SW fracture system [27,30,73,74], revealing the strong coupling between water circulation of the recharging aquifer system and fractures in the area close to the northern shoreline of Kivu Lake [30,33]. Sub-groundwater discharges into the Northern part of the lake likely occurred along these faults and fractures, which are also involved in the structuration of the Kivu rift segment, and which may connect aquifers over different depths [29]. The acidic gases (HF, HCl, CO2, and SO42-) of the eruptive plume
of Nyiragongo volcano are highly soluble in water and generate a low pH, which favours the dissolution of volcanic ash and may also affect the composition of rainwater and ultimately of rivers reaching the lake [23,75]. This plume indirectly contributes to an increase in the tem-perature and salinity of the surface waters of Lake Kivu, which is favourable to the survival of
V. cholerae. Ad minima, the reactivation of volcanic activity has led to an increase in
hydro-thermal inputs to the lake, a factor affecting hydro-thermal increase and salinization.
Conclusion
Cholera is a serious public health problem in the health zones located along the Rift in general and more particularly in the Katana health zone. The high exposure of this population due to limited access to safe water raises an urgent need for new and effective cholera prevention strategies. This study offers a unique insight by demonstrating in a health zone of Lake Kivu, the direct influence of volcanic activity on water physico-chemical characteristics andV. cho-lerae occurrence and abundance in the lake water and fish, and thus on the cholera dynamics
in the population. These elements of understanding are therefore for public health authorities to readjust operational plans for cholera control in this region. Interventions that target vital steps in transmission might be effective for the prevention of outbreaks. The Nyiragongo vol-canic activity and the Kivu lake physico-chemical characteristics must be considered as risk factors and the monitoring of these environmental factors must be integrated into the preven-tion devices for preventing contaminapreven-tion risk and limiting cholera epidemics. In other words, while maintaining efforts to achieve an acceptable level of access to drinking water for the pop-ulation, the monitoring of volcanic activity as well as lake physico-chemical characteristics to improve cholera surveillance in the region as part of the multisectoral cholera elimination plan. There are some limitations however to this study. The first one is that we only focused on one health zone, at the immediate proximity of the volcano. It is still necessary to determine the way of human contamination of the other health zones bordering the lake. Is it due to human contamination, or through the consummation of contaminated food and water? In this last hypothesis, is there a delay in the epidemic response, related to the circulation of water in the lake, which is drained by the Ruzizi River? For answering this question, new investiga-tions including other health zones along the lake may be necessary, including epidemiological data, together with water quality and fish contamination surveys.
The failure to achieve PCR in this study is a limitation in determining vibrio toxicity genes. Indeed, only serogroups O1 and O139 are the cause of epidemics, while non-O1 and O139 cause mild diarrhoea. However, previous studies have demonstrated that toxigenic serogroups O1 are abundant in this cholera epidemic sanctuary (Katana Health Zone: [76]). Further stud-ies on the conserved strains will be necessary to identify precisely which serogroups are present in lake surface water and fish, and to determine whether they may respond differently to envi-ronmental variations.
In the same way, many questions remain opened on the geological mechanisms leading to the control of physico-chemical characteristics of lake water, such as the direct effect of volca-nic gas and tephra. In the same wat, the question of the parameters directly involved inV. cho-lerae multiplication (and particularly the part of physico-chemical and trophic controls) in the
lake needs to be identified. Finally, the study shows the disappearance ofV. cholerae from
sur-face waters in the Katana sector during periods of low volcanic activity, suggesting refuges for the vibrio in the lake. One hypothesis would be that these refuges are located at depth, close to hydrothermal springs, which implies a vertical migration of the bacillus when the temperature and salinity of the surface waters increase.
Supporting information
S1 Table. Weekly data collected over the 2007–2012 period: the number of cholera cases in the Katana health zone, meteorological data, physico-chemical characteristics of the Kivu lake water (Ishungu station in the Katana Health zone), and the SO2 flux of the Nyira-gongo volcano plume.
(XLSX)
S2 Table.Vibrio cholerae abundance in fishes (intestine and gills) collected twice a month
in Lake Kivu (Ishungu station in the Katana Health zone) over the 2016–2017 period.
(XLSX)
S3 Table. Water characteristics measured twice a month in the Kivu lake (Ishungu station in the Katana Health zone) over the 2016–2017 period: temperature, salinity (PSU), SO2 flux of the Nyiragongo volcano plume and abundance of Vibrio cholerae in surface water.
The number of cholera cases in the Katana health zone counted twice a month over the same period is indicated.
(XLSX)
Acknowledgments
We thank Mathieu M. Yalire, and Abel Minani for their assistance in the collection of volcanic data. We also thank Wimba Louisette and Aksanti Lwango for microbiological analyses of water and fish.
Author Contributions
Conceptualization: Frederic Mauny, Jean Jacques Muyembe, Didier Bompangue, Gudrun
Bornette.
Data curation: Patrick Giraudoux, Didier Bompangue. Formal analysis: Patrick Giraudoux.
Investigation: Doudou Batumbo Boloweti, Catherine Deniel, Emmanuel Garnier, Gudrun
Bornette.
Methodology: Doudou Batumbo Boloweti, Patrick Giraudoux, Catherine Deniel, Gudrun
Bornette.
Project administration: Gudrun Bornette.
Resources: Doudou Batumbo Boloweti, Patrick Giraudoux, Catherine Deniel, Emmanuel
Gar-nier, Celestin Mahinda Kasereka, Roger Kizungu.
Software: Patrick Giraudoux, Roger Kizungu. Supervision: Didier Bompangue, Gudrun Bornette.
Validation: Patrick Giraudoux, Catherine Deniel, Frederic Mauny, Celestin Mahinda
Visualization: Jean Jacques Muyembe, Didier Bompangue.
Writing – original draft: Doudou Batumbo Boloweti, Catherine Deniel, Emmanuel Garnier. Writing – review & editing: Gudrun Bornette.
References
1. Colwell RR. Infectious disease and environment: cholera as a paradigm for waterborne disease. Int Microbiol. 2004; 7(4):285–9. Epub 2005/01/25. PMID:15666250.
2. Turner JW, Good B, Cole D, Lipp EK. Plankton composition and environmental factors contribute to Vib-rio seasonality. Isme j. 2009; 3(9):1082–92. Epub 2009/05/08.https://doi.org/10.1038/ismej.2009.50
PMID:19421235.
3. Johnson CN, Flowers AR, Noriea NF, Zimmerman AM, Bowers JC, DePaola A, et al. Relationships between Environmental Factors and Pathogenic Vibrios in the Northern Gulf of Mexico. Applied and Environmental Microbiology. 2010; 76(21):7076–84.https://doi.org/10.1128/AEM.00697-10PMID:
20817802
4. Asplund ME, Rehnstam-Holm AS, Atnur V, Raghunath P, Saravanan V, Ha¨rnstro¨m K, et al. Water col-umn dynamics of Vibrio in relation to phytoplankton community composition and environmental condi-tions in a tropical coastal area. Environ Microbiol. 2011; 13(10):2738–51. Epub 2011/09/08.https://doi. org/10.1111/j.1462-2920.2011.02545.xPMID:21895909.
5. Froelich B, Bowen J, Gonzalez R, Snedeker A, Noble R. Mechanistic and statistical models of total Vib-rio abundance in the Neuse River Estuary. Water Res. 2013; 47(15):5783–93. Epub 2013/08/21.
https://doi.org/10.1016/j.watres.2013.06.050PMID:23948561.
6. Izumiya H, Furukawa M, Ogata K, Isobe J, Watanabe S, Sasaki M, et al. A double-quadratic model for predicting Vibrio species in water environments of Japan. Archives of Microbiology. 2017; 199(9):1293– 302.https://doi.org/10.1007/s00203-017-1402-1PMID:28646477
7. Vital M, Fu¨chslin HP, Hammes F, Egli T. Growth of Vibrio cholerae O1 Ogawa Eltor in freshwater. Micro-biology. 2007; 153(Pt 7):1993–2001. Epub 2007/06/30.https://doi.org/10.1099/mic.0.2006/005173-0
PMID:17600045.
8. Vezzulli L, Pruzzo C, Huq A, Colwell RR. Environmental reservoirs of Vibrio cholerae and their role in cholera. Environ Microbiol Rep. 2010; 2(1):27–33. Epub 2010/02/01. https://doi.org/10.1111/j.1758-2229.2009.00128.xPMID:23765995.
9. Li X, Wang D, Li B, Zhou H, Liang S, Ke C, et al. Characterization of environmental Vibrio cholerae ser-ogroups O1 and O139 in the Pearl River Estuary, China. Can J Microbiol. 2016; 62(2):139–47. Epub 2015/12/18.https://doi.org/10.1139/cjm-2015-0443PMID:26674584.
10. Ryan SJ, Stewart-Ibarra AM, Ordo´ñez-Enireb E, Chu W, Finkelstein JL, King CA, et al. Spatiotemporal Variation in Environmental Vibrio cholerae in an Estuary in Southern Coastal Ecuador. Int J Environ Res Public Health. 2018; 15(3). Epub 2018/03/15.https://doi.org/10.3390/ijerph15030486PMID:
29534431; PubMed Central PMCID: PMC5877031.
11. Acosta CJ, Galindo CM, Kimario J, Senkoro K, Urassa H, Casals C, et al. Cholera outbreak in southern Tanzania: risk factors and patterns of transmission. Emerg Infect Dis. 2001; 7(3 Suppl):583–7. Epub 2001/08/04.https://doi.org/10.3201/eid0707.010741PMID:11485679; PubMed Central PMCID: PMC2631835.
12. Huehn S, Eichhorn C, Urmersbach S, Breidenbach J, Bechlars S, Bier N, et al. Pathogenic vibrios in environmental, seafood and clinical sources in Germany. International Journal of Medical Microbiology. 2014; 304(7):843–50.https://doi.org/10.1016/j.ijmm.2014.07.010PMID:25129553
13. Yan L, Pei X, Zhang X, Guan W, Chui H, Jia H, et al. Occurrence of four pathogenic Vibrios in Chinese freshwater fish farms in 2016. Food Control. 2019; 95:85–9.https://doi.org/10.1016/j.foodcont.2018.07. 043.
14. Griffith DC, Kelly-Hope LA, Miller MA. Review of reported cholera outbreaks worldwide, 1995–2005. Am J Trop Med Hyg. 2006; 75(5):973–7. Epub 2006/11/25. PMID:17123999.
15. Gaffga NH, Tauxe RV, Mintz ED. Cholera: a new homeland in Africa? Am J Trop Med Hyg. 2007; 77 (4):705–13. Epub 2007/11/06. PMID:17978075.
16. Emch M, Feldacker C, Islam MS, Ali M. Seasonality of cholera from 1974 to 2005: a review of global pat-terns. Int J Health Geogr. 2008; 7:31. Epub 2008/06/24.https://doi.org/10.1186/1476-072X-7-31PMID:
17. Bompangue Nkoko D, Giraudoux P, Plisnier P-D, Tinda AM, Piarroux M, Sudre B, et al. Dynamics of cholera outbreaks in Great Lakes region of Africa, 1978–2008. Emerging infectious diseases. 2011; 17 (11):2026–34.https://doi.org/10.3201/eid1711.110170MEDLINE:22099090. PMID:22099090 18. Shapiro RL, Otieno MR, Adcock PM, Phillips-Howard PA, Hawley WA, Kumar L, et al. Transmission of
epidemic Vibrio cholerae O1 in rural western Kenya associated with drinking water from Lake Victoria: an environmental reservoir for cholera? Am J Trop Med Hyg. 1999; 60(2):271–6. Epub 1999/03/11.
https://doi.org/10.4269/ajtmh.1999.60.271PMID:10072150.
19. Luque Ferna´ndez MA, Bauernfeind A, Jime´ nez JD, Gil CL, El Omeiri N, Guibert DH. Influence of tem-perature and rainfall on the evolution of cholera epidemics in Lusaka, Zambia, 2003–2006: analysis of a time series. Trans R Soc Trop Med Hyg. 2009; 103(2):137–43. Epub 2008/09/12.https://doi.org/10. 1016/j.trstmh.2008.07.017PMID:18783808.
20. Plisnier P-D, Nshombo M, Mgana H, Ntakimazi G. Monitoring climate change and anthropogenic pres-sure at Lake Tanganyika. Journal of Great Lakes Research. 2018; 44(6):1194–208.https://doi.org/10. 1016/j.jglr.2018.05.019.
21. Natacha P. Nutrient Cycling and Methane Production in Lake Kivu. Zurich: ETH Zurich; 2009.
22. Tassi F, Vaselli O, Tedesco D, Montegrossi G, Darrah T, Cuoco E, et al. Water and gas chemistry at Lake Kivu (DRC): Geochemical evidence of vertical and horizontal heterogeneities in a multibasin struc-ture. Geochemistry Geophysics Geosystems. 2009; 10.https://doi.org/10.1029/2008gc002191
WOS:000263173200002.
23. Cuoco E, Spagnuolo A, Balagizi C, De Francesco S, Tassi F, Vaselli O, et al. Impact of volcanic emis-sions on rainwater chemistry: The case of Mt. Nyiragongo in the Virunga volcanic region (DRC). Journal of Geochemical Exploration. 2013; 125:69–79.https://doi.org/10.1016/j.gexplo.2012.11.008
WOS:000315014500007.
24. Finger F, Knox A, Bertuzzo E, Mari L, Bompangue D, Gatto M, et al. Cholera in the Lake Kivu region (DRC): Integrating remote sensing and spatially explicit epidemiological modeling. Water Resources Research. 2014; 50(7):5624–37.https://doi.org/10.1002/2014wr015521WOS:000342632000015.
25. Balagizi CM, Yalire MM, Ciraba HM, Kajeje VB, Minani AS, Kinja AB, et al. Soil temperature and CO2 degassing, SO2 fluxes and field observations before and after the February 29, 2016 new vent inside Nyiragongo crater. Bulletin of Volcanology. 2016; 78(9):64.https://doi.org/10.1007/s00445-016-1055-y 26. Balagizi CM. Rain-plume interactions at Nyiragongo and Nyamulagira volcanoes and associated
rain-water hazards, East Africa. Applied geochemistry. 2017; v. 81:pp. 14–89-2017 v.81.https://doi.org/10. 1016/j.apgeochem.2017.03.018PMID:5667708.
27. Vaselli O, Capaccioni B, Tedesco D, Tassi F, Yalire MM, editors. The evil windı` (mazukus) at Nyira-gongo Volcano (Democratic Republic of Congo)2003.
28. Tedesco D, Vaselli O, Papale P, Carn SA, Voltaggio M, Sawyer GM, et al. January 2002 volcano-tec-tonic eruption of Nyiragongo volcano, Democratic Republic of Congo. Journal of Geophysical Research: Solid Earth. 2007; 112(B9).https://doi.org/10.1029/2006jb004762
29. Ross KA, Gashugi E, Gafasi A, Wuest A, Schmid M. Characterisation of the Subaquatic Groundwater Discharge That Maintains the Permanent Stratification within Lake Kivu; East Africa. Plos One. 2015; 10(3).https://doi.org/10.1371/journal.pone.0121217WOS:000351987300226. PMID:25799098 30. Ross KA, Smets B, De Batist M, Hilbe M, Schmid M, Anselmetti FS. Lake-level rise in the late
Pleisto-cene and active subaquatic volcanism since the HoloPleisto-cene in Lake Kivu, East African Rift. Geomorphol-ogy. 2014; 221:274–85.https://doi.org/10.1016/j.geomorph.2014.05.010.
31. Bompangue D, Giraudoux P, Handschumacher P, Piarroux M, Sudre B, Ekwanzala M, et al. Lakes as source of cholera outbreaks, Democratic Republic of Congo. Emerging Infectious Diseases. 2008; 14 (5):798–800. WOS:000255508300016.https://doi.org/10.3201/eid1405.071260PMID:18439365 32. Balagizi CM, Darchambeau F, Bouillon S, Yalire MM, Lambert T, Borges AV. River geochemistry,
chemical weathering, and atmospheric CO2 consumption rates in the Virunga Volcanic Province (East Africa). Geochemistry Geophysics Geosystems. 2015; 16(8):2637–60.https://doi.org/10.1002/ 2015gc005999WOS:000362365600011.
33. Ross KA, Gashugi E, Gafasi A, Wuest A, Schmid M. Characterisation of the Subaquatic Groundwater Discharge That Maintains the Permanent Stratification within Lake Kivu; East Africa. PloS one. 2015; 10(3):e0121217–e.https://doi.org/10.1371/journal.pone.0121217MEDLINE:25799098. PMID:
25799098
34. Smets B, Tedesco D, Kervyn F, Kies A, Vaselli O, Yalire MM. Dry gas vents ("mazuku") in Goma region (North-Kivu, Democratic Republic of Congo): Formation and risk assessment. Journal of African Earth Sciences. 2010; 58(5):787–98.https://doi.org/10.1016/j.jafrearsci.2010.04.008
WOS:000285122200007.
35. Galle B, inventorMethod and device for measuring emissions of gaseous substances to the atmosphere using scattered sunlight spectroscopy. United States2006 2006.
36. Galle B, Oppenheimer C, Geyer A, McGonigle AJS, Edmonds M, Horrocks L. A miniaturised ultraviolet spectrometer for remote sensing of SO2 fluxes: a new tool for volcano surveillance. Journal of Volcanol-ogy and Geothermal Research. 2003; 119(1):241–54.https://doi.org/10.1016/S0377-0273(02)00356-6.
37. Kaddumukasa M, Nsubuga D, Muyodi FJ. Occurence of Culturable Vibrio cholerae from Lake Victoria, and Rift Valley Lakes Albert and George, Uganda. Lakes & Reservoirs: Science, Policy and Manage-ment for Sustainable Use. 2012; 17(4):291–9.https://doi.org/10.1111/lre.12009
38. Takemura AF, Chien DM, Polz MF. Associations and dynamics of Vibrionaceae in the environment, from the genus to the population level. Front Microbiol. 2014; 5:38. Epub 2014/02/28.https://doi.org/10. 3389/fmicb.2014.00038PMID:24575082; PubMed Central PMCID: PMC3920100.
39. Huq A, Small EB, West PA, Huq MI, Rahman R, Colwell RR. Ecological relationships between Vibrio cholerae and planktonic crustacean copepods. Appl Environ Microbiol. 1983; 45(1):275–83. Epub 1983/01/01.https://doi.org/10.1128/AEM.45.1.275-283.1983PMID:6337551; PubMed Central PMCID: PMC242265.
40. Sims CA. Macroeconomics and Reality. Econometrica. 1980; 48(1):1–48.https://doi.org/10.2307/ 1912017
41. Ankamah S, Nokoe KS, Iddrisu WA. Modelling Trends of Climatic Variability and Malaria in Ghana Using Vector Autoregression. Malaria Research and Treatment. 2018; 2018:6124321.https://doi.org/ 10.1155/2018/6124321PMID:30002808
42. de Jong P, Penzer J. Diagnosing Shocks in Time Series. Journal of the American Statistical Associa-tion. 1998; 93(442):796–806.https://doi.org/10.1080/01621459.1998.10473731
43. Lu¨tkepohl H. New introduction to multiple time series analysis. Berlin: Springer-Verlag; 2005. 764 p.
44. Akaike H. Maximum Likelihood Identification of Gaussian Autoregressive Moving Average Models. Bio-metrika. 1973; 60(2):255–65.https://doi.org/10.2307/2334537
45. Hannan EJ, Quinn BG. The Determination of the Order of an Autoregression. Journal of the Royal Sta-tistical Society Series B (Methodological). 1979; 41(2):190–5.
46. Akaike H. Canonical Correlation Analysis of Time Series and the Use of an Information Criterion. In: Mehra RK, Lainiotis DG, editors. Mathematics in Science and Engineering. 126: Elsevier; 1976. p. 27–96.
47. Schwarz G. Estimating the Dimension of a Model. The Annals of Statistics. 1978; 6(2):461–4.
48. Granger CWJ. Investigating Causal Relations by Econometric Models and Cross-spectral Methods. Econometrica. 1969; 37(3):424–38.https://doi.org/10.2307/1912791
49. Colwell RR, Huq A. Environmental reservoir of Vibrio cholerae. The causative agent of cholera. Ann N Y Acad Sci. 1994; 740:44–54. Epub 1994/12/15.https://doi.org/10.1111/j.1749-6632.1994.tb19852.x
PMID:7840478.
50. Wu J, Yunus M, Ali M, Escamilla V, Emch M. Influences of heatwave, rainfall, and tree cover on cholera in Bangladesh. Environment International. 2018; 120:304–11.https://doi.org/10.1016/j.envint.2018.08. 012PMID:30107291
51. Baker-Austin C, TriO` anes J, Taylor N, Hartnell RE, Siitonen A, MartI`nez-Urtaza J, editors. Emerging Vibrio risk at high latitudes in response to ocean warming2013.
52. Levy S. Warming trend: how climate shapes Vibrio ecology. Environ Health Perspect. 2015; 123(4): A82–9. Epub 2015/04/02.https://doi.org/10.1289/ehp.123-A82PMID:25831488; PubMed Central PMCID: PMC4383571.
53. Hashizume M, Faruque ASG, Wagatsuma Y, Hayashi T, Armstrong B. Cholera in Bangladesh: Climatic Components of Seasonal Variation. Epidemiology. 2010; 21(5).
54. Sack DA, Sack RB, Nair GB, Siddique AK. Cholera. Lancet. 2004; 363(9404):223–33. Epub 2004/01/ 24.https://doi.org/10.1016/s0140-6736(03)15328-7PMID:14738797.
55. Ali M, Kim DR, Yunus M, Emch M. Time series analysis of cholera in Matlab, Bangladesh, during 1988– 2001. J Health Popul Nutr. 2013; 31(1):11–9. Epub 2013/04/27.https://doi.org/10.3329/jhpn.v31i1. 14744PMID:23617200; PubMed Central PMCID: PMC3702354.
56. Lipp EK, Huq A, Colwell RR. Effects of global climate on infectious disease: the cholera model. Clin Microbiol Rev. 2002; 15(4):757–70. Epub 2002/10/05.https://doi.org/10.1128/cmr.15.4.757-770.2002
PMID:12364378; PubMed Central PMCID: PMC126864.
57. Faruque SM, Naser IB, Islam MJ, Faruque AS, Ghosh AN, Nair GB, et al. Seasonal epidemics of chol-era inversely correlate with the prevalence of environmental cholchol-era phages. Proc Natl Acad Sci U S A. 2005; 102(5):1702–7. Epub 2005/01/18.https://doi.org/10.1073/pnas.0408992102PMID:15653771; PubMed Central PMCID: PMC547864.
58. Telford RJ, Barker P, Metcalfe S, Newton A. Lacustrine responses to tephra deposition: examples from Mexico. Quaternary Science Reviews. 2004; 23(23):2337–53.https://doi.org/10.1016/j.quascirev.2004. 03.014.
59. Anonymous. Deuxième enquête de´mographique et de sante´ (EDS-RDC II 2013–2014). Ministère du Plan et Suivi de la Mise enœuvre de la Re´volution de la Modernite´, 2014.
60. Totoiu A, Nenciu M-I, Nicolae CG. ASSESSING THE INTER-RELATIONS BETWEEN FISH HEALTH AND STOCK STATUS ON HUMAN HEALTH AND CONSUMER PERCEPTION. Scientific Papers-Series D-Animal Science. 2018; 61(2):268–73. WOS:000454345800047.
61. Kademi HI, Zebere GC, Guvenir M, Adun P, Susever S, Suer K. Prevalence of Vibrio Parahaemolyticus in Various Seafood Consumed in North Cyprus. Cyprus Journal of Medical Sciences. 2018; 3(2):54–8.
https://doi.org/10.5152/cjms.2018.338WOS:000444741800003.
62. Faja OM, Abd Sharad A, Younis KM, Alwan MG, Mohammed BJ, Ahmad A. Isolation, detection of viru-lence genes, antibiotic resistance genes, plasmid profile, and molecular typing among Vibrio parahae-molyticus isolated in Malaysian seawater from recreational beaches and fish. Veterinary World. 2019; 12(7):1140–9.https://doi.org/10.14202/vetworld.2019.1140-1149WOS:000478803100032. PMID:
31528045
63. Senderovich Y, Izhaki I, Halpern M. Fish as reservoirs and vectors of Vibrio cholerae. PLoS One. 2010; 5(1):e8607. Epub 2010/01/13.https://doi.org/10.1371/journal.pone.0008607PMID:20066040; PubMed Central PMCID: PMC2797615.
64. Tang JYH, Mat-Sa’ad SH, Banerjee SK, Ho LH, Son R. Survivability of Vibrio parahaemolyticus in satar and otak-otak, Malaysian fish-based street food. Int Food Res J. 2017; 24(3):1000–5.
WOS:000427097900014.
65. Ro SL, Woodburn M, editors. Survival of Vibrio parahaemolyticus in Korean-style salted oysters1976.
66. Ogur S, Erkan N. Microbiological and chemical quality of different types of salted pearl mullet (Chalcal-burnus tarichi Pallas, 1811). Journal of Food Safety. 2020; 40(1):e12717.https://doi.org/10.1111/jfs. 12717
67. Bwire G, Debes AK, Orach CG, Kagirita A, Ram M, Komakech H, et al. Environmental Surveillance of Vibrio cholerae O1/O139 in the Five African Great Lakes and Other Major Surface Water Sources in Uganda. Front Microbiol. 2018; 9:1560. Epub 2018/08/21.https://doi.org/10.3389/fmicb.2018.01560
PMID:30123189; PubMed Central PMCID: PMC6085420.
68. Oberbeckmann S, Fuchs BM, Meiners M, Wichels A, Wiltshire KH, Gerdts G. Seasonal dynamics and modeling of a Vibrio community in coastal waters of the North Sea. Microb Ecol. 2012; 63(3):543–51. Epub 2011/12/29.https://doi.org/10.1007/s00248-011-9990-9PMID:22202887.
69. Eyckmans L. Le problème du chole´ra en Afrique de l’Est. Bulletin des se´ances de l’acade´mie royale des sciences d’outre mer. 1979; 3:445–50.
70. Eeckels R. Chole´ra, in: Me´ decine et hygiène en Afrique Centrale de 1885ànos jours. Tropical Medi-cine. 1992;(2):1075–83.
71. Brassinne J. Courrier hebdomadaire du CRISP. 1971; 532(27):1–25.https://doi.org/10.3917/cris.532. 0001
72. Schyns C, Fossa A, Mutombo N, Kabuyahiya, Hennart P, Piot P, et al. Cholera in Eastern Zaire, 1978. Ann Soc Belg Med Trop. 1979; 59(4):391–400. Epub 1979/01/01. PMID:543736.
73. Capaccioni B, Vaselli O, Santo AP, Yalire MM. Monogenic and polygenic volcanoes in the area between the Nyiragongo summit crater and the Lake Kivu shoreline. Acta Vulcanologica. 2003; 14(1–2):129–36.
https://doi.org/10.1400/19086
74. Wauthier C, Cayol V, Kervyn F, d’Oreye N. Magma sources involved in the 2002 Nyiragongo eruption, as inferred from an InSAR analysis. Journal of Geophysical Research: Solid Earth. 2012; 117(B5).
https://doi.org/10.1029/2011jb008257
75. Balagizi CM, Kasereka MM, Cuoco E, Liotta M. Rain-plume interactions at Nyiragongo and Nyamula-gira volcanoes and associated rainwater hazards, East Africa. Applied geochemistry. 2017;2017 v. 81: pp. 14–89.https://doi.org/10.1016/j.apgeochem.2017.03.018PMID:5667708.
76. Muyembe JJ, Bompangue D, Mutombo G, Akilimali L, Mutombo A, Miwanda B, et al. Elimination of Cholera in the Democratic Republic of the Congo: The New National Policy. Journal of Infectious Dis-eases. 2013; 208:S86–S91.https://doi.org/10.1093/infdis/jit204WOS:000325766800013. PMID: