To cite this version : Schiemann, Daniel and Alphonse, Pierre and
Taberna, Pierre-Louis Synthesis of high surface area TiO2 coatings on
stainless steel by electrophoretic deposition. (2013) Journal of
Materials Research, vol. 28 (n° 15). pp. 2023-2030. ISSN 0884-2914
To link to this article : doi:
10.1557/jmr.2013.169
URL :
http://dx.doi.org/10.1557/jmr.2013.169
O
pen
A
rchive
T
OULOUSE
A
rchive
O
uverte (
OATAO
)
OATAO is an open access repository that collects the work of Toulouse researchers and
makes it freely available over the web where possible.
This is an author-deposited version published in :
http://oatao.univ-toulouse.fr/
Eprints ID : 13998
Any correspondance concerning this service should be sent to the repository
administrator:
[email protected]
Synthesis of high surface area TiO
2coatings on stainless steel by
electrophoretic deposition
Daniel Schiemann, Pierre Alphonse, and Pierre-Louis Tabernaa) Université de Toulouse, CIRIMAT UPS-CNRS, 31062 Toulouse cedex 9, France
Large surface area, homogenous, and adhesive TiO2coatings on stainless steel substrates were
prepared by electrophoretic deposition (EPD) of colloidal dispersions of TiO2nanoparticles in
water and ethanol. Several chemical additives were used to optimize the deposition process. The best results were obtained for dispersions in water containing a mixture of Tiron and Pluronic F127, which gave homogeneous layers, showing excellent adhesion and a large BET surface area, close to 200 m2/g. Ethanol dispersions also gave much adhesive coatings when poly(acrylic acid) was used as an additive. Nevertheless, their thickness was lower, and their surface area was less than 100 m2/g. We have shown that water splitting, occurring in the aqueous sol during the EPD, led to deposited masses lower than those expected from the Hamaker law. However, the electrolysis of water and also the small cracks in the coatings had no detrimental effects on adhesion.
I. INTRODUCTION
Large surface area and controlled porosity titanium dioxide is an interesting catalyst support because enhanced activity and selectivity have been observed with the group VIII A metals (Fe, Ni, Pd, Pt,. . .), which was explained by the so-called “strong-metal support interaction” (SMSI).1,2 Moreover, TiO2is also the object of great interest for solar
cell and photocatalysis applications.3,4
The final purpose of the work reported here is the de-position of catalytic layers on metallic structured reactors. These devices are built by stacking metallic plates in-corporating narrow parallel channels coated with a thin layer of catalyst.5–7They have many advantages like en-hanced heat and mass transfer, excellent safety, and quick response time.
For the application of catalytic TiO2 layers onto
me-tallic substrates, the electrophoretic deposition technique (EPD) is very versatile. The working principle of EPD is based on the movement of charged particles in an electric field. The particles move toward the working electrode due to the applied cell voltage and their accumulation on this electrode leads to the formation of a homogeneous layer. This process has several advantages: it is cost effective and it is also possible to coat complex shaped substrates, be-sides simple planar substrates. Rather large thicknesses, up to several millimeters can be reached for the coatings,8in contrast to coatings done with the dip-coating technique, where the thickness for one single dipping cycle is
gener-ally limited to a few micrometers.9–11Another advantage of EPD is that the porosity of the coatings can be finely tuned, depending on the experimental conditions.
The dependence of the deposited mass on the EPD parameters is given by the Hamaker law12(Eq. 1).
w¼ Zt
t0
l E A c dt : ð1Þ
where w is the deposit yield (in g), E is the electric field strength (in V/m), l is the electrophoretic mobility (in m2/V/s), A is the surface area of the electrode (in m2), c is the particle mass concentration in the suspension (in g/L), and t is the deposition time (in s).
For industrial applications, water is preferred as a sol-vent because it is cheap, nontoxic, and has a high relative permittivity (80.1 at 20 °C). However, when the cell volt-age exceeds the water splitting potential (#1.23 V at 25 °C), gas evolution is expected to occur at the electrodes. The formation of H2-gas on the deposition cathode is
re-ported to have detrimental effects on the coatings because the gas bubbles prevent good adhesion to the substrate and lead to cracks in the deposit.13Numerous techniques have been developed to overcome this problem, e.g., the de-position on a microporous membrane,14 on palladium electrodes,13the application of voltage pulses,15or the use of porous molds to minimize the gas evolution.16 Nevertheless, to avoid this problem, more often organic solvents are used.12,17–19
A dispersion used for EPD should have a good sta-bility and the particles should have a high electrophoretic mobility,20often calculated using the Henry equation12:
a)
Address all correspondence to this author. e-mail: [email protected] DOI: 10.1557/jmr.2013.169
l¼2 3
e0erf
g fðjrÞ ; ð2Þ
where l is the electrophoretic mobility (in m2/V/s), e0is
the vacuum permittivity (8.8542 10#12F/m), eris the
relative permittivity of the solvent, f is the zeta potential (in V), g is the solvent dynamic viscosity (in Pa s) and f(jr) is the Henry function, which depends both on the thickness of the double layer (1/j) and on the core radius (r) of the particle. This equation leads to two limiting cases: for small jr (small particles in a low dielectric constant media), the Henry function is close to 1, which corresponds to the so-called Huckel limit, whereas for large jr (aqueous media with a moderate electrolyte concentration), the Henry function approaches 1.5, which corresponds to the Smoluchowsky limit. From Eq. (2), it can be concluded that an EPD suspension should have a low viscosity, a high relative permittivity, and a high zeta potential to get the highest electrophoretic mobility.
In this work, EPD was performed using two kinds of TiO2suspensions. First, colloidal dispersions of TiO2
nano-particles in water synthesized by hydrolysis of a Ti-alkoxide, and second, dispersions of the same TiO2nanoparticles in
ethanol. The EPD with dispersions of nanopowders has already been reported17,21,22but only rarely with colloidal suspensions synthesized from a sol–gel process23,24 Dispersions prepared by the sol–gel method have the advantage of being stable, without the necessity to add dispersants. Furthermore, the very small particle size of these colloids allows tuning the porosity on a wider range.
In order to improve the dispersion stability, the adhe-sion of the coatings and to reduce the formation of cracks, five different chemical additives were selected in this study: Tiron, Pluronic F127, polyethyleneimine (PEI), the poly (acrylic acid) (PAA) sodium salt, and carboxymethyl cellu-lose (CMC) sodium salt. These additives lead in preliminary experiments to the best EPD coatings considering the three criteria: thickness, adherence, and surface area.
The sodium salt of poly(acrylic acid) (PAA) is used as an organic binder in aqueous TiO2dispersions.25–28It
im-proves the stability of dispersions, thanks to its ionizable carboxylate groups. In the literature, it is generally used for dispersions in water.
Polyethyleneimine (PEI) is a polyelectrolyte with pri-mary, secondary, and tertiary amine groups in the ratio 1:2:1. It is considered as a good EPD additive to disperse nano-TiO2 and therefore also called a universal EPD
agent.29It was reported that it could create a positive zeta potential for TiO2dispersions on the whole pH range.
30,31
The Tiron (1.2-dihydroxybenzene-3.5-disulfonic acid) is a salt used to disperse TiO2nanoparticles. It improves
the stability and electrophoretic mobility of the dispersions used for EPD.21In the literature, it is reported that Tiron
adsorbs to metal atoms like aluminum or titanium through a negatively charged complex using the hydroxyl groups.32 The polyelectrolyte carboxymethyl cellulose (CMC) is used as a binder to improve the adherence of TiO2
par-ticles on the substrate.33,34
Pluronic F127 is a hydrophilic nonionic surfactant. This is a ABA type triblock copolymer, where A is made of hydrophilic poly(ethylene oxide) (PEO) and B of more hydrophobic poly(propylene oxide) (PPO). The average number of EO units in the PEO blocks is 101, whereas the average number of PO units in the PPO blocks is 56.35We used it to increase the porosity and the adhesion of the coatings.36
II. MATERIALS AND METHODS A. Synthesis of EPD dispersions
The TiO2 colloidal dispersion used for the EPD was
synthesized by hydrolysis of Ti-isopropoxide (.98%, Acros Organics, Geel, Belgium) in a large excess of di-luted aqueous nitric acid (68%, Acros Organics) solution (H2O/Ti$ 90 and H1/Ti 5 0.2) as described in one of our
previous publications.37 The pH of the dispersion was about 1.4, and the molar concentration of Ti was in the range of 0.6–0.65 M.
All the additives were introduced into the TiO2
col-loidal dispersion after its synthesis. In Table I, the con-centrations of the additives are always given with respect to the mass of TiO2in the dispersion. Poly(acrylic acid)
sodium salt (PAA, MW 5100 g/mol, Fluka, Lyon, France) was dissolved in water and added to the TiO2
dispersion. Polyethyleneimine (PEI, 50 wt% aqueous solution, branched, MW 60000 g/mol, Acros Organics) was further diluted with water before it was added to the dispersion. Carboxymethyl cellulose sodium salt (CMC, MW 90000 g/mol, degree of substitution 0.60–0.95, Fluka) was dissolved in water and added to the dispersion. Pluronic F127 (MW ; 12,600 g/mol, Sigma, Lyon, France) was added as a powder to the TiO2-dispersion with
a concentration of 44 wt%. Tiron (Acros Organics) was added as a powder to the sol in a concentration of 0.1 wt%. After the introduction of the additives, the dispersions were stirred for at least 24 h before further use.
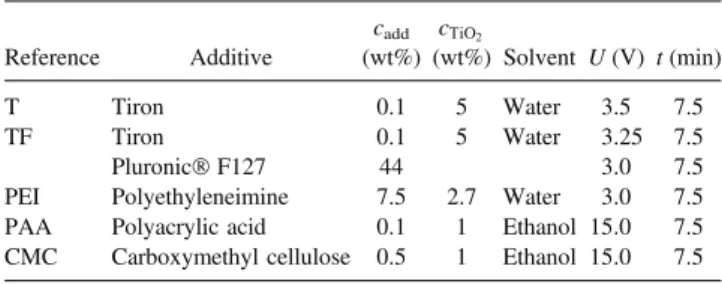
TABLE I. Dispersions used for the EPD experiments. cadd is the
additive concentration (in wt% relative to the amount of TiO2in the
dispersion). U is the optimum EPD voltage. t is the deposition time.
Reference Additive cadd (wt%) cTiO2 (wt%) Solvent U (V) t (min) T Tiron 0.1 5 Water 3.5 7.5 TF Tiron 0.1 5 Water 3.25 7.5 Pluronic F127 44 3.0 7.5
PEI Polyethyleneimine 7.5 2.7 Water 3.0 7.5 PAA Polyacrylic acid 0.1 1 Ethanol 15.0 7.5 CMC Carboxymethyl cellulose 0.5 1 Ethanol 15.0 7.5
B. Dispersions in ethanol
The dispersions in ethanol were prepared by drying the colloidal hydrosols at 40 °C until 10 wt% of residual water was left. This paste was dispersed in ethanol by ultra-sonication for 10 min (Branson 1510 Ultrasonic Cleaner, Danbury, CT, 42 kHz), followed by dispersion with an Ultra-Turrax IKA T25 Homogenizer (Staufen, Germany) for 5 min at 15,000 rpm. The TiO2concentration in these
ethanol dispersions was 1 wt%. C. Electrophoretic deposition
For the EPD experiments, constant voltage conditions were used. The setup consisted of a 50 mL beaker as the EPD cell (filled with 10 mL of the TiO2dispersion), a
holder for the electrodes, which was made of two alligator clips attached to an epoxide block, a platinum mesh as the counter electrode, a 316 L stainless steel substrate (15 20 1 mm) as the working electrode, a DC Power Supply Xantrex XFR 600-2 (Burnaby, Canada; used for the higher voltage range), a Source Meter Keithley 2611A (Cleveland, OH; used as the DC source for the voltage range 2–5 V) and a Multimeter ITC 580 (Grote, Lillois, Belgium) to measure the current. The active surface area was kept constant (1.5 cm2) by using a mask (adhesive tape). The distance between the electrodes was fixed at 2.0 cm.
For each dispersion, the optimum voltage (1.5 V up to 50 V) was determined in a preliminary work (not pre-sented here for the sake of clarity). Different deposition times, TiO2 concentrations, and additive concentrations
were tested. The criteria of choice were the thickness, the homogeneity, and the adherence of the coatings. The op-timized EPD parameters from this previous study are summarized in Table I.
D. Pre- and posttreatment of substrates
Prior to each EPD, the steel substrates were immersed in a degreasing solution (Turco 4181, Henkel, Düsseldorf, Germany) at 80 °C for 1 h. After thorough washing with deionized water, the substrates were immersed for 10 min in an ultrasonic bath in an ethanol–acetone mixture (1:1) and finally dried at 80 °C.
After EPD, the coated substrates were dried for 1 h at 40 °C and then heated in air at 350 °C for 2 h in a furnace to remove the additives and to improve the adherence of the deposits.
E. Characterization techniques
For imaging, the EPD coatings and for some thickness measurements, an Optical Microscope Keyence VHX 1000 (Itasca, IL) with the VH-Z100R objective (VH-Z500R for 5000x magnification) was used. Thickness measurements were done with an Interferometer-Profilometer (Zygo New View 100, Middlefield, CT).
A cross-section was prepared by embedding the piece in an epoxy resin (Struers EpoFix) followed by abrasion
of several mm (with 120 lm grain) and polishing (down to 10 lm grain using Escil diamond spray), both done by a lapping machine (Struers, TegraPol-15, Champigny sur Marne, France).
BET surface measurements were carried out with a gas adsorption analyzer Micromeritics ASAP 2010. Krypton was used as the adsorption gas. Before the analysis, the samples were degassed by heating under vacuum (1 Pa) at 300 °C for 2 h.
The electrophoretic mobility and the particle size were measured with a Malvern instrument (Zetasizer Model ZEN3691, Worcestershire, UK). A polycarbonate folded capillary cell (DTS 1061) was used.
To estimate the adhesion of the EPD coatings on the substrate, the following adhesion test was done: the coated substrates after the posttreatment were dropped through a 30-cm-long vertical cylinder; the mass of the substrate before and after the drop was compared. From the mass difference, the adhesion of the coating on the steel sub-strate was estimated.
III. RESULTS AND DISCUSSION
A. Characterization of the TiO2dispersions
The colloidal dispersions in water are composed of ag-gregates, with a chain-like structure, of anatase (;90%) and brookite crystallites (5–6 nm). Stable sols composed solely of anatase crystallites (4 nm) can be prepared by complexing partially the TIP by acetylacetone before hydrolysis.37
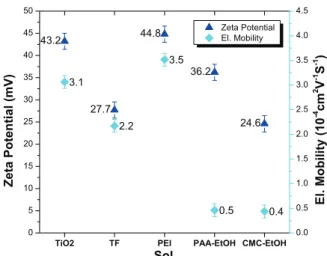
Electrophoretic mobilities of the different suspensions are reported in Fig. 1. The electrophoretic mobility is a very important characteristic of the suspensions used for EPD because it has a main influence on the deposition kinetics.12 Except for PEI, the additives decreased the electrophoretic mobility. The zeta potential, calculated from the electrophoretic mobility Eq. (2), was also reported in Fig. 1. We see that all zeta potentials are high enough to
FIG. 1. Electrophoretic mobility measurement and zeta potential of EPD suspensions.
prevent the dispersions from agglomeration for the time needed for the deposition.
The average particle size, measured for the various dispersions, is shown in Fig. 2. For the aqueous colloidal dispersion without additives, the measured particle size was 15 nm. Addition of PEI decreased this value to 10 nm. The smallest particle size (5 nm) was measured for the TF dispersion. This value is very close to the size of the pri-mary particles,37which indicates a very good dispersion. The dispersions in ethanol were not as good as with a particle size close to 20 nm.
B. Images of the TiO2deposits
The EPD coatings after the thermal posttreatment at 350 °C in air were observed with an optical microscope (Fig. 3.1). All coatings showed cracks, which appeared after the calcination at 350 °C. The coatings prepared from the aqueous sols exhibited very fine cracks, whereas large cracks were formed on layers produced by ethanol disper-sions. This difference is probably due to the faster evapo-ration and different surface tension of ethanol.
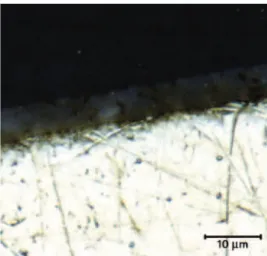
An optical microscope image of a cross-section of the TF coating is given in Fig. 3.2. It shows that the interface between the TiO2 film and the stainless steel
substrate (bottom part) was very good; the TiO2 layer
closely followed the roughness of the substrate. The coating thickness was in the range of 4–6 lm.
C. EPD experiments
All EPD experiments were done under constant voltage conditions.38 It was observed that the deposition rate decreases with increasing time (Fig. 4). This may occur because the poor conductive TiO2 layer, forming on the
working electrode, leads to an increase of resistance and a decrease of the electric field.39Besides, the depletion of the TiO2 concentration in the vicinity of the working
electrode could have a similar effect. The T-sol plot is not
shown for time exceeding 600 s because, in this case, the coated mass could not be properly measured due to the bad adhesion of the layer.
For better comparison, the deposited mass was divided by the electrode surface, the applied voltage, and the initial TiO2concentration. The highest deposited masses
were reached for the coatings made with aqueous dis-persions, the best being the T-sol followed by the TF-sol.
FIG. 2. Particle size measurement of EPD suspensions.
FIG. 3.1. Optical microscope images of EPD coatings after thermal posttreatment at 350 °C in air. (a) TF-Sol; (b) PEI-Sol; (c) PAA-Sol; (d) CMC-Sol (See Table I for the description of EPD parameters).
FIG. 3.2. Optical microscope images of a cross-section of a TF-coating after calcination at 350 °C (deposition time 5 5 min, other EPD parameters as given in Table I). The bottom part of the image is the stainless steel substrate.
However, F127 decreases the electrophoretic mobility, which explains the lower deposition rate of the TF-sol in comparison to the T-sol. The dispersions in ethanol gave lower deposited masses. The deposition rates, calculated from the slopes of the fitted curves (see Fig. 4), are re-ported in Table II. The highest deposition rates were obtained with the T- and the TF-sol. These deposition rates are still rather high after a deposition time of 600 s. Considering the other sols, the highest initial deposition rate was obtained with the PEI-sol. However, the rate became lower than the rates of the CMC- and PAA-sol for a deposition time exceeding 600 s. During the process, the deposition rates decreased continuously until finally the deposition curves of PEI-, CMC- and PAA-sol reached a plateau.
As the ethanol dispersions have lower electrophoretic mobilities lel (Fig. 1) than the water dispersions, higher
voltages are needed to obtain comparable deposition rates. Furthermore, it can be assumed that the effect of water splitting is much higher for the aqueous dispersions than in ethanol, where no gas evolution was observed. The effect of water splitting on the deposition process is complex because it could lower the current used for the electro-phoresis, but it also raises the pH, destabilizing locally the dispersion, which can lead to aggregation in the vicinity of
the working electrode. Finally, as reported in the literature, the gas bubbles could negatively affect the adhesion on the substrate.
The measured deposited mass curves were fitted with an exponential function as a basic model in an attempt to model the deposition process40[Eq. (3)]. This model takes into account only the depletion of the particle concentra-tion during the EPD.
m¼ m0 1# e#
t r
! "
: ð3Þ
In Eq. (3), m0is the initial mass of TiO2in the sol (in g),
and s is the time constant: s¼ V d
le U ; ð4Þ
where V (cm3) is the volume of the dispersion, and d (cm) is the electrode distance.
The best fitting parameters m0 and s are reported in
Table III and compared with the experimental values. Obviously, though this model could represent the trend of the deposition process, the large discrepancy between fitted and experimental parameters indicates that the model is too simplified. The electric field is considered as constant during the deposition, and the diffusion lim-itation due to a concentration gradient is not taken into account. It ignores the resistivity of the deposit and the water splitting.
D. Comparison with the Hamaker law
To estimate the effect of water splitting, we have compared the experimental deposited masses with the values predicted by the Hamaker law [Eq. (1)]. For the PAA-dispersion in ethanol (Fig. 5), for lower de-position times, the first part of the dede-position curve is close to the curve calculated using the Hamaker law. In contrast, for the aqueous TF-sol, the deposited masses are far lower than those predicted by the Hamaker law. This can be ex-plained because, in aqueous dispersions, a lot of charges are not used for deposition but for water splitting. For longer deposition times, a divergence in the deposited mass compared with the Hamaker law is expected because
FIG. 4. Specific deposited mass versus deposition time t, 5 different additive combinations were used. The deposited mass was divided by the electrode surface, the EPD voltage, and the TiO2concentration. For
ex-planation of the labels and concentrations, refer to Table I.
TABLE II. Deposition rates, obtained from the slopes of the fitted curves in Fig. 4; r0is the initial deposition rate and r600the deposition
rate at 600 s. Sol r0(10#4mg/cm 2 /V/g/L/s) r600(10#4mg/cm 2 /V/g/L/s) T 5.6 3.3 TF 4.2 2.4 PAA 1.6 0.8 PEI 3.3 0.5 CMC 2.1 0.9
TABLE III. Parameters obtained from the fitting (fit) compared with experimental values (exp).
m0(fit) m0(exp) s (fit) s (exp) R2 (mg) (mg) (s) (s) PAA 1.9 67 661 28,866 0.939 PEI 0.8 180 309 18,966 0.954 TF 7.6 333 1122 28,319 0.995 T1 10.5 333 1023 15,600 0.990 CMC 2.3 67 711 30,553 0.993
of the depletion of the TiO2concentration in the vicinity of
the working electrode and probably also because of the increasing resistivity of the deposit.
E. Characterization of the EPD coatings
The thickness (tm in Fig. 6) was measured using an
Interferometer-Profilometer for the coatings from the TF and PAA dispersions. For the coatings from the CMC and PEI dispersions, this measurement technique failed to give reliable results because the coatings were transparent. In these cases, the thickness was determined with an optical microscope.
Furthermore, an average thickness can be calculated from the mass of the coatings using Eq. (5), when the density and the porosity are known.
tc¼
m
qð1 # uÞA : ð5Þ
where tcis the calculated thickness (in cm), m is the
de-posited mass (in g), q is the deposit density (in g/cm3), u is the porosity, and A is the coating area (in cm2).
The density q was assumed to be the same as the density of a powder sample prepared by drying and calcinating the dispersion at 350 °C. The density of these powder samples was measured with a gas pycnometer using He (Table IV). For the porosity u, we used values reported in a previous work,36i.e., 0.5 for the TF coatings and 0.3 for the other coatings.
In Fig. 6, the measured thickness tmis compared with
the thickness tccalculated with Eq. (4). It can be seen that
the water dispersions (TF and PEI) gave the thickest coat-ings (close to 10 lm for TF). For the TF coating, the thick-ness, determined with the interferometer, was comparable to the thickness obtained from the cross-section (Fig. 3.2). The calculated thicknesses of the TF coatings were larger than the measured values. Perhaps it is because their real porosity was lower than that estimated for calculation. To measure the real porosity by nitrogen adsorption, a much higher deposit mass would be needed. A better agreement between calculated and measured values was observed for the coatings prepared from the PAA and CMC dispersions. The coatings obtained from the T-sol have not been re-ported in Fig. 6 because their bad adhesion precludes thick-ness measurements.
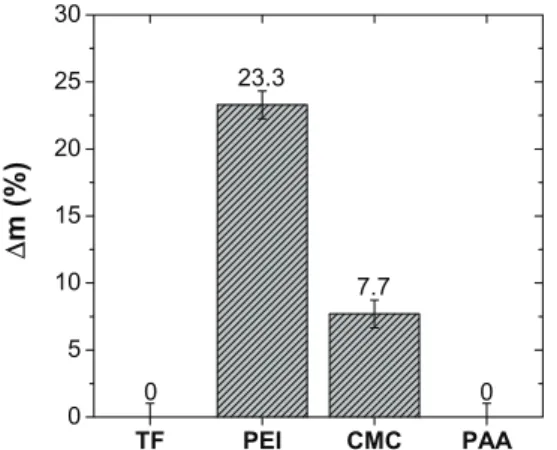
To evaluate the coating adhesion, we used a simple method, in which we measured the mass loss after drop-ping the samples from a height of 30 cm. From the mass difference before and after the drop, we calculated the relative mass difference Dmrel(in %), as shown in Fig. 7.
Preliminary experiments with the TF dispersion have already revealed that Pluronic F127 improves the adhe-sion of the deposit. This was confirmed here as the TF and PAA coatings did not lose any mass. The worst adhesion was observed for the CMC and PEI coatings. The good result with the aqueous TF-sol demonstrates that the water electrolysis, occurring during the EPD of the TF-sol, has no negative effect on the adhesion.
FIG. 5. Deposition curves of the PAA-sol and the TF-sol compared with those calculated using the Hamaker law.
FIG. 6. Measured thickness tm and calculated thickness tc versus
deposition time t. The thickness was measured either with an Interferometer-Profilometer (IP) or with an optical microscope (Mic) as indicated in brackets: TF (IP), PAA (IP), CMC (Mic), PEI (Mic). For explanation of the labels, refer to Table I.
TABLE IV. Densities q of the TiO2powders prepared by drying and
calcination of the dispersions at 350 °C.
Powder q (g/cm3) TF 3.70 6 0.12 T 3.48 6 0.10 PAA 3.38 6 0.01 PEI 3.18 6 0.10 CMC 3.51 6 0.01
The coatings obtained from the T-sol have not been reported in Fig. 7 because their adhesion is so bad that Dmrelwas close to 100%.
F. BET surface area
The surface area is a key parameter for catalytic appli-cations. As the amount of coating on a substrate was very low (1–5 mg), the surface area was measured using Krypton as the adsorbate. Figure 8 shows the BET surface area of the EPD coatings compared with the BET surface area of the dried powders prepared as described in the previous paragraph.
The highest surface areas (180–200 m2/g) were mea-sured for the TF and CMC coatings, whereas the lowest surface area was obtained for the PAA coatings. When we found that the surface area of the coating was lower than that of the powder, it indicates that some parts of the coating were not accessible to the adsorbate. It can be
in-ferred that the porosity shrunk during the coating process. Conversely, when the surface area of the coating was larger than that of the powders (in the case of CMC), it can be inferred that the coating process increased the porosity. This can be due to either the formation of bubbles produced by water splitting or the presence of cracks. IV. CONCLUSION
The best coatings on stainless steel substrates synthe-sized by EPD for catalytic applications were obtained from colloidal dispersions of TiO2nanoparticles in water
containing Tiron and Pluronic F127 as additives. These coatings were homogeneous, exhibited a very good adher-ence on the substrate, and a large BET surface area close to 200 m2/g, which is even larger than the values obtained from equivalent powders. For a deposition time of 10 min, a thickness of 10 lm can be reached, which is perfectly appropriate for structured reactors in catalytic applications. Ethanol dispersions also gave much adhesive coatings, when PAA was used as an additive. However, the thickness was only 4 lm after 10 min of deposition, and their surface area was lower than 100 m2/g. We have shown that water splitting, occurring in the aqueous sol during EPD, led to deposited masses lower than those predicted by the Hamaker law. However, the electrolysis of water and also the small cracks, which appeared in the EPD coatings, have no negative effects on the adhesion. Small cracks could even be useful for further catalytic applications because they can increase the macroporosity and improve in that way the reactant accessibility inside the mesopores. Ongoing works are in progress to improve the understand-ing of the deposition mechanism.
REFERENCES
1. S.J. Tauster, S.C. Fung, and R.L. Garten: Strong metal-support interactions. Group 8 noble metals supported on titanium dioxide. J. Am. Chem. Soc. 100, 170 (1978).
2. O. Dulub, W. Hebenstreit, and U. Diebold: Imaging cluster surfaces with atomic resolution: The strong metal-support interaction state of Pt supported on TiO2(110). Phys. Rev. Lett. 84, 3646 (2000).
3. M.R. Hoffmann, S.T. Martin, W. Choi, and D.W. Bahnemann: Environmental applications of semiconductor photocatalysis. Chem. Rev. 95, 69 (1995).
4. C.J. Barbé, F. Arendse, P. Comte, M. Jirousek, F. Lenzmann, V. Shklover, and M. Grätzel: Nanocrystalline titanium oxide electrodes for photovoltaic applications. J. Am. Ceram. Soc. 80, 3157 (1997).
5. K. Haas-Santo, M. Fichtner, and K. Schubert: Preparation of microstructure compatible porous supports by sol–gel synthesis for catalyst coatings. Appl. Catal., A 220, 79 (2001).
6. G. Kolb and V. Hessel: Micro-structured reactors for gas phase reactions. Chem. Eng. J. 98, 1 (2004).
7. J. Thormann, P. Pfeifer, K. Schubert, and U. Kunz: Reforming of diesel fuel in a micro reactor for APU systems. Chem. Eng. J. 135(Suppl 1), S74 (2008).
8. T. Uchikoshi, T.S. Suzuki, F. Tang, H. Okuyama, and Y. Sakka: Crystalline-oriented TiO2fabricated by the electrophoretic deposition
in a strong magnetic field. Ceram. Int. 30, 1975 (2004). FIG. 7. Adhesion test showing the relative mass difference Dm, which
is the mass difference between the sample mass before and after the 30-cm drop divided by the mass of the coatings. A value of 0 indicates that no mass loss was observed during the test.
FIG. 8. Measured BET surface areas. Refer to Table I for explanation of the labels. For comparison, the value measured with a dispersion without additive is also shown.
9. N. Negishi, K. Takeuchi, and T. Ibusuki: Preparation of the TiO2
thin film photocatalyst by the dip-coating process. J. Sol-Gel Sci. Technol. 13, 691 (1998).
10. Y. Takahashi and Y. Matsuoka: Dip-coating of TiO2films using a
sol derived from Ti(O-i-Pr)4-diethanolamine-H2O-i-PrOH system.
J. Mater. Sci. 23, 2259 (1988).
11. T. Watanabe, S. Fukayama, M. Miyauchi, A. Fujishima, and K. Hashimoto: Photocatalytic activity and photo-induced wettabil-ity conversion of TiO2thin film prepared by sol-gel process on
a soda-lime glass. J. Sol-Gel Sci. Technol. 19, 71 (2000). 12. L. Besra and M. Liu: A review on fundamentals and applications of
electrophoretic deposition (EPD). Prog. Mater. Sci. 52, 1 (2007). 13. T. Uchikoshi, K. Ozawa, B.D. Hatton, and Y. Sakka: Dense,
bubble-free ceramic deposits from aqueous suspensions by elec-trophoretic deposition. J. Mater. Res. 16, 321 (2001).
14. A. Nold and R. Clasen: Bubble-free electrophoretic shaping from aqueous suspension with micro point-electrode. J. Europ. Cer. Soc. 30, 2971 (2010).
15. B. Neirinck, J. Fransaer, O.V. Biest, and J. Vleugels: Aqueous electrophoretic deposition in asymmetric AC electric fields (AC-EPD). Electrochem. Commun. 11, 57 (2009).
16. M. Ryan Perera: Pottery section-fabrication by electrophoresis. Trans, J. Brit. Cer. Soc. 80, 46 (1981).
17. C. Lin, T. Yang, Y. Feng, T. Tsung, and C. Su: Characterization of elecrophoretically deposited nanocrystalline titanium dioxide films. Surf. Coat. Technol. 200, 3184 (2006).
18. B. Ferrari, R. Moreno, P. Sarkar, and P. Nicholson: Electrophoretic deposition of MgO from organic suspensions. J. Eur. Ceram. Soc. 20, 99 (2000).
19. T. Moskalewicz, A. Czyrska-Filemonowicz, and A.R. Boccaccini: Microstructure of nanocrystalline TiO2films produced by
electro-phoretic deposition on Ti-6Al-7Nb alloy. Surf. Coat. Technol. 201, 7467 (2007).
20. Y. Castro, B. Ferrari, R. Moreno, and A. Durán: Electrophoretic deposition (EPD) coatings of sol-gel solutions and suspensions. J. Sol-Gel Sci. Technol. 23, 187 (2002).
21. S. Lebrette, C. Pagnoux, and P. Abélard: Fabrication of titania dense layers by electrophoretic deposition in aqueous media. J. Eur. Ceram. Soc. 26, 2727 (2006).
22. H. Abdullah and C. Sorrell: TiO2thick films by electrophoretic
deposition. J. Aust. Ceram. Soc. 44, 12 (2008).
23. Y. Castro, B. Ferrari, R. Moreno, and A. Durán: Coatings produced by electrophoretic deposition from nano-particulate silica sol–gel suspensions. Surf. Coat. Technol. 182, 199 (2004).
24. G-J. Wang and S-W. Chou: Electrophoretic deposition of uniformly distributed TiO2 nanoparticles using an anodic aluminum oxide
template for efficient photolysis. Nanotechnology 21, 115206 (2010).
25. K. Sato, S. Kondo, M. Tsukada, T. Ishigaki, and H. Kamiya: Influence of solid fraction on the optimum molecular weight of polymer dispersants in aqueous TiO2 nanoparticle suspensions.
J. Am. Ceram. Soc. 90, 3401 (2007).
26. R. Sakamoto, H. Nishimori, M. Tatsumisago, and T. Minami: Preparation of titania thick films by electrophoretic sol-gel deposi-tion using hydrothermally treated particles. Nippon seramikkusu kyokai gakujutsu ronbunshi 106, 1034 (1998).
27. H. Kamiya and M. Iijima: Surface modification and character-ization for dispersion stability of inorganic nanometer-scaled particles in liquid media. Sci. Technol. Adv. Mater. 11, 044304 (2010).
28. S. Liufu, H. Xiao, and Y. Li: Adsorption of poly(acrylic acid) onto the surface of titanium dioxide and the colloidal stability of aqueous suspension. J. Colloid Interface Sci. 281, 155 (2005).
29. Y. Fukada, N. Nagarajan, W. Mekky, Y. Bao, H.S. Kim, and P. Nicholson: Electrophoretic deposition—mechanisms, myths and materials. J. Mater. Sci. 39, 787 (2004).
30. C. Sentein, B. Guizard, S. Giraud, C. Yé, and F. Ténégal: Dispersion and stability of TiO2nanoparticles synthesized by laser
pyrolysis in aqueous suspensions. J. Phys. Conf. Ser. 170, 012013 (2009).
31. F. Tang, T. Uchikoshi, K. Ozawa, and Y. Sakka: Effect of polyethylenimine on the dispersion and electrophoretic deposition of nano-sized titania aqueous suspensions. J. Eur. Ceram. Soc. 26, 1555 (2006).
32. R. Laucournet, C. Pagnoux, T. Chartier, and J-F. Baumard: Coagulation method of aqueous concentrated alumina suspensions by thermal decomposition of hydroxyaluminum diacetate. J. Am. Ceram. Soc. 83, 2661 (2000).
33. M. Mancini, F. Nobili, R. Tossici, and R. Marassi: Study of the electrochemical behaviour at low temperatures of green anodes for lithium ion batteries prepared with anatase TiO2and water soluble
sodium carboxymethyl cellulose binder. Electrochim. Acta 85, 566–571 (2012).
34. W. Zhao, Z. Bai, A. Ren, B. Guo, and C. Wu: Sunlight photo-catalytic activity of CdS modified TiO2loaded on activated carbon
fibers. Appl. Surf. Sci. 256, 3493 (2010).
35. BASF: Pluronic F127 Technical Bulletin. (BASF, Nienburg, Germany, 2012). http://worldaccount.basf.com/wa/NAFTA;en_US/ Catalog/ChemicalsNAFTA/pi/BASF/Brand/pluronic
36. R. Bleta, P. Alphonse, and L. Lorenzato: Nanoparticle route for the preparation in aqueous medium of mesoporous TiO2 with
controlled porosity and crystalline framework. J. Phys. Chem. C 114, 2039 (2010).
37. P. Alphonse, A. Varghese, and C. Tendero: Stable hydrosols for TiO2coatings. J. Sol-Gel Sci. Technol. 56, 250 (2010).
38. P. Sarkar and P.S. Nicholson: Electrophoretic deposition (EPD): Mechanisms, kinetics, and application to ceramics. J. Am. Ceram. Soc. 79, 1987 (1996).
39. C. Baldisserri, D. Gardini, and C. Galassi: An analysis of current transients during electrophoretic deposition (EPD) from colloidal TiO2suspensions. J. Colloid Interface Sci. 347, 102
(2010).
40. B. Ferrari, R. Moreno, and J.A. Cuesta: A resistivity model for electrophoretic deposition. Key Eng. Mater. 314, 175 (2006).