Published in Crystal Growth & Design (2011), vol. 11, pp. 1091-1097
cover page
Czochralski crystal growth, thermal conductivity and magnetic
properties of Pr
xLa
1-xAlO
3, where x = 0, 0.75, 0.55, 0.40, 1
S. Turczynski,† D. A. Pawlak,† R. Diduszko,† M. Pękała§, J. Mucha‡, J.F. Fagnard** , Ph. Vanderbemden**, M. A. Carpenter♦
†
Institute of Electronic Materials Technology (ITME), ul. Wolczynska 133, 01-919 Warsaw, Poland
§
Chemistry Dept., Warsaw University, Al. Zwirki i Wigury 101, Pl-02-093, Warsaw, Poland
‡Institute of Low Temperature and Structure Research, PAN, 50-950 Wrocław 2, Poland **
SUPRATECS, Montefiore Electricity Institute, B28, University of Liege, B-4000 Liege, Belgium
♦
Department of Earth Sciences, University of Cambridge,Downing Street, Cambridge, CB2 3EQ, U.K.
Corresponding author: Sebastian Turczynski
Institute of Electronic Materials Technology ul. Wolczynska 133
01-919 Warsaw Poland
Ph.: +48 22 8349949, +48 22 8353041 ext 175, E-mail: Sebastian.Turczynski@itme.edu.pl
Abstract. Crystals of PrxLa1-xAlO3 solid solution have been grown by the Czochralski method for the first time, to
our knowledge. Crystals with high praseodymium concentration tend to grow spirally. The colors of the crystals change with chemical composition. X-ray diffraction shows an increase of the lattice constants with an increase of lanthanum ion concentration. The thermal conductivity has been investigated in the temperature range 5 to 300 K. Completely different behaviour of thermal conductivity is observed at low temperatures for the investigated crystals, while it remains roughly constant at high temperatures. The values of magnetic susceptibility lies within the expected range that could be expect for a paramagnetic material.
Photo of Pr0.55La0.45AlO3 crystal with the iridium wire as a seed and other PrxLa1-xAlO3 solid solution crystals grown by the Czochralski method.
Published in Crystal Growth & Design (2011), vol. 11, pp. 1091-1097
Czochralski crystal growth, thermal conductivity and
magnetic properties of Pr
x
La
1-x
AlO
3
, where x = 0, 0.75,
0.55, 0.40, 1
S. Turczynski,*† D. A. Pawlak,† R. Diduszko,† J. Mucha‡, M. Pękała§, J.F. Fagnard**,
Ph. Vanderbemden**, M. A. Carpenter♦
Institute of Electronic Materials Technology (ITME), ul. Wolczynska 133, 01-919 Warsaw, Poland, Institute of Low Temperature and Structure Research, PAN, 50-950 Wrocław 2, Poland, Chemistry
Dept., Warsaw University, Al. Zwirki i Wigury 101, Pl-02-093, Warsaw, Poland, SUPRATECS,
Montefiore Electricity Institute, B28, University of Liege, B-4000 Liege, Belgium
Department of Earth Sciences, University of Cambridge,Downing Street, Cambridge, CB2 3EQ, U.K
E-mail: Sebastian.Turczynski@itme.edu.pl
RECEIVED DATE
Abstract. Crystals of PrxLa1-xAlO3 solid solution have been grown by the Czochralski method for the
first time, to our knowledge. Crystals with high praseodymium concentration tend to grow spirally. The color of the crystals changes with chemical composition. X-ray diffraction shows an increase of the lattice constants with an increase of lanthanum ion concentration. The thermal conductivity has been investigated in the temperature range 5 to 300 K. Completely different behaviour of thermal
conductivity is observed at low temperatures for the investigated crystals, while it remains roughly
constant at high temperatures. The values of magnetic susceptibility lies within the expected range that could be expect for a paramagnetic material.
Published in Crystal Growth & Design (2011), vol. 11, pp. 1091-1097
Introduction
LaAlO3 has a phase transition from high-temperature cubic phase to low-temperature rhombohedral
phase at 833K which will generate micro-twins, ferroelastic domains, a rough surface and lateral
distortions.1 PrAlO3 is likewise a rhombohedrally-distorted perovskite (space group R3c , tilt system
aaa ) at room temperature2, 3, 4. The distortion from cubic symmetry is associated with the tilting of the
AlO6 octahedra about the three-fold axis, and this is progressively reduced as the temperature is
increased above room temperature, until at 1864 K, PrAlO3 transforms to the cubic structure of the ideal
perovskite5, 6, 19. The transition temperature is between that of LaAlO3 (transition at 833K) and that of
NdAlO3 (transition at ca. 2200K). Microtwins are also observed in PrAlO3 crystals7, 8. PrAlO3 differs
from LaAlO3 and NdAlO3 in that it undergoes further phase transitions below room temperature9, 10, 11, 12,
13, 14, 15
: a first-order transition at about 205 K and a continuous transition near 150K. The phase
transitions of PrAlO3 can be described as: C2
m → Imma → R3c → Pm3m . 150 K 205K 1864±31K 4, 5, 6, 16, 17, 18, 19
. The change of PrAlO3 structure with pressure has been also recently investigated18, 20. The
additional transitions below room temperature are ascribed to the so-called ion lattice coupling. Harley
et al.11 state that the Pr3+ ion in its ground state favors a tetragonal distortion, whereas elastic forces
favor a trigonal distortion. Competition between these competing requirements causes the observed
sequence of transitions11, 12.
Phase transitions in PrxLa1-xAlO3 solid solution perovskites were first investigated in 1970’s. Samples
were obtained by different methods, such as the flux growth method11, 21. Polycrystalline samples were
prepared using conventional solid-state method16, 18. Physical properties of PrxLa1-xAlO3 were
determined by: neutron powder diffraction4, EPR11, Raman spectroscopy11, 21, low temperature XRD16
and high-pressure powder synchrotron X-ray diffraction18. High-temperature phase transitions were
detected in PrxLa1-xAlO3, with the temperatures decreasing with increasing lanthanum content.
Published in Crystal Growth & Design (2011), vol. 11, pp. 1091-1097
show interesting structural behavior. High-temperature transitions are caused by octahedral tilting
within the perovskite structure, while the low-temperature transitions are caused by electronic effects15.
No data on single crystal growth of PrxLa1-xAlO3 could be found. Wanklyn et al. prepared millimeter-
sized samples of PrAlO3 and other rare earth aluminates by the flux method22, while Pawlak et al.
prepared the PrAlO3 crystals by the Czochralski method7. Novoselov presented PrAlO3 crystals doped
with Ce and Sr, grown by the micro-pulling down method23, 24. The melting temperature of PrAlO3 was
quoted as ca. 2350K 15.
PrxLa1-xAlO3 has attracted a lot of attention due to its many phase transitions and the change of
electronic, magnetic and structural properties. By changing the Pr:La ratio in PrxLa1-xAlO3 single
crystals the phase transitions can be engineered. In this work we describe the growth of PrxLa1-xAlO3
bulk single crystals by the Czochralski method, where x = 0, 0.75, 0.55, 0.40, 1. Structural and magnetic
properties as well as thermal conductivity for PrxLa1-xAlO3, where x = 0, 0.55, 1 are also presented and
discussed here.
Experimental
Crystal growth. PrxLa1-xAlO3 crystals, where x=1, 0.75, 0.55, 0.4, 0, have been obtained using the
Czochralski method25. The melts were prepared from high purity Pr6O11, Al2O3 and La2O3 oxides
(99,995%). All components were mixed in stoichiometric ratios. A conventional Czochralski apparatus, Oxypuller 05–03 (Cyberstar), and RF heating were used. The crystals were grown from an iridium crucible, 50 mm in height and diameter. The pulling and rotation rates were 1-1,7mm/h and 6-8rpm, respectively. The crystals were seeded-grown with iridium wires (Fig. 1). The crystals were about 20mm in diameter and 50mm in length. A pure nitrogen atmosphere was applied. This is in contrast to the single
crystals obtained by Pawlak et al. which were obtained in partially oxidizing atmosphere (ca. 20÷30ppm)7
Published in Crystal Growth & Design (2011), vol. 11, pp. 1091-1097
Figure 1. Pr0.55La0.45AlO3 crystal with the iridium wire-seed, grown by the Czochralski method.
XRD analyses. In order to confirm the structural state of as-grown PrxLa1-xAlO3 crystals, powder X-
ray Diffraction experiments have been performed. The XRD data were collected on a Siemens D500
diffractometer equipped with semiconductor Si:Li detector and KαCu radiation. Intensity of the
diffraction peaks was recorded in the range of 2θ=15º–82º with a step size of 0.02º and an integration time of 10 s/step.
Magnetic susceptibility. The temperature dependence of the AC magnetic susceptibility was measured at 1 mT amplitude. The temperature variation of the field-cooled (FC) and zero-field-cooled (ZFC) DC magnetization was recorded under an applied DC field µ0H of 10 mT. More details have been described
elsewhere 26, 27.
Thermal conductivity. The thermal conductivity was measured using the stationary heat flux method in the temperature range 5 – 300 K. The experimental setup and the measurement procedure have been
described in detail in28, 29. The temperature gradient along the sample was in the range 0.1 – 0.5 K.
Particular care was taken to avoid a parasitic heat transfer between the sample and its environment. The measurement error was below 2% and the surplus error estimated from the scatter in the measurement points did not exceed 0.3%.
Results and Discussion
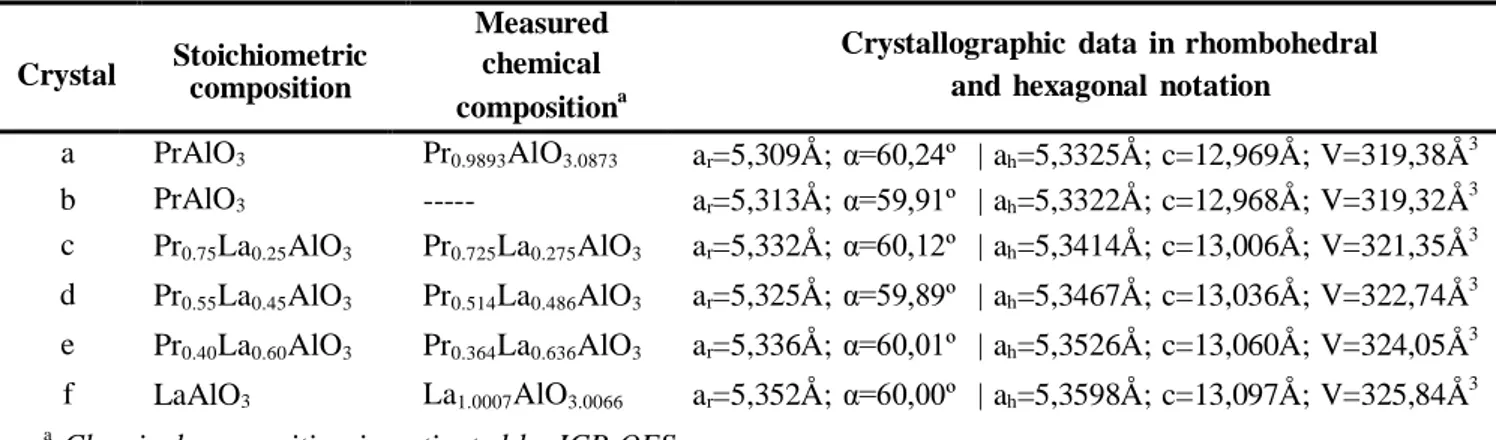
Structural results. Data for PrxLa1-xAlO3 crystals, where x=1, 0.75, 0.55, 0.4, 0, are given in Tab. 1.
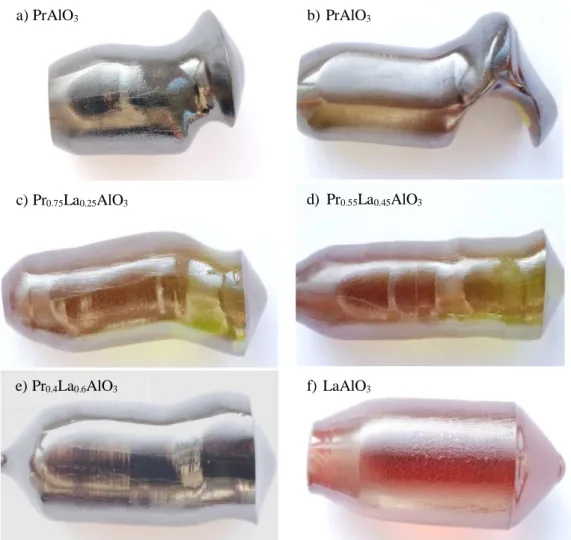
The crystals themselves are shown in Fig. 2. The crystal compositions measured with inductive coupled plasma optical emission spectroscopy (ICP-OES) differ slightly from the raw materials compositions.
Published in Crystal Growth & Design (2011), vol. 11, pp. 1091-1097
The determined concentration of Pr ions is lower, and of La ions is higher than the nominal values (Tab. 1). A tendency to grow with slight spirality at the ends has been observed in the crystals with high
praseodymium concentration. This was not observed in the LaAlO3 crystal. The colors of the crystals
have different origins: the dark brown colour is probably a result of the presence of Pr4+ ions7, 30, 31,
while the light green colour is typical for Pr3+ ions7, 30, 31. The brownish-red coloration mostly in the
LaAlO3 crystal is probably due to the colour centres32, 33.
Table 1. Chemical composition and crystallographic data of PrxLa1-xAlO3 crystals.
Crystal Stoichiometric composition
Measured chemical compositiona
Crystallographic data in rhombohedral and hexagonal notation
a b PrAlO3 PrAlO3 Pr0.9893AlO3.0873 --- ar=5,309Å; α=60,24º | ah=5,3325Å; c=12,969Å; V=319,38Å3 ar=5,313Å; α=59,91º | ah=5,3322Å; c=12,968Å; V=319,32Å3 c Pr0.75La0.25AlO3 Pr0.725La0.275AlO3 ar=5,332Å; α=60,12º | ah=5,3414Å; c=13,006Å; V=321,35Å3 d Pr0.55La0.45AlO3 Pr0.514La0.486AlO3 ar=5,325Å; α=59,89º | ah=5,3467Å; c=13,036Å; V=322,74Å3 e Pr0.40La0.60AlO3 Pr0.364La0.636AlO3 ar=5,336Å; α=60,01º | ah=5,3526Å; c=13,060Å; V=324,05Å3 f LaAlO3 La1.0007AlO3.0066 ar=5,352Å; α=60,00º | ah=5,3598Å; c=13,097Å; V=325,84Å3 a
Chemical composition investigated by ICP-OES
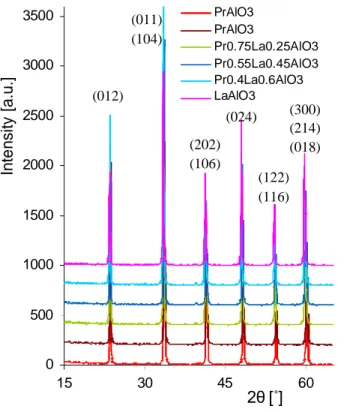
From powder X-ray diffraction we can conclude that all the crystals consisted of one phase, with the
rhombohedral perovskite structure (Fig. 3). The XRD analysis also indicates that PrxLa1-xAlO3 crystals
all solidify in a rhombohedral structure. The observed reflections are consistent with space group.
Lattice constant of the PrAlO3 crystal, ah =5.3325, ch = 12.969 Å (for the first crystal) and ah =5.3322,
ch = 12.968 Å (for the second crystal) are in agreement with the reference values given in hexagonal
notation (ah =5.3328, ch = 12.973 Å7 and ah =5.332, ch = 12.97 Å34). The measured lattice constant of
the LaAlO3, ah=5,3598Å; c=13,097Å, are also in agreement with the literature data (ah=5,3653Å;
Published in Crystal Growth & Design (2011), vol. 11, pp. 1091-1097
a) PrAlO3 b) PrAlO3
c) Pr0.75La0.25AlO3 d) Pr0.55La0.45AlO3
e) Pr0.4La0.6AlO3 f) LaAlO3
Figure 2. A series of PrxLa1-xAlO3 crystals grown by the Czochralski method: a) x=1, b) x=1, c) x=0.75,
Published in Crystal Growth & Design (2011), vol. 11, pp. 1091-1097 In te n s ity [a .u .] 3500 3000 (012) (011) (104) PrAlO3 PrAlO3 Pr0.75La0.25AlO3 Pr0.55La0.45AlO3 Pr0.4La0.6AlO3 LaAlO3 2500 2000 1500 (202) (106) (024) (300) (214) (018) (122) (116) 1000 500 0 15 30 45 60 2θ [˚]
Figure 3. Powder X-ray diffraction peaks of PrxLa1-xAlO3 indicate one-phase for all obtained crystals.
Lattice parameters for all as-grown crystals in both rhombohedral and hexagonal notation are shown in Table 1. Diffraction peaks at higher values of 2θ show a continuous shift towards lower 2θ angles with increasing amount of lanthanum ions substituting for praseodymium (Fig. 4). This is connected
with an increase of the lattice parameters of PrxLa1-xAlO3 crystals with increasing concentration of
lanthanum ions ( La 3+ =1,216), which have bigger ionic radii than praseodymium ions ( Pr 3+ =1,179)36.
IX IX
Figure 5 shows the impact of increasing La ion concentration on lattice parameters in agreement with Vegard’s law. Apart from changes of the lattice parameters, the angle in rhombohedral notation for the
LaAlO3 crystal is much closer to 60° than for PrAlO3. This indicates that the distortion from a cubic
Published in Crystal Growth & Design (2011), vol. 11, pp. 1091-1097 It en si ty [ a .u .] Lat ti c e pa ra m et er s a, c [Å] 1600 1200 800 400 LaAlO3 Pr0.4La0.6AlO3 Pr0.55La0.45AlO3 Pr0.75La0.25AlO3 PrAlO3 0 PrAlO3 69 74 79 2θ[°]
Figure 4. Powder X-ray diffraction peaks of PrxLa1-xAlO3 crystals. The peaks shift to lower 2θ values
with higher concentration of lanthanum ions.
a 13 c 5 0 50 100 La content [at.%]
Figure 5. Dependence of ‘a’ and ‘c’ lattice parameters of PrxLa1-xAlO3 crystals on the La ions
Published in Crystal Growth & Design (2011), vol. 11, pp. 1091-1097
Magnetic characterization. The magnetic properties of PrxLa1-xAlO3 crystals, where x=0, 0.55, 1,
have been investigated. The values of magnetic susceptibility lies within the expected range that could be expect for a paramagnetic material (Fig. 6). The magnetic susceptibility of two samples containing Pr
atoms is approximately four times larger than for LaAlO3 sample. The almost temperature-independent
behavior found in LaAlO3 most probably resembles so-called van Vleck paramagnetism9. All three
susceptibility curves exhibit a maximum at around 160 – 180K, which is followed by a very similar curvature between 180 and 210K. One may notice that the observed magnetic susceptibility maximum
is located close to the second-order phase transition reported in PrAlO3 at 151K9, 31, 37. Moreover, the
susceptibility variation of the three samples above 290K is very similar. These features suggest treating
the LaAlO3 as a reference and decomposing the measured magnetic susceptibility into the van Vleck
component related to LaAlO3, χAl(T), and the susceptibility component for Pr atoms, χPr(T),
respectively. Thus, the susceptibility components have been analysed according to:
χ(T) = χAl(T) + χPr(T)
The inverse susceptibilities (1/χPr(T)) are plotted for PrAlO3 and Pr.55La.45AlO3 systems in Fig. 6b. In
the phase appearing above 210K 6 two temperature intervals (from 210 to 290K, and above 290K)
may be distinguished, which as a first approximation can be described using the Curie – Weiss expression:
χPr(T) = C / ( T – TW ),
Published in Crystal Growth & Design (2011), vol. 11, pp. 1091-1097 χ [ c m 3 /g] 1/ χ [g /c m 3 ] 4,E-05 a) b) 70000 PrAlO3 Pr0.55La0.45AlO3 3,E-05 2,E-05 PrAlO3 Pr0.55La0.45AlO3 LaAlO3 60000 50000 1,E-05 40000 0,E+00 0 100 200 300 Temperature [K] 30000 0 100 200 300 Temperature [K]
Figure 6. Magnetic properties of PrAlO3, Pr0.55La0.45AlO3 and LaAlO3 crystals. (a) susceptibility
dependence on temperature χ(T), (b) temperature dependence of the inverse susceptibility 1/ χ(T). The
magnetic susceptibility was measured in magnetic fields below 1 Oe. Straight lines show a fit to the Curie - Weiss law below and above 290 K.
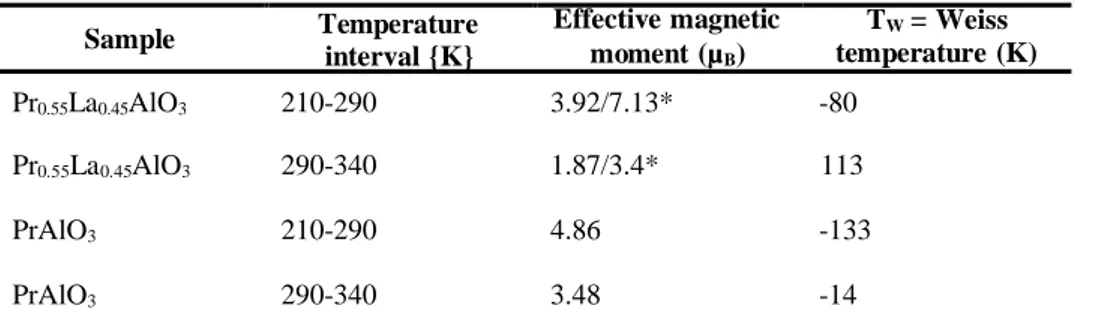
The parameters derived by a fitting to a Curie – Weiss law (Tab. 2) reveal a remarkable changeover occurring at about 290K. As the temperature intervals are relatively narrow, values of the effective magnetic moments are determined with accuracy of about 2% and 7 % for temperatures below and
above 290K, respectively. It is noteworthy that the effective magnetic moment per Pr3+ ion
(see Tab. 2) is higher below 290K for both the PrAlO3 and Pr0.55La0.45AlO3 systems. Moreover, the
magnetic moments below 290K, are much higher than the expected free ion Pr3+ value of 3.6µB. The
applied numerical separation of the van Vleck and Curie-Weiss susceptibility components shows that these components cannot be entirely responsible for the huge values of effective magnetic moments found below 290K, even assuming the overestimated 10% inaccuracy of the van Vleck component. This could indicate that the susceptibility separation is too crude in this case, or some additional mechanisms
Published in Crystal Growth & Design (2011), vol. 11, pp. 1091-1097
In the first scenario the superparamagnetic phase with a large magnetic moment composed of many atoms contained in a grain or cluster often appears in the vicinity of the paramagnetic Curie temperature. For both the Pr containing samples it is revealed by a lower slope in the temperature dependence of the inverse susceptibility below 290 K as compared to the higher temperatures. According to structural data one may suppose that the superparamagnetic grains are preferentially
formed within the planes of Pr/Al atoms. The distance between these atoms are as low as 0.5312 nm and
the Pr-O-Pr angle is 180°, which may facilitate a stronger exchange interaction leading to superparamagnetism. The exchange interaction may also be enhanced due to local lattice deformations and strains.
Tab. 2. Effective magnetic moment and Weiss temperature derived from Curie - Weiss law for PrAlO3
and Pr0.55La0.45AlO3 crystals.
Sample Temperature interval {K} Effective magnetic moment (µB) TW = Weiss temperature (K) Pr0.55La0.45AlO3 210-290 3.92/7.13* -80 Pr0.55La0.45AlO3 290-340 1.87/3.4* 113 PrAlO3 210-290 4.86 -133 PrAlO3 290-340 3.48 -14
* The smaller value is per Pr0.55La0.45AlO3, the higher value is per Pr3+ ion
It is well known that the higher multiplets in praseodymium are located very close to the ground one.
This can make the magnetic moment of Pr3+ more dependent on crystal field effects 31. Such additional
contributions are not taken into account when the classical Curie–Weiss is derived, since this assumes
only the ground state is occupied, and there is no magnetic anisotropy38. A more advanced susceptibility
Published in Crystal Growth & Design (2011), vol. 11, pp. 1091-1097
components and the relation to magnetic and structural anisotropy will be studied in more detail, if well- oriented crystals will become available.
For PrAlO3 the negative Weiss temperature TW values of -133 and -14K derived from the 210-290
and 290-340 K intervals, respectively, indicate the average antiferromagnetic interaction between the
Pr3+ magnetic moments. These values are not very different from the -52K reported for T > 205K9. The
Pr0.55La0.45AlO3 system has the more complex behavior, since TW = -80K for the 210-290K interval
changes to TW = 113K at higher temperatures. The sign change in TW points to an average
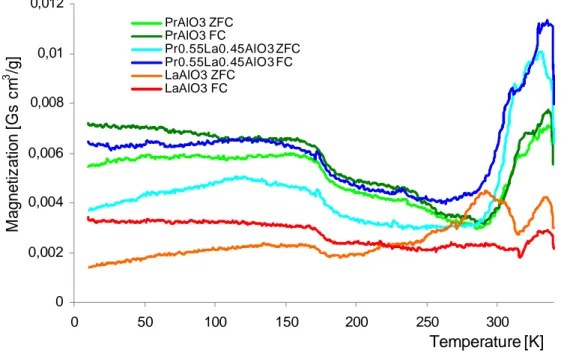
ferromagnetic interaction in the temperature range above 290K. The sign change in TW occurs close to
the irreversibility temperature TIR=310K, where the zero (ZFC) and field (FC) cooled curves start to
diverge (Fig. 7). On the other hand, in PrAlO3, where a tendency to ferromagnetic ordering is relatively
weak, the irreversibility effects appear below TIR = 290K. The irreversibility processes may be caused
by the magnetic anisotropy and/or the phase separation on twin boundaries 39. There is also an abrupt
increase in magnetization above TIR for both systems containing Pr. Such behavior may reveal weakly
ferromagnetic ordering of Pr3+ ions. The high temperature magnetization increase is larger for the
Pr0.55La0.45AlO3 exhibiting the positive TW value. The puzzling behavior of ZFC and FC magnetization
Published in Crystal Growth & Design (2011), vol. 11, pp. 1091-1097 M a gn e ti z a ti o n [ G s c m 3 /g ] 0,012 0,01 0,008 PrAlO3 ZFC PrAlO3 FC Pr0.55La0.45AlO3 ZFC Pr0.55La0.45AlO3 FC LaAlO3 ZFC LaAlO3 FC 0,006 0,004 0,002 0 0 50 100 150 200 250 300 Temperature [K]
Figure 7. The dependence of ZFC and FC magnetization on temperature, M(T) for PrAlO3,
Pr0.55La0.45AlO3 and LaAlO3 crystals. The temperature variation of the field-cooled (FC) and zero-field-
cooled (ZFC) DC magnetization was recorded under an applied DC field µ 0H of 10 mT.
Thermal Conductivity. Thermal conductivities of PrAlO3, Pr0.55La0.45AlO3, LaAlO3 are presented in
Fig. 8, in the temperature range 5-300K. All samples are very good insulators, so heat transfer can be
attributed to phonons. At high temperatures, thermal conductivities (κ) for all samples are close to
6W/Km. At low temperatures large differences can be seen both in the values of the thermal
conductivity and their temperature dependences. The maximum of κ(T) occurs at 30K for PrAlO3 and at
40K for Pr0.55La0.45AlO3, and such behavior is characteristic for dielectrics. However for LaAlO3 a
broad maximum is observed only at 135K – which is typical for some non-magnetic compounds with
Lu, La and Y. Above the temperature of the thermal conductivity maximum κ(T) is a decreasing
Published in Crystal Growth & Design (2011), vol. 11, pp. 1091-1097
phase transition↓)15
, so we can assume that the observed minimum at 120K for Pr0.55La0.45AlO3 is due to
the phase transition. Thermal conductivity can be given by the following kinetic formula: κ(T) = 1/3Cυℓ,
where C is heat capacity of the lattice, υ is average phonon velocity and ℓ is average free path of
phonons. The temperature dependences of the C, υ and l determine κ(T). Fig. 8b shows the
temperature dependences of thermal conductivity on a log-log scale. At low temperatures the thermal
conductivity of LaAlO3 and Pr0.55La0.45AlO3 varies with temperature as T1 and as T0.7, respectively. This
is connected with the dispersion of phonons on the point defects, especially for Pr0.55La0.45AlO3.
At T* = 16 K a significant change of temperature dependence of κ(T) can be seen: T1 for
Pr0.55La0.45AlO3 and T0.9 for LaAlO3. This change of phonon-defect interaction is probably associated
with the phase transition, which causes the number and kind of defects in the crystal lattice to change.
The temperature dependence of the thermal conductivity for PrAlO3 crystal is completely different. The
thermal conductivity for this crystal varies as T2.3. This could be connected with dispersion of phonons
on the microtwin boundaries in addition to the phonon-defect dispersion existing in other crystals. At
temperatures above the maximum temperature of the thermal conductivity, the thermal resistance (κ-1)
depends mainly on phonon-phonon and phonon-defect interaction (such as dislocations). The thermal
conductivity for PrAlO3, LaAlO3 and Pr0.55La0.45AlO3 changes as T-2.2, T-0.1 and T-1.1, respectively.
Minima in κ(T) are observed at 150 and 120 K for PrAlO3 and LaAlO3, respectively, while a small
maximum is observed for LaAlO3 at 120K. Comparing temperature dependences of the thermal
conductivity for PrAlO3 and Pr0.55La0.45AlO3, a strong influence of praseodymium ions concentration on
κ(T) can be seen. The explanation may be as follows: in PrAlO3 there is a second-order phase transition
at 150K, during which the lattice constants change. The change of the lattice constants may strongly influence thermal conductivity.
Published in Crystal Growth & Design (2011), vol. 11, pp. 1091-1097 T he rm al co n d u ct ivi ty (W /K m) T her m al c onduc ti v it y ( W/ K m ) 20 T T 50 a) Pr AlO3 La AlO3 40 Pr55La45AlO3 60 40 b) 30 30 * 10 6 4 20 3 2 * 1 5 10 10 30 50 T (K) 100 300 0 0 50 100 150 200 250 300 350 T (K)
Figure 8. Thermal conductivity of PrAlO3, Pr0.55La0.45AlO3, LaAlO3 crystals in the temperature range
from 5 to 300K.
Conclusions
PrxLa1-xAlO3 crystals, where x=1, 0.75, 0.55, 0.4, 0, have been grown by the Czochralski method. The
crystals had the following compositions Pr0.9893AlO30873, Pr0.725La0.275AlO3.0504, Pr0.514La0.486AlO2.8647,
Pr0.364La0.636AlO3.0003, and La1.0007AlO3.0066 as investigated by ICP OES. Due to the phase transition
between the melting temperature and the room temperature the crystals had to be seeded-grown with iridium wires. Crystals with high praseodymium content had a tendency to grow spirally. X-ray
diffraction analysis shows that LaAlO3 is much less distorted from a cubic system than PrAlO3, and that
the lattice parameters in PrxLa1-xAlO3 crystals increase with increasing lanthanum concentration. The
values of magnetic susceptibility lies within the expected range that could be expect for a paramagnetic material. Numerical separation of the van Vleck and Curie-Weiss susceptibility components shows that
Published in Crystal Growth & Design (2011), vol. 11, pp. 1091-1097
The thermal conductivity has been measured for PrAlO3, Pr0.55La0.45AlO3, and LaAlO3 crystals in the
temperature range from 5 to 300 K. At higher temperatures the thermal conductivity of all investigated crystals is similar, while at lower temperatures there are considerable differences. Changes in the temperature dependence of thermal conductivity are seen at the temperatures of the second-order
transition for PrAlO3 at 151 K and for Pr0.55La0.45AlO3 at 120K.
Acknowledgments. The authors thank the FP7 NMP ENSEMBLE Project (GA NMP4-SL-2008- 213669) and the Ministry of Science and Higher Education of Poland for support (Grant No. N 5076 143 32/4056) for partially supporting this work. This work has been partially supported by Ministry of Science and Higher Education (Poland - Wallony). The authors thank to Marek Swirkowicz, Tadeusz Telak, Dariusz Artel and Wlodek Szyrski from ITME for help with crystal growth processes. Authors are grateful to Dr. hab. A. Szewczyk for fruitful discussions.
References
(1) M.M.C. Chou, Ch. Chen, S.S. Yang, Ch.H. Huang, H.L. Huang, J. of Phys. Chem. Solids 2008, 69, 425.
(2) A.M. Glazer, Acta Cryst. 1972, B28 3384. (3) A.M. Glazer, Acta Cryst. 1975, A31, 3384.
(4) C.J. Howard, B.J. Kennedy, B.C. Chakoumakos, J. Phys. Condens. Matter. 2000, 12, 349. (5) C.J. Howard, H. Stokes, Acta Cryst. 1998, B54, 782.
(6) M.A. Carpenter, C.J. Howard, B.J. Kenned, K.S. Knight, Phys. Rev. B 2005, 72, 024118.
(7) D.A. Pawlak, T. Lukasiewicz, M. Carpenter, M. Malinowski, R. Diduszko, J. Kisielewski, J. Cryst. Growth 2005, 282, 260-269.
(9) E. Cohen, L.A. Risberg, W.A. Nordland, R.D. Burbank, R.C. Sherwood, L.G. Van Uitert, Phys. Rev. 1969, 186, 476.
(10) R.D. Burbank, J. Appl. Cryst. 1970, 3, 112.
(11) R.T. Harley, W. Hayes, A.M. Perry, S.R.P. Smith, J. Phys. 1973, C6, 2382.
(12) R.J. Birgeneau, J.K. Kjems, G. Shirane, L.G. Van Uitert, Phys. Rev. 1974, B10, 2512. (13) K.B. Lyons, R.J. Birgeneau, E.I. Blount, L.G. Van Uitert, Phys. Rev. 1975, B11, 891. (14) J.K. Kjems, G. Shirane, R.J. Birgeneau, L.G. Van Uitert, Phys. Rev. Lett. 1973, 31,1300.
(15) T. Basyuk, L. Vasylechko, S. Fadeev, I.I. Syvorotka, D. Trots, R. Niewa, Radiation Phys. Chem. 2009, 78, S97-S100.
(16) S.M. Moussa, B.J. Kennedy, B.A. Hunter, C.J. Howard,T. Vogt, J. Phys. Condens. Matter 2001, 13, L203.
(17) B.J. Kennedy, A.K. Prodjostanoso, C.J. Howard, J. Phys. Condens. Matter. 1999, 11, 6319. (18) B.J. Kennedy, T. Vogt, C.D. Martin, J.B. Parise, J.A.Hriljac, Chem. Mater. 14 (2002) 2644.
(19) M.A. Carpenter, E.C. Wiltshire, C.J. Howard, R.I. Thomson, S. Turczynski, D.A. Pawlak, T. Lukasiewicz, submitted to Phase Transitions 2010
(20) J. Zhao, N. L. Ross, R. J. Angel, M. A. Carpenter, Ch. J.Howard, D.A. Pawlak, T. Lukasiewicz, J. Physics, Condensed Matter, 2009, 21, 235403.
(21) T.J. Glyn, R.T. Harley, W. Hayes, A.J. Rushworth, S.H. Smith, J. Phys. C: Solid State Phys. 1975, 8, L126-L128.
(22) B.M. Wanklyn, D. Midgley, B.K. Tanner, J. Cryst. Growth 1975, 29, 281
(23) A. Novoselov, A. Yoshikawa, J. Pejchal, M. Nikl, T. Fukuda, Optical Materials 2007, 30, 168-170. (24) A. Novoselov, A. Yoshikawa, N. Solovieva, M. Nikl, Crystal Research and Technology 2007, 42,
(26) M. Pekala, V. Drozd, J. F. Fagnard, Ph. Vanderbemden, and M. Ausloos, J. Appl. Phys. 2009, 105, 013923
(27) F. Wolff Fabris, M. Pekala, V. Drozd, J-F. Fagnard, Ph. Vanderbemden, Ru-Shi Liu, and M. Ausloos, J. Appl. Phys. 2007, 101, 103904
(28) A. Jeżowski, J. Mucha, G. Pompe, J. Phys. D: Appl. Phys. 1987, 20, 1500.
(29) J. Mucha, S. Dorbolo, H. Bougrine, K. Durczewski, and M. Ausloos, Cryogenics 2000, 44, 145 (30) D.A. Pawlak, Z. Frukacz, Z. Mierczyk, A. Suchocki, J. Zachara, J. Alloys and Comp. 1998, 275, 361.
(31) B. Andrzejewski, D. A. Pawlak, T. Klimczuk, S. Turczynski, submitted to Chem. Mat. 2009.
(32) D.A. Pawlak, M. Ito, L. Dobrzycki, K. Wozniak, M. Oku, K. Shimamura, T. Fukuda, J. Mat. Res. 2005, 20, 412
(33) Y.C. Chang, De-Sen Hou, Y.D. Yu, S.S. Xie, T. Zhou, J. Cryst. Growth 1993, 129, 362. (34) JCPS 29-0076.
(35) H. Lehnert, H. Boysen, P. Dreier, Y. Yu, Zeitschrift fuer Kristallographie 2000, 215, 145. (36) R.D. Shannon, Acta Cryst. 1976, A32, 751.
(37) M. Wencka, S. Vrtnik, M. Jagodič, Z. Jagličić, S. Turczynski, D.A. Pawlak, J. Dolinšek, Phys. Rev. B, 2009, 80, 224410.
(38) K. Andres, S. Darack, H.R. Ott, Phys. Rev. 1979, B19, 5475
(39) R. Szymczak, M. Czepelak, R. Kolano, A. Kolano-Burian, B. Krzymańska, H. Szymczak, J. Mater. Sci. 2008, 43, 1734.