A multidimensional analysis of Aslib Proceedings –
using everything but the Impact Factor
Stefanie Haustein1 & Vincent Larivière1,2
[email protected], [email protected]
1 École de bibliothéconomie et des sciences de l’information, Université de Montréal, C.P. 6128,
Succ. Centre-Ville, Montréal, QC. H3C 3J7 (Canada)
2
Observatoire des sciences et des technologies (OST), Centre interuniversitaire de recherche sur la science et la technologie (CIRST), Université du Québec à Montréal
CP 8888, Succ. Centre-Ville, Montréal, QC. H3C 3P8, (Canada) Abstract
Purpose – This study shows that the journal impact factor is not able to reflect the full impact of scholarly journals and provides an overview of alternative and complementary methods in journal evaluation.
Design/methodology/approach – Aslib Proceedings (AP) is exemplarily analyzed with a set of indicators from five dimensions of journal evaluation, i.e. journal output, content, perception and usage, citations and management to accurately reflect its various strengths and weaknesses beyond the impact factor.
Findings – AP has become more international in terms of authors and more diverse regarding its topics. Citation impact is generally low and, with the exception of a special issue on blogs, remains world average. However, an evaluation of downloads and Mendeley readers reveals that the journal is an important source of information for professionals and students and certain topics are frequently read but not cited.
Research limitations/implications – The study is limited to one journal.
Practical implications – An overview of various indicators and methods is provided that can be applied in the quantitative evaluation of scholarly journals (and also to articles, authors and institutions).
Originality/value – After a publication history of more than 60 years, this analysis takes stock of AP, highlighting strengths and weaknesses and developments over time. The case study provides an example and overview of the possibilities of multidimensional journal evaluation.
Keywords: journal evaluation; impact factor; scholarly communication; citation analysis; usage statistics; Mendeley
1 Introduction
After a publication history of almost 65 years and a recent title change to Aslib Journal of Information Management, it seems timely to take stock of AP by analyzing it with the help of bibliometric methods. When it comes to evaluation of scholarly journals, the Impact Factor (IF), developed in the early 1960s by Eugene Garfield and Irving Sher at the Institute for Scientific Information as selection criteria for journals to be covered by their famous Science Citation Index (SCI) (Garfield and Sher, 1963), is usually brought up. However, the IF is well known for its flaws including its short citation and publication windows, the asymmetry of document types between numerator and denominator, its inability as a means to represent skewed distributions and its field dependence (Archambault and Larivière, 2009; Haustein, 2012), not to mention its misuse for author evaluation. Thus this study will apply a multidimensional approach to journal evaluation, showing that the IF is not able to fully represent the impact of a journal and citation-based indicators tell only part of the story (Rowlands and Nicholas, 2007). Based on the concept introduced by Grazia Colonia (2002) and Juchem et al. (2006) and further developed by Haustein (2012), Aslib Proceedings is analyzed with various indicators from five dimensions of journal evaluation, namely journal output, content, perception and usage, citations and management. Aslib Proceedings is used as an example to show that multidimensional analyses will reveal strengths and weaknesses of a journal from various perspectives. We demonstrate differences between author and reader communities, developments of the journal and subjects over time and show that although some topics are not frequently cited, they have high impact based on the number of downloads.
Four stakeholders, each with different needs in the process of evaluating and ranking scholarly journals, can be identified; namely readers selecting a source of information, authors choosing a publication venue, librarians managing a collection, and editors and publishers evaluating own and competing periodicals (Garfield, 1972; Todorov and Glänzel, 1988; Moed et al., 1998; Nisonger, 1999; Glänzel and Moed, 2002). Depending on the stakeholder’s requirements, one indicator might be more suitable than another and the same set of periodicals might even be ranked differently from the readers’ and authors’ perspectives (Mabe and Amin, 2002; Rousseau, 2002; Haustein, 2012).
The evaluation of scholarly journals based on citations is not new. It goes back to Gross and Gross (1927) and Bradford (1934), who introduced reference-based analyses to improve local library collection management. With the SCI, citation-based journal evaluation was applied on a much larger scale (Garfield, 1955). Originally developed as a tool to help select journals to be included in the SCI database, the IF soon became the first widely applied bibliometric indicator and a cure-all metric powerful enough to influence scientific communication. Today the IF is both used and misused by scholarly authors, readers, journal editors, publishers and research policy makers alike (Adam, 2002; The PLoS Medicine editors, 2006; Haustein, 2012). As a citation rate it captures, however, only one small aspect of the standing of a scientific journal (Rowlands and Nicholas, 2007). Since scholarly journals are influenced by many different factors, their evaluation should also be multifaceted (Juchem et al., 2006; Haustein, 2012). Along these lines, the San Francisco Declaration on Research Assessment (DORA, 2013), urged publishers to “reduce emphasis on the journal impact factor as a promotional tool […] by presenting the metric in the context of a variety of journal-based metrics […] that provide a richer view of journal performance.”
Various authors have addressed the need for a multidimensional approach and emphasized that a complex concept such as scholarly impact in general and journal impact in particular cannot be reflected by an average citation rate (Glänzel and Moed, 2002; Rousseau, 2002; Van Leeuwen and Moed, 2002; Moed, 2005; Coleman, 2007). To preserve the multidimensionality of journal impact, information should not be conflated into one ranking but rather a battery of indicators should be used to represent journal impact adequately. In the following, AP will be analyzed multidimensionally; providing an overview of the journal’s performance over the years. The methods section provides an overview of the data sets and indicators used for each of the five dimensions, namely journal output, content, perception and usage, impact and management (Haustein, 2012). After that, combined results are presented and discussed.
2 Methods
In the following, the methods and selected indicators used to analyze journal output, content, perception and usage, citations and management are briefly introduced and described. For a detailed literature review and extensive description of indicators and methods, the reader is referred to Haustein (2012).
2.1 Output
The number of papers published in AP is based on a local copy of the Web of Science (WoS) and was analyzed per year from the first issue of the journal covered by WoS in 1972 to the end of 2012. Due to space limitations, most results only cover papers published since 2000. Journal output was measured per year and at the level of countries, special issues (SI), author keywords and noun phrases from titles. Full counting of publications was applied.
2.2 Content
Journal content is evaluated based on three approaches: author keywords, noun phrases that appeared in titles, and themes of SIs. Author keywords were analyzed as indexed by WoS, presenting the most frequent keywords and trends over time for the papers published since 2000. Information on SIs since 2000 was collected from the journal’s website. Noun phrases were extracted from paper titles with VOSviewer (van Eck et al., 2010). VOSviewer applies a linguistic filter based on the part-of-speech tagger developed by Schmid (1994), extracting noun phrases and merging regular singular and plural forms (van Eck et al., 2010). The tool was also used to visualize the co-occurrences of those noun phrases during the two five-year periods 2003-2007 and 2008-2012 to detect and demonstrate changes in topics published in the journal. The network analysis was restricted to noun phrases that occurred at least twice and together with at least one other noun phrase within one period. This resulted in a selection of 69 of 539 noun phrases for 2003-2007 and 60 of 569 for the 2008-2012 period. Clustering and network layout in VOSviewer are based on the association strength algorithm (van Eck and Waltman, 2010), which, similar to cosine and Jaccard, normalizes co-occurrences of two items by their overall occurrences (van Eck and Waltman, 2009). A clustering resolution of 0.5 and convergence of 0.01 were selected to optimize the visualization and clustering, showing all existing lines, i.e. co-occurrences of two terms in article titles.
2.3 Perception and Usage
The number of downloads, i.e. full text access according to the COUNTER standard, was obtained from the publisher, from the date of (online) publication until May 2013 (Nicholas et
al., 2008; Project COUNTER, 2008). Per definition, downloads measured here are only those
made to the formal version of the paper published on the journal’s website and, hence, exclude access to other versions found on institutional/disciplinary repositories or on researchers’ websites. Except for Figure 4, which highlights differences in annual download rates, the number of downloads per paper (D) was normalized by the average download rate of all papers published in the same year to obtain a relative download rate (Drel) independent of a paper’s age. As only
AP papers were compared, a disciplinary normalization was not applied. Values above 1 thus indicate impact above the annual average and values below 1 that a paper was downloaded less than expected. The ten papers with highest overall impact according to normalized citations (Crel,
rank weighted 50%) and usage rates (downloads Drel, 25%; Mendeley readers Rrel, 25%). are
listed in Table 1. Means of relative download rates are provided for SIs and most frequent author keywords.
The share of overall downloads per country was analyzed based on Emerald’s journal usage report including the top 20 downloading countries, which represented 83% of all downloads. Comparing the percentage of downloads to the share of publications per country, countries were identified as producers or consumers of AP output by the difference between knowledge production (percentage of papers) and consumption (percentage of downloads). They were
labeled as producers, if they published a higher share of papers than they downloaded and as consumers, if they downloaded relatively more than they published. If their share of downloads accorded to their share of papers, they were labeled as balanced.
The number of Mendeley readers was collected from the Mendeley API in September 2013 with Webometric Analyst [1] using the last name of the first author, title and year of publication as a query. The number of Mendeley readers provides another perspective on the usage of AP papers, as it reflects the number of users who saved them into their reference manager. Although further research is needed to investigate how far it actually reflects having read the paper, Mendeley readership data also includes some reader demographics such as discipline, academic status and country (Gunn, 2013), so that it is possible to analyze where, by whom and in what disciplines AP papers are most frequently used. Unfortunately, the Mendeley API only provides the information of these demographics for the top three categories per document as a percentage, so that actual reader counts could only be computed for the three most frequent disciplines, statuses and countries per document. To account for this shortcoming as far as possible, missing values were indicated and reader status was analyzed for all documents (n=360), documents without missing values (i.e. where the top three made up 100%; n=136) and documents with less than 33% missing values (n=228). Academic statuses were aggregated into broader categories, that is
Student [Student (Bachelor), Student (Master)], PhD student [Doctoral Student, Ph.D. Student,
Student (Postgraduate)], Professor [Assistant Professor, Associate Professor, Lecturer, Professor, Senior Lecturer], Researcher [Post Doc, Researcher (at an Academic Institution), Researcher (at a non-Academic institution)], Librarian and Other Professions [Other Professional].
With Mendeley reader counts, similar biases occur in terms of publication year as with download counts, so that the same normalization method was applied. The reader count of each document (R) was divided by mean reader rate of its publication year. The mean relative reader rates (Rrel)
were used to evaluate the Mendeley impact of SIs and the most frequent author keywords independent of a paper’s age.
2.4 Citations
If not noted differently, citation indicators are based on the local WoS database. Papers’ normalized citation rates (Crel) take into account the year of publication, document type and
particular research field. The citation window varies depending on the publication year and takes into account all citations until the first 34 weeks of 2013.
To determine similar journals and AP’s position in the journal landscape, a co-citation analysis on journal level was carried out (Small, 1973). It takes into account journals co-cited with AP during the 2003-2012 period and includes 159 journals, which appeared in at least 10 reference lists of WoS papers together with AP and at least one other journal from the network. So-called dangling nodes, i.e. journals only co-cited with AP and no other journal in the network, were thus excluded. A network and cluster analysis was carried out using VOSviewer (see above) applying a cluster resolution of 0.4 with a minimum of 2 items per cluster resulting in 6 clusters grouping between 65 and 6 similar journals. The network shows the 250 strongest normalized co-citation links.
AP’s citation performance was compared to that of eight comparable journals as identified by the cluster analysis (i.e. choosing the three most central journals of the three biggest clusters) with
the help of three citation indicators, namely the relative IF, the Source-Normalized Impact per Paper (SNIP) and the SCImago Journal Rank (SJR) over the 10-year period from 2003 to 2012. The relative IF is an a-posteriori or cited-side normalized metrics indicating a journal’s citation performance relative to the average of its field and as such tries to account for disciplinary differences to enable comparison among journals of various fields (Zitt, 2011). The relative IF presented here is a synchronous citation rate with a five-year publication and one year citation window and corrects for the asymmetry between the numerator and denominator of the Thomson Reuters’ IF as it counts only those citations received by the document types considered in the denominator (Moed and van Leeuwen, 1995; Archambault and Larivière, 2009; Haustein, 2012). The main disadvantage of a posteriori normalizations is that they rely on pre-established journal classifications (Moed, 2005; Leydesdorff and Opthof, 2010; Zitt, 2010). As an a-priori, citing-side or source-normalized indicator, the SNIP tries to overcome the dependence on classification systems by counter-balancing disciplinary differences based on the number of references and the age of citing sources (Waltman & van Eck, 2010; Zitt 2010). Source-normalized journal indicators are based on the fractional citation counts (Small & Sweeney, 1985). SNIP was introduced by Moed (2010) and is based on the Scopus database. It compares the journal’s citation impact to that of the citation potential of its field with is delimited as the average number of references of the papers citing that journal. SJR is a recursively weighted journal citation indicator, which based on the eigenvector centrality by Bonacich (1972) and similar to Pinski and Narin’s (1976) influence weight or Google’s PageRank (Brin and Page, 1998), assigns more weight to citations from prestigious journals. The SJR was introduced by the SCImago Research Group (2007) and Falagas et al. (2008) and has a three-year publication and one year citation window, is compiled only for articles, proceedings papers and reviews and limits journal self-citations (Gonzalez-Pereira et al., 2010). Both SJR and SNIP values were taken from Elsevier’s Journal Metrics website [2] in October 2013, which represent slightly modified versions (SNIP2 and SJR) of the original indicators, which aim at reducing the impact of outliers and journals with a small number of references (e.g., trade journals).
2.5 Management
The analysis of journal management is restricted to basic information about the journal, such as SI, and editorial advisory board as indicated on the journal homepage [3] and Ulrich’s Web [4], as more specific information such as rejection rates, the time of the review process and publication lag (Haustein, 2012) was not available.
3 Results and Discussion
AP is a peer-reviewed Library and Information Science (LIS) and information management journal and the main publication venue for the British ASLIB-Association for Information Management, former Association of Special Libraries and Information Bureaux founded in 1924 [5]. AP was established in 1949 and is published bimonthly by Emerald [6]. It is covered by both WoS and Scopus.
3.1 Producers and development of AP output
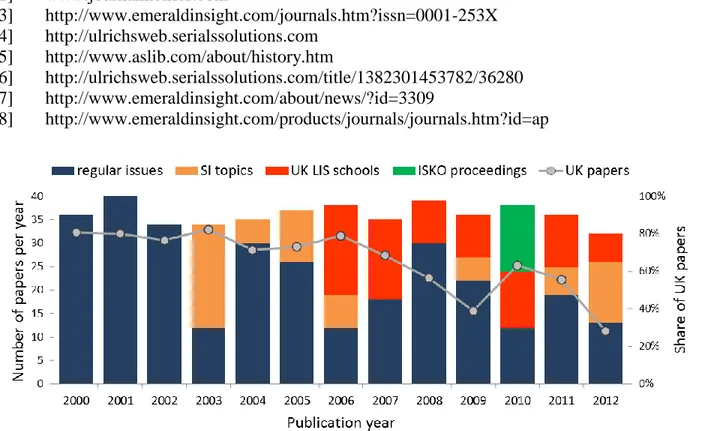
The annual output of AP between 2000 and 2012 was quite stable around 36 papers per year (Figure 1). The journal regularly published SIs since 2003, the first one being a double issue on “Knowledge production, consumption and impact”. Starting in 2006 with his own Department of Information Studies at University College London, the then editor-in-chief David Nicholas introduced regular SIs on LIS schools in the UK. After a decade of gatekeeping by Nichols,
Amanda Spink took over as editor-in-chief in 2012 [7] and was followed by Dirk Lewandowski in 2013.
AP can be considered as a truly British journal with 39% of its Editorial Advisory Board members based in the UK and two-thirds of its 2000-2012 papers authored by or in collaboration with at least one British institution. However, the periodical has become more international over the years, as the percentage of papers published by UK authors was decreasing in favor of more international contributions. This trend towards internationalization started already in the early 1980s (1982: 85% of papers with UK author) and continued until 1992 (35%), after which the share of papers with British authors again increased to 85% in 1999. The development since 2000 from a truly national to more international journal can be seen in Figure 1.
– INSERT FIGURE 1 HERE – – INSERT FIGURE 2 HERE –
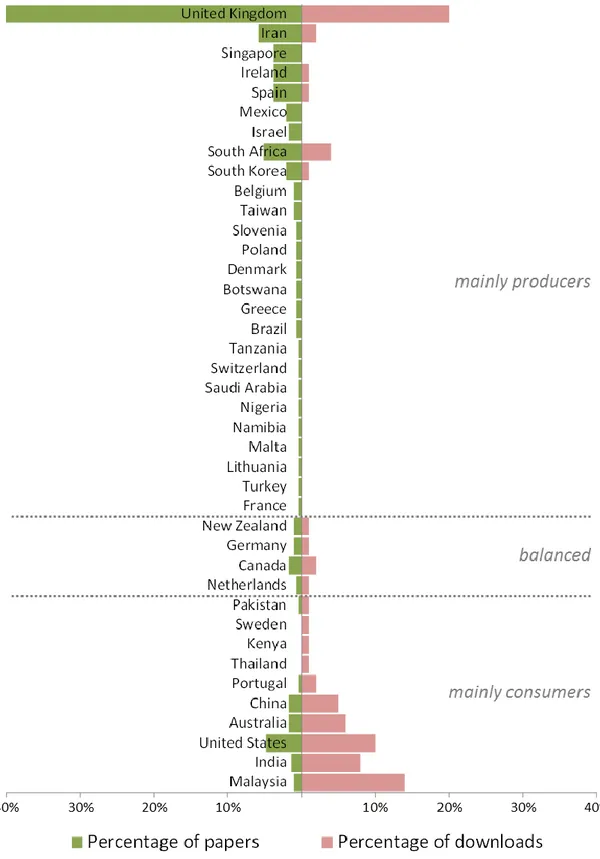
The largest share of AP papers in the last eight years were written by authors affiliated to UK (58%%), Iran (6%), South Africa and US (both 5%), the unusual high share of Iranian and South African papers can be partly explained by the two SIs “Iranian LIS Research” (6/2011) and “Africa” (5/2012). Publications were mostly downloaded in the UK (20%), Malaysia (14%), the US (10%), India (8%) and Australia (6%). The share of papers and downloads per country were juxtaposed in Figure 2, ordering and grouping them according to the difference between the two percentages. The UK, Iran, Singapore, Ireland, Spain and 21 other countries were identified as mostly producers of AP content, since, in relative terms, they published more than they downloaded. On the other hand, Malaysia, India, the US, Australia, China, Portugal and four other countries were mainly consumers of AP. New Zealand, Germany, Canada and the Netherlands had a balanced knowledge production and consumption of AP during the period analyzed.
Information, library, study and case study were the most frequent noun phrases in AP papers’
titles between 2003 and 2012. The development of topics published during the last two five-year periods as reflected in the noun phrases of article titles is presented in the co-occurrence networks in can be observed in Figure 3. Colors indicate cluster affiliation based on similarity, i.e. co-occurrence of terms. The most striking development is that of the decentralization of topics in AP. While during the first period at least two very dense clusters (library and information
literacy and health information and use) occurred, terms were not as connected in the later
period. However, a certain continuation of central terms like information, library, use, education and development can be observed, as they occurred in almost the same number of titles during both periods. On the other hand, among the most frequent terms case study, study, knowledge and
behaviour have gained importance during the second period and articles with the noun phrase
journal in the title appeared for the first time in 2009. Note that titles with noun phrases containing journal, such as high impact journal, journal diffusion factor and scholarly e-journal, were published before. The number of titles with evaluation and person in the title decreased and
research and health information (SI “Health informatics” 4/2003) vanished entirely during the
second period.
The two aspects of impact of AP 2000-2012 papers, that is the impact on citing authors as measured by the number of citations and the impact on the entire readership including those readers who do not publish, is visualized in Figure 4. Readership was measured by the number of downloads from the publisher’s homepage and the number of readers on Mendeley. As expected, the mean citation rate decreases the younger the papers. The same is true for the download rate with the exception of 2000 and 2001, which is most likely caused by the uptake of electronic versions of journal articles. A similar bias can be observed in the number of Mendeley readers. As the service was only launched in 2008, there is a certain bias towards more recent papers, although, just as with downloads, there is a readership lag for the papers published after 2009. These biases expose the need for normalization of citation, download and Mendeley reader counts as described in the Methods section and applied in the analysis of documents, SIs and author keywords below.
– INSERT FIGURE 4 HERE –
3.2 AP’s position and standing in the journal citation network
In the following, AP was observed in its citation network based on co-citations. The network graph (Figure 5) thus depicts the landscape of similar journals, i.e. those journals that frequently occur together with AP in the reference lists of papers (irrespective of the citing journal). As to be expected, the journal co-citation network is centered on AP, as by definition each of the other 158 journals has been co-cited with the journal under evaluation. The sum of the weighted connections, i.e. the sum of the co-citations with the 158 journals of AP, is 7,962. Thus, it is located at the center of the network presented in Figure 5. However, JASIST has an almost equally important position, since, as indicated by the node size, it has almost as many connections, i.e. sum of co-citations, as AP. JASIST was co-cited with 140 journals of the network 6,994 times and is also part of the largest Cluster 1, which groups 65 frequently co-cited journals. Cluster 1 can be labeled Information Science and Library Science, as its central journals are JASIST, Journal of Documentation, Journal of Information Science, Information Processing & Management, Annual Review of Information Science and Technology and Library & Information Science Research. AP was assigned to the second largest Cluster 2 containing 54 journals with a strong focus on management in general and information management in particular. Other central journals of Cluster 2, which is densely connected, are Communications of the ACM, MIS Quarterly and Information & Management. Cluster 3 can be labeled bibliometrics and research evaluation with Scientometrics, Science, PNAS as the most central of the 13 journals. Journal of Informetrics, Nature, Research Evaluation, Research Policy and Social Studies of Science also belong to Cluster 3. Cluster 4 (11 journals), which is dominated by the British Medical Journal, JAMA, Social Science & Medicine and the Journal of Medical Internet Research, has a strong medical focus and is the most remote cluster of the network. The central theme of Cluster 5 (9 journals) is computers, while Cluster 6 (7 journals) can be described as communication and media research. Overall, the co-citation analysis reflects that AP is positioned in the center of various LIS and information management journals, which perfectly reflects its scope to cover “international research and practice in library and information science, and information management”[8].
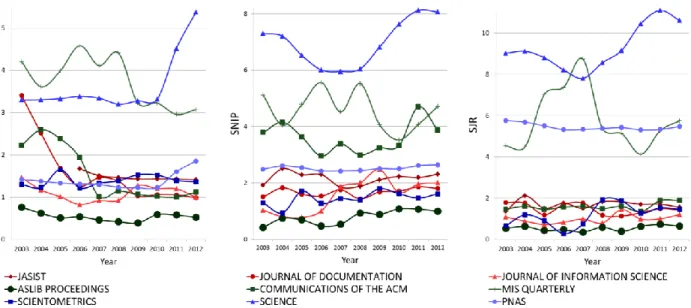
Comparing the most central journals of the three biggest clusters in terms of their overall citation performance (Figure 6), it becomes obvious that Science and MIS Quarterly always have the highest impact regardless of the indicator used and AP always scores lowest. MIS Quarterly had the highest field-normalized IF until it decreased rapidly in 2009. Large decreases can also be observed for Journal of Documentation, which dropped from the second highest relative IF (3.401) among the nine comparables in 2003 to the second lowest (0.990) just behind Journal of Information Science in 2012 and Communications of the ACM from third in 2004 (2.591) to sixth in 2012 (1.116). The general science journals Science and PNAS have stable relative IFs around 3.6 and 1.4, respectively, but both show increases since 2011. Although AP’s non-normalized IF has increased over the years from 0.339 (2003, data not shown) to 0.634 (2011) and 0.560 (2012), its relative IF decreased from 0.760 to 0.525 which reflects the increasing citation impact of the LIS category overall. Regardless of using the normalized or not normalized methods, AP cannot keep up with the citation impact of the eight comparables, i.e. the central journals of its co-citation network (Figure 5). SNIP, which normalizes disciplinary differences independent of pre-established journal classifications, ranks Communications of the ACM higher than with the relative IF, and Scientometrics lower. Of the central journals of the biggest clusters in Figure 5, JASIST is the clear leader with an average SNIP of 2.2 during the 10-year period. Although AP has also the lowest impact scores according to SNIP, its values have more than doubled from 0.421 in 2003 to 1.075 and 0.991 in 2012.
– INSERT FIGURE 6 HERE –
SJR, which takes into account the impact of the citing sources, shows the most skewed results. It thus reflects that Science (average SJR of 9.2 from 2003 to 2012), MIS Quarterly (5.8) PNAS (5.4) were cited frequently by other high-impact journals, whereas the other six journals follow far behind with SJRs around or below 2. While PNAS, JASIST, Communications of the ACM, Journal of Documentation, Journal of Information Science and AP show stable SJR values over the 10 years, MIS Quarterly’s weighted citation impact fluctuates and both Science and Scientometrics show increasing SJRs in the more recent years. Especially the latter could improve its ranking by three positions from last of the nine behind AP in 2006 to sixth in 2011 and 2012.
The juxtaposition of the three journal citation indicators shows that, although Science and MIS Quarterly could be identified as high- and AP as low-citation impact journals, in-between rankings vary heavily depending on the method used. This emphasizes the importance of a multi-dimensional approach (Haustein, 2012).
3.3 AP and Mendeley readers
Of the 470 AP papers published between 2000 and 2012, 360 could be found on Mendeley, which amounts to a coverage of 77%. This is higher than the 44% of Social Science articles and 66% of 1.4 million PubMed papers found by Mohammadi and Thelwall (in press) and Haustein
et al. (submitted), respectively, but lower than the Mendeley coverage reported for Science and
Nature papers, which was above 90% (Li et al., 2012). As shown in Figure 4, Mendeley coverage was highest for papers published in 2006 (92%) and lowest for the most recent papers (38%). This indicates that Mendeley users of AP do not read the newest literature or it takes them a while to upload it to their account. The peak of the readers per paper curve in 2009, also shows that currently the most popular AP documents on Mendeley are between four and five years old.
The document with the highest impact on Mendeley (129 readers, Rrel=9.7) was Selwyn’s “The
digital native – myth and reality” (Table 1, Figure 9).
As shown above, AP papers were mainly downloaded in the UK, Malaysia, the US, India and Australia (Figure 2). Mendeley readers of AP articles were mainly from the US (14%), UK (12%), Spain (6%), India (4%), Canada (3%), South Africa (3%) and Malaysia (2%). As stated in the methods above, readership information is limited to the top three categories per document, so that the share of readers of countries that often make it to the top three is overestimated (360 papers, 1,932 readers, 1,334 readers missing; data shown in Figure 7). Thus, the ranking changed, if documents without missing values (146 papers, 292 readers, 0 readers missing) or with less than one third of readership information missing (204 papers, 629 readers, 97 readers missing) were considered. The top five countries were Spain (17%), UK (16%), India (11%), US (11%), Canada (5%) or UK (17%), US (16%), Spain (14%), India (7%), South Africa (5%), respectively.
– INSERT FIGURE 7 HERE –
In addition to the location of readers, Mendeley makes it also possible to examine who the readers are in terms of discipline and academic or career status. Figure 8 shows that of the 3,266 Mendeley users, who had stored AP papers in their library, 26% were PhD students [=601 PhD students, 139 doctoral students, 116 students (postgraduate)], 16% were students [=442 students (Master), 87 students (=Bachelor)], 12% librarians [=391] and 8% professors [=91 professors, 67 assistant professors, 43 associate professors, 43 lecturers, 30 senior lecturers]. This reflects results by previous studies (Mohammadi et al, submitted; Schlögl et al., 2013; Zahedi et al., 2013), where a large share of Mendeley readers were PhD students and postdoctoral researchers. Ranks 2 to 4 were reversed when based on documents with no missing readership statuses, that is 19% professors, 19% librarians and 18% students (Figure 8). With more than one third (35%) of the population, PhD students remained the largest reader group on Mendeley. Most readers where from the disciplines of Computer and Information Science (all documents: 37%; without missing values: 43%; <33% missing values: 38%) and Social Science (26%; 35%; 27%) and to a much lesser extent from Education (8%; 5%; 8%), Business Administration (6%; 7%; 6%) and Management Science & Operations Research (2%; 2%; 2%).
– INSERT FIGURE 8 HERE –
Mendeley reflects another form of article usage, which might be closer to measuring readership than downloads as the level of engagement is higher and the activity is linked to an individual profile (Haustein, in press). Gaming is thus limited to one reader count per profile. Although more research is needed to confirm whether saving a document to a user library actually reflects reading it, as well as on the proportion of scholars using the platform, Mendeley seems to be a promising source to measure article impact in a broader manner than citations.
3.4 The various impacts of research topics
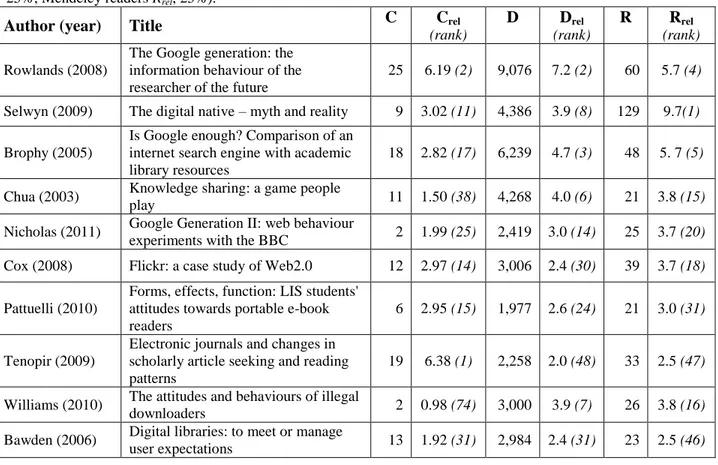
The papers with the highest overall impact based on citation, download and Mendeley reader counts (Table 1) reflect a strong focus on the web and Google in particular, which was also noted by an editorial on the occasion of AP’s 60th
anniversary: “e-mail, knowledge management and anything to do with Google are very popular topics, attracting large numbers of downloads” (Nicholas and Rowlands, 2008). These topics are relevant to a broad readership and their titles
might have attracted a more general audience than just the LIS community. While Rowlands’ “The Google generation: the information behaviour of the researcher of the future” also obtained the second highest citation rate and thus shows high scientific impact, rankings based on citation and usage impact differ, as it is also shown in the scatterplots of Figure 9. Although the two usage-based indicators Drel and Rrel show the highest correlations, they do not measure the same
kind of usage (different levels of engagement) and readership (different audiences). – INSERT TABLE 1 HERE –
Among those papers that have not received any citations, Waller’s “The impact of e-mail on work-life balance” (Drel=4.2, rank=5; Rrel=7.7, rank=2) and Chen’s “Information literacy in
university library user education” (Drel=2.7, rank=20; Rrel=3.4, rank=25) are among the most
downloaded and most popular on Mendeley. That high usage is not a guarantee for high citations, is shown by Kirriemuir’s “Accessing electronic information sources through computer games consoles”, which has not been cited but is very popular on Mendeley (Rrel=5.6, rank=6). As the
download rate was 40% below average (Drel=0.6, rank=280), this is an interesting example of
high social medial mentions for web- and social-media related topics, computer and video-games, and curious or fashionable stories.
– INSERT FIGURE 9 HERE –
On the other hand, Thelwall’s “An initial exploration of the link relationship between UK university Web sites” (Crel=2.47, rank=19; Drel=0.2, rank=454) and Mabe’s “Dr Jekyll and Dr
Hyde: author-reader asymmetries in scholarly publishing” (Crel=2.75, rank=18; Drel=0.3,
rank=444) show the largest differences between citation and download ranks, in so far as they have been ranked high according to citations and low in terms of downloads. This could reflect especially high scientific impact, as a large share of those who read it cited it. However, the low number of downloads from the publisher’s website can also be influenced by author self-archiving.
– INSERT FIGURE 10 HERE –
Figure 10 compares citations, downloads and Mendeley readers of SIs to normal issues. From a citation perspective, SIs do not “pay off” in most cases: the SI on blogs is the only AP issue, which managed to receive a citation impact above the world (Crel=1.07) compared to other
journals in the LIS field. Two other SIs, i.e. British L&I schools: City University London (Crel=0.86) and Knowledge production, consumption and impact (Crel=0.83) obtained slightly
higher citation rates than normal issues (0.60). However, from a usage perspective, many SIs receive more attention than average, i.e. six SIs are more downloaded than normal issues. That is, three on particular L&I schools (London Metropolitan University, Drel=1.84; Manchester Metropolitan University, Drel=1.47; Sheffield University, Drel=1.19) and those on Blogs
(Drel=1.48), Information disparity (Drel=1.13) and Knowledge production, consumption and impact (Drel=0.86). Impact on Mendeley readership is above average for seven SIs, four of which
are on L&I schools. This might be influenced by and reflect the high share of Master’s and PhD students, who store their own or articles of fellow students on Mendeley. The SIs on
Implementing digital publications: Mexico (Rrel=1.80), Advances in e-democracy (Rrel=1.51) and Blogs (Rrel=1.23) also receive above average attention on Mendeley. It becomes apparent that the Blogs SI has by far received the greatest impact overall.
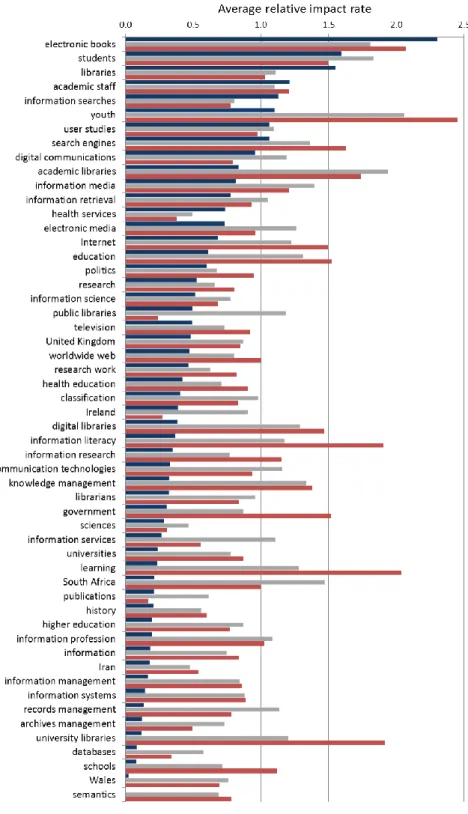
If applied on the level of most frequent author keywords (Figure 11), differences between the usage and citation impact of topics becomes even more apparent. While the most frequent author keywords between 2003 and 2012 were United Kingdom (51), Internet (50) and Information
Retrieval (40), those with the highest citation impact were electronic books (Crel=2.30), students
(Crel=1.60) and libraries (Crel=1.55). Five other keywords also received citation rates above
world average, namely academic staff (Crel=1.21), information searches (Crel=1.13), youth
(Crel=1.10), user studies (Crel=1.06) and search engines (Crel=1.06). Semantics, Wales, school,
and databases received the lowest citation rates.
– INSERT FIGURE 11 HERE –
Except for academic libraries and South Africa, those keywords with the highest download rates are also among the highly cited ones. A different picture presents itself, when comparing citation with Mendeley reader rates. Even though the two most popular Mendeley author keywords are also highly cited (youth, Rrel=2.5; electronic book, Rrel=2.1), 7 of the top 10 Mendeley terms are
cited below average, i.e. learning (Rrel=2.0, Crel=0.23), university libraries (Rrel=1.9, Crel=0.12), information literacy (Rrel=1.9, Crel=0.37), academic libraries (Rrel=1.7, Crel=0.84), education
(Rrel=1.5, Crel=0.61), government (Rrel=1.5, Crel=0.30) and internet (Rrel=1.5, Crel=0.68). Since
these topics suggest a high level of relevance in teaching and LIS practice, the gap between the two types of impact might reflect the usage by librarians and students on Mendeley, who read (to learn and apply information in their daily work) but do not cite in general.
4 Conclusions
This paper provided an empirical analysis of AP, focusing on five dimensions of journal evaluation (Juchem et al., 2006; Haustein, 2012): output, content, perception and usage, impact and management. It showed that, although the journal has a strong focus on the UK in terms of authors and readers, the share of British authors has decreased since 2006, making room for more international authors which, in turn, provides evidence of the internationalization of LIS research. Countries’ have a different relation with the journal: while some are mainly producers of papers (e.g., UK, Iran, Singapore), some others are mostly users (e.g., Malaysia, India, United States). Topics covered by AP became more diverse over time, and are not equal in terms of impact. The highest citation impact is obtained by an SI on blogs and papers related to electronic books, students and libraries.
Comparing usage with citation data has also shown that some topics (e.g., learning, university
libraries, information literacy) have high practical relevance not reflected by citation impact.
This suggests that citation and usage statistics indicate a different kind of impact and, often, on a different community. An analysis of correlations between citations and both usage metrics (downloads and Mendeley readership) confirmed that the two groups of indicators measure different facets of the impact of scholarly papers. Moreover, the correlation between downloads and Mendeley readers was only moderate, which suggest that Mendeley is biased towards students and younger researchers, a bias that could come in handy, when the impact on this user group is of interest.
The journal co-citation analysis has shown that AP is positioned in the midst of LIS and information management journals, thus reflecting the scope of the journal. Compared with other journals identified based on the co-citation network, AP obtains the lowest citation impact.
Readership and download data indicate that it nonetheless fulfills an important function in the LIS ecosystem, as a source of information not only for the research community, but also for the other groups revolving around ASLIB, such as professionals and students; a kind of impact undetected by the IF and other citation-based measures.
Based on an analysis of AP, this study has exemplarily shown that journal impact is a multifaceted notion that a single citation indicator such as the IF is not able to capture. Only a multidimensional approach is able to reflect strengths and weaknesses of scholarly journals adequately. Not all indicators are equally important for the four stakeholders of journal evaluation, nor are all necessary. Publishers monitor journal performance differently than librarians, authors choose journals differently than readers and the latter can even be further divided into researchers, students and practitioners. But as these groups place different emphasis on various indicators and some measures might even be interpreted differently, a multidimensional approach to journal evaluation – in which all different variables are preserved and not blended into one composite indicator – is essential.
References
Adam, D. (2002), “The counting house”, Nature, Vol. 415 No. 6873, pp. 726–729.
Archambault, É. and Larivière, V. (2009), “History of the journal Impact Factor: Contingencies and consequences”, Scientometrics, Vol. 79 No. 3, pp. 635–649.
Bonacich, P. (1972), “Factoring and weighting approaches to clique identification”, Journal of
Mathematical Sociology, Vol. 2 No.1, pp. 113–120.
Bradford, S.C. (1934), “Sources of information on specific subjects”, Engineering, Vol. 137 Nno. 4, pp. 85–86.
Brin, S. and Page, L. (1998), “The anatomy of a large-scale hypertextual web search engine”,
Computer Networks and ISDN Systems, Vol. 30 No. 1-7, pp. 107–117.
Coleman, A. (2007), “Assessing the value of a journal beyond the impact factor”, Journal of the
American Society for Information Science and Technology, Vol. 58 No. 8, pp. 1148–1161.
DORA (2013), “San Francisco Declaration on Research Assessment”, available at: http://am.ascb.org/dora (accessed 28 November 2013).
Falagas, M.E., Kouranos, V.D., Arencibia-Jorge, R. and Karageorgopoulos, D.E. (2008), “Comparison of SCImago journal rank indicator with journal impact factor”, FASEB
Journal, Vol. 22 No. 8, pp. 2623–2628.
Garfield, E. (1955), “Citation indexes for science. A new dimension in documentation in association of ideas”, Science, Vol. 122 No. 3159, pp. 108–111.
Garfield, E. (1972), “Citation analysis as a tool in journal evaluation. Journals can be ranked by frequency and impact of citations for science policy studies”, Science, Vol. 178 No. 4060, pp. 471–479.
Garfield, E. and Sher, I. H. (1963), “New factors in evaluation of scientific literature through citation indexing”, American Documentation, Vol. 14 No. 3, pp. 195–201.
Glänzel, W. and Moed, H. (2002), “Journal impact measures in bibliometric research”,
Scientometrics, Vol. 53 No. 2, pp. 171–193.
Gonzalez-Pereira, B., Guerrero-Bote, V. P., and de Moya-Anegon, F. (2010), . “A new approach to the metric of journals’ scientific prestige: The SJR indicator”, Journal of Informetrics, Vol. 4 No. 3, pp. 379–391. Grazia Colonia (2002), “Informationswissenschaftliche Zeitschriften in szientometrischer Anlayse”, Kölner Arbeitspapiere zur Bibliotheks- und
Informationswissenschaft, 33, Cologne, available at: http://opus.bibl.fh-koeln.de/volltexte/2003/36/pdf/grazia.pdf (accessed 28 November 2013)
Gross, P.L.K. and Gross, E.M. (1927), “College libraries and chemical education”, Science, Vol. 66 No. 1713, 385–389.
Gunn, W. (2013), “Social signals reflect academic impact: What it means when a scholar adds a paper to Mendeley”, Information Standards Quarterly, Vol. 25 No. 2, pp. 33–39.
Haustein, S. (2012), Multidimensional journal evaluation. Analyzing scientific periodicals
beyond the impact factor, De Gruyter Saur, Berlin/Boston.
Haustein, S. (in press), “Readership metrics”, Cronin, B. and Sugimoto, C.R., Bibliometrics and
beyond: Metrics-based evaluation of scholarly research, MIT Press, Cambridge, MA, pp.
327–344.
Haustein, S., Larivière, V., Thelwall, M., Amyot, D. and Peters, I. (in press), “Tweets vs. Mendeley readers: How do these two social media metrics differ?”, IT – Information
Technology.
Haustein, S. and Peters, I. (2012), “Using social bookmarks and tags as alternative indicators of journal content description”, First Monday, Vol. 17 No. 11, available at: http://firstmonday.org/ojs/index.php/fm/article/view/4110 (accessed 28 November 2013). Haustein, S., Peters, I., Sugimoto, C.R., Thelwall, M. and Larivière, V. (2014), “Tweeting
biomedicine: an analysis of tweets and citations in the biomedical literature”, Journal of
the Association for Information Science and Technology, Vol. 65 No. 4, pp. 656-669.
Juchem, K., Schlögl, C., and Stock, W. G. (2006), “Dimensionen der Zeitschriftenszientometrie am Beispiel von ‘Buch und Bibliothek’”, Information. Wissenschaft & Praxis, Vol. 57 No. 1, pp. 31–37.
Leydesdorff, L. and Opthof, T. (2010), “Normalization on the field level: Fractional counting of citations”, Journal of Informetrics, Vol. 4 No. 4, pp.644–646.
Li, X., Thelwall, M. and Giustini, D. (2012), “Validating online reference managers for scholarly impact measurement”, Scientometrics, Vol. 91 No. 2, pp. 461–471.
Mabe, M.A. and Amin, M. (2002), “Dr Jekyll and Dr Hyde: author-reader asymmetries in scholarly publishing”, Aslib Proceedings, Vol. 54 No. 3, pp. 149–157.
Moed, H.F. (2005), Citation Analysis in Research Evaluation, Springer, Dordrecht.
Moed, H. F. (2010), “Measuring contextual citation impact of scientific journals”, Journal of
Informetrics, Vol. 4 No. 3, pp. 265–277.
Moed, H. F. and van Leeuwen, T. N. (1995), “Improving the accuracy of Institute for Scientific Information’s journal Impact Factors”, Journal of the American Society for Information
Science, Vol. 46 No. 6, pp. 461–467.
Moed, H.F., van Leeuwen, T.N. and Reedijk, J. (1998), “A new classification system to describe the ageing of scientific journals and their impact factors”, Journal of Documentation, Vol. 54 No. 4, pp. 387–419.
Mohammadi, E. and Thelwall, M. (in press), “Mendeley readership altmetrics for the social sciences and humanities: Research evaluation and knowledge flows”, Journal of the
American Society for Information Science and Technology. doi: 10.1002/asi.23071
Mohammadi, E., Thelwall, M, Larivière, V. and Haustein, S. (in press), “Who reads research articles? An altmetrics analysis of Mendeley user categories.”, Journal of the Association
for Information Science and Technology.
Nicholas, D., Huntington, P., Jamali, H. R., Rowlands, I., Dobrowolski, T. and Tenopir, C. (2008), “Viewing and reading behaviour in a virtual environment - The fulltext download and what can be read into it”, Aslib Proceedings, Vol. 60 No. 3, pp. 185–198.
Nicholas, D. and Rowlands, I. (2008) "Aslib Proceedings is 60 years old", Aslib Proceedings, Vol. 60 No. 4.
Nisonger, T.E. (1999), “JASIS and library and information science journal rankings: A review and analysis of the last half-century”, Journal of the American Society of Information
Science, Vol. 50 No. 11, pp. 1004–1019.
Pinski, G. and Narin, F. (1976), “Citation influence for journal aggregates of scientific publications – theory with application to literature of physics”, Information Processing &
Management, Vol. 12 No.5, pp. 297–312.
Project COUNTER (2008), “The COUNTER code of practice. Journals and databases release 3”, available at: http://www.projectcounter.org/r3/Release3D9.pdf (assessed 11 September 2013).
Rousseau, R. (2002), “Journal evaluation: Technical and practical issues”, Library Trends, Vol. 50 No. 3, 418–439.
Rowlands, I. and Nicholas, D. (2007), “The missing link: Journal usage metrics”, Aslib
Proceedings, Vol. 59 No. 3, pp. 222–228.
Salton, G. and McGill, M.J. (1987), Introduction to Modern Information Retrieval, McGraw-Hill, New York, NY.
Schlögl, C., Gorraiz, J., Gumpenberger, C., Jack, K. and Kraker, P. (2013), “Download vs. citation vs. readership data: The case of an Information Systems journal”, Proceedings of
the 14th International Society of Scientometrics and Informetrics Conference, Vol. 1, pp.
626–634.
Schmid, H. (1994), “Probabilistic part-of-speech tagging using decision trees”, in Proceedings of
the International Conference on New Methods in Language Processing, Manchester, pp.
44–49.
SCImago Research Group (2007), “Description of SCImago Journal Rank Indicator”, available at: http://www.scimagojr.com/SCImagoJournalRank.pdf (assessed 28 November 2013). Small, H. (1973), “Co-citation in scientific literature – new measure of relationship between 2
documents”, Journal of the American Society for Information Science, Vol. 24 No. 4, pp. 265–269.
Small, H. and Sweeney, E. (1985), “Clustering the Science Citation Index using co-citations I. A comparison of methods”, Scientometrics, Vol. 7 No. 3-6, pp. 391-409.
The PLoS Medicine Editors (2006), “The impact factor game – It is time to find a better way to assess the scientific literature”, PLoS Medicine, Vol. 3 No. 6, e291.
Todorov, R. and Glänzel, W. (1988), “Journal citation measures – a concise review”, Journal of
Information Science, Vol. 14 No. 1, pp. 47–56.
Van Eck, N. J. and Waltman, L. (2009), ”How to normalize cooccurrence data? An analysis of some well-known similarity measures”, Journal of the American Society for Information
Science and Technology, Vol. 60 No. 8, pp. 1635–1651.
Van Eck, N. J. and Waltman, L. (2010), “Software survey: VOSviewer, a computer program for bibliometric mapping”, Scientometrics, Vol. 84 No. 2, pp. 523–538.
Van Eck, N.J., Waltman, L., Noyons, E.C.M. and Buter, R.K. (2010), “Automatic term identification for bibliometric mapping”, Scientometrics, Vol. 82 No. 3, pp. 581–596. Van Leeuwen, T.N. and Moed, H.F. (2002), “Development and application of journal impact
measures in the Dutch science system”, Scientometrics, Vol. 53 No. 2, pp. 249–266. Waltman, L. and van Eck, N. J. (2010), “The relation between eigenfactor, audience factor, and
influence weight”, Journal of the American Society for Information Science and
Zahedi, Z., Costas, R. and Wouters, P. (2013), “What is the impact of the publications read by the different Mendeley users? Could they help to identify alternative types of impact?”, Presentation held at the PLoS ALM Workshop 2013 in San Francisco, available at: http://lanyrd.com/2013/alm13/scrdpk/ (accessed 28 November 2013).
Zitt, M. (2010), “Citing-side normalization of journal impact: A robust variant of the Audience Factor”, Journal of Informetrics, Vol. 4 No.3, pp. 392–406.
Zitt, M. (2011), “Behind citing-side normalization of citations: some properties of the journal impact factor”, Scientometrics, Vol. 89 No. 1, pp. 329–344.
Notes
[1] Webometric Analyst is available at: http://lexiurl.wlv.ac.uk/ [2] www.journalmetrics.com [3] http://www.emeraldinsight.com/journals.htm?issn=0001-253X [4] http://ulrichsweb.serialssolutions.com [5] http://www.aslib.com/about/history.htm [6] http://ulrichsweb.serialssolutions.com/title/1382301453782/36280 [7] http://www.emeraldinsight.com/about/news/?id=3309 [8] http://www.emeraldinsight.com/products/journals/journals.htm?id=ap
Figure 2. Producing vs. consuming countries of Aslib Proceedings papers. Countries are ordered by the difference
Figure 3. Co-occurrence networks of noun phrases in titles of papers published between 2003 and 2007 and 2008
and 2012. Noun phrases are shown, if they occurred at least in two titles. Edges represent co-occurrences and node size indicates number of occurrences
Figure 4. Percentage of documents with at least one citation or reader on Mendeley and mean citation, reader and
download (per 100 documents) rate for AP papers published between 2000 and 2012.
Figure 5. Journal co-citation network of AP based on citations from 2003 to 2012. Edges represent the 250 strongest
normalized connections based on the number of co-citations. Cluster cores are circled, the most frequently co-cited journal per cluster is labeled.
Figure 6. 5-year relative IF, SNIP and SJR for the three most connected journals for Cluster 1 (JASIST, Journal of
Documentation, Journal of Information Science), Cluster 2 (AP, Communications of the ACM, MIS Quarterly) and Cluster 3 (Scientometrics, Science, PNAS).
Figure 7. Countries of Mendeley readers of AP papers published between 2000 and 2012 (n=360; 3,266 readers).
The country could not be identified for 1,334 readers due to Mendeley API restrictions or because readers did not indicate country.
Figure 9. Scatter plot of number of relative citations (Crel), normalized downloads (Drel) and Mendeley normalized
Mendeley readers (Rrel) for AP papers published between 2000 and 2012. A plots Crel against Drel, size of data points
represents Rrel, B plots Crel against Rrel, size shows Drel, C plots Drel against Rrel, size shows Crel. All correlations are
significant at the 0.01 level (2-tailed).
Figure 10. Average relative citation, download and Mendeley readership rates for AP SIs published between 2003
Figure 11. Average relative citation, download and Mendeley readership rates for author keywords assigned to more
Table 1. The 10 most used (downloads Mendeley readers) and cited of AP papers published between 2000 and 2012
with the absolute and normalized citation (C; Crel), download (D; Drel) and Mendeley reader (R; Rrel) counts. Ranking
is based on the average ranks of normalized citations (Crel, rank weighted 50%) and usage rates (downloads Drel,
25%; Mendeley readers Rrel, 25%).
Author (year) Title C Crel
(rank) D Drel (rank) R Rrel (rank) Rowlands (2008)
The Google generation: the information behaviour of the researcher of the future
25 6.19 (2) 9,076 7.2 (2) 60 5.7 (4)
Selwyn (2009) The digital native – myth and reality 9 3.02 (11) 4,386 3.9 (8) 129 9.7(1)
Brophy (2005)
Is Google enough? Comparison of an internet search engine with academic library resources
18 2.82 (17) 6,239 4.7 (3) 48 5. 7 (5)
Chua (2003) Knowledge sharing: a game people
play 11 1.50 (38) 4,268 4.0 (6) 21 3.8 (15)
Nicholas (2011) Google Generation II: web behaviour
experiments with the BBC 2 1.99 (25) 2,419 3.0 (14) 25 3.7 (20)
Cox (2008) Flickr: a case study of Web2.0 12 2.97 (14) 3,006 2.4 (30) 39 3.7 (18)
Pattuelli (2010)
Forms, effects, function: LIS students' attitudes towards portable e-book readers
6 2.95 (15) 1,977 2.6 (24) 21 3.0 (31)
Tenopir (2009)
Electronic journals and changes in scholarly article seeking and reading patterns
19 6.38 (1) 2,258 2.0 (48) 33 2.5 (47)
Williams (2010) The attitudes and behaviours of illegal
downloaders 2 0.98 (74) 3,000 3.9 (7) 26 3.8 (16)
Bawden (2006) Digital libraries: to meet or manage