HAL Id: pastel-00711493
https://pastel.archives-ouvertes.fr/pastel-00711493
Submitted on 25 Jun 2012HAL is a multi-disciplinary open access archive for the deposit and dissemination of sci-entific research documents, whether they are pub-lished or not. The documents may come from teaching and research institutions in France or abroad, or from public or private research centers.
L’archive ouverte pluridisciplinaire HAL, est destinée au dépôt et à la diffusion de documents scientifiques de niveau recherche, publiés ou non, émanant des établissements d’enseignement et de recherche français ou étrangers, des laboratoires publics ou privés.
concept of intermediate temperature fuel cell
Joao Abreu
To cite this version:
Joao Abreu. Contribution to the development of IDEAL-Cell, a new concept of intermediate tem-perature fuel cell. Materials. École Nationale Supérieure des Mines de Paris, 2011. English. �NNT : 2011ENMP0093�. �pastel-00711493�
École doctorale n
O432 :
Sciences des Métiers de l’Ingénieur
T H È S E
pour obtenir le grade de docteur délivré par
l’École Nationale Supérieure des Mines de Paris
Spécialité « Sciences et Génie des Matériaux »
présentée et soutenue publiquement par
João ABREU
le 5 Décembre 2011
Contribution au développement d’IDEAL-Cell, un nouveau
concept de pile à combustible à température intermédiaire
Contribution to the development of IDEAL-Cell,
a new concept of intermediate temperature fuel cell
Directeur de thèse : Alain THOREL
co-encadrement de thèse : Anthony CHESNAUD
Jury
Christian GUIZARD,Directeur de recherche, Laboratoire de Synthèse et Fonctionnalisation des Céramiques,
Saint-Gobain/CNRS Président du jury
Rose-Noëlle VANNIER,Professeur, Ecole Nationale Supérieure de Chimie de Lille Rapporteur Fabrice MAUVY,Professeur, Université de Bordeaux Rapporteur Daria VLADIKOVA,Professeur, Bulgaria Academy of Sciences Examinateur Dominique JEULIN,Directeur de recherche, Ecole Nationale Supérieure des Mines de Paris Examinateur Guilhem DEZANNEAU,Chargé de recherche, Ecole Centrale de Paris Examinateur Anthony CHESNAUD,Chargé de recherche, Ecole Nationale Supérieure des Mines de Paris Examinateur Alain THOREL,Directeur de recherche, Ecole Nationale Supérieure des Mines de Paris Examinateur
MINES ParisTech
Centre des Materiaux P. M. Fourt
”Por pretextos talvez f´uteis, a alegria ´e o que nos torna os dias ´uteis”
While writing this thesis I realized how many different people put their talent, passion and knowledge in it. As I realize how much I’ve grown during these last four years, I think about all these people I met and are now part of my life. As I leave to another destination far from the coast, I think of those who are always with me. In the deepest of the storms or below the bluest sky and over the bluest sea, my family.
I’d like to thank Esteban Busso and Georges Cailletaud, Directors of the Centre des Mat´eriaux and the research unit UMR 7633, respectively, for giving me the opportunity of doing my PhD in the laboratory they supervise.
I want to thank Alain Thorel, my PhD advisor, first of all for giving me the chance to work on such a challenging project, in an international project and multidisciplinary environment. Thank you for trusting me and letting me doing the thesis I wanted to do. I learned a lot.
I would like to thank Mme Vannier and M. Mauvy for having accepted to be the reviewers of my thesis. Thank you for your comments and the fruitful discussions about this work. I want to thank M. Guizard for being president of the jury. I want to thank all the other members of the jury: M. Dezanneau for his always pertinent questions, M. Jeulin for his competence and brightness that I could witness during these years and Mme. Vladikova for her knowledge and for knowing how to share it with such grace and beauty.
I’d like to thank Anthony Chesnaud, scientific manager of the IDEAL-Cell project, who was in the office next door from the first to the last day.
As you’ll notice by reading this text, this thesis wouldn’t have been possible without the collaboration of many talented researchers: Zdravko Stoynov, Massimo Viviani, Antonio Barbucci, Asif Ansar, Zeynep Ilhan, Charles Peyrega, Mickael Palard, Alessio Bassano, Francesco Deloro, Denis Soysal, Gergana Raikova. I learned so much from you in so many different ways. Thank you for your brightness and your talent!
I want to thank R´emi Costa, former PhD student in our research group, for the good advices, for his scientific accuracy and for being my headlight showing me what was expecting me.
The daily trips to the canteen at noon wouldn’t have been such a joy without my friends from hall C: Mohamed, C´ecilie, Pierre, Morgane, Marie-H´el`ene, R´egis. Thank you for the good mood, the interesting, serious, scientific or just silly discussions. Life at the laboratory was made so much easier with the help and daily good mood of the Centre des Mat´eriaux administrative staff: Konaly Sar, Sarojinee Bonneville, Liliane Locicero and Catherine Rouil. Thank you!
I want to thank my football friends of every wednesdays, under the sun, rain or snow: one of the main reasons for my good integration and French speaking skills!
I would like to thank in particular my three musketeers: Nicolas Cordero, Ang´elique Consil and Bahram Sarbandi. Thank you for your friendship and the great parisian nights spent together. I hope we can keep in touch as time goes by. Nicolas Revuz, for the times you made me laugh, for your energy and creativity. Thank you for introducing me to the never ending process of learning how to play the guitar... without it I would probably have finished writing my thesis 3 months earlier!
A very special thank you to Thomas Vilaro, with who I shared the joy of the french ”co-location” and the thrill of searching for an apartment in Paris being just a PhD student with a short-term contract.
To the one who one day put me on a train to Toulon to see an Elton John concert! The one who took me to a Cat Stevens concert! The one who hanged on beside me when the waves got bigger an the wind blowed stronger. The one who keeps showing me a new world every day through her eyes, Perrine Fr´ehaut. Away we go!
To those who are ”the reason why I’m traveling on”, my family. My grandfather Joaquim, who left me too soon. My grandmother Lurdes who used to tell me the greatest stories to sleep at night. To my father Jo˜ao, the strongest of all. To my beautiful mother Teresa for her brightness and determination. To my little sister Filipa, the beauty of a woman’s strength. Thank you for understanding and supporting me in the choices I’ve made even if they kept us apart for a while.
To all of you who set sail and left the shoreline with me, the wind will keep taking us further. We’re still at Cape Bojador! Let’s go!
II Introduction 1
I.1 General context . . . 2
I.2 Fuel Cells . . . 5
I.2.1 General Overview . . . 5
I.2.2 Working principle of a fuel cell . . . 6
I.2.2.1 Theoretical Performance . . . 7
I.2.2.2 Actual Performance . . . 8
I.3 Solid Oxide Fuel Cell (SOFC) . . . 9
I.3.1 Advantages and Disadvantages . . . 10
I.4 Proton Ceramic Fuel Cell (PCFC) . . . 11
I.4.1 Advantages and Disadvantages . . . 12
I.5 IDEAL-Cell: a new concept of fuel cell . . . 13
I.5.1 Expected Advantages . . . 14
I.6 Outline . . . 15
IIII Proof of concept 17 II.1 Introduction . . . 18
II.2 Proof of concept (POC) prototypes . . . 18
II.3 Electrolyte materials . . . 19
II.3.1 Proton electrolyte materials . . . 21
II.3.1.1 Proton conduction mechanism . . . 21
II.3.1.2 Materials choice . . . 22
II.3.2 Oxygen ion electrolyte materials . . . 27
II.3.2.1 Oxygen ion conduction mechanism . . . 28
II.3.2.2 Material choice . . . 31
II.4 Shaping of proof of concept prototypes . . . 32
II.4.1 Shaping techniques . . . 35
II.4.1.1 Cold Pressing . . . 35
II.4.1.2 Tape Casting . . . 35
II.4.2 First approach: self-supported samples . . . 41
II.4.3 Second approach : proton electrolyte-supported samples . . . 45
II.5 Electrochemical testing . . . 48
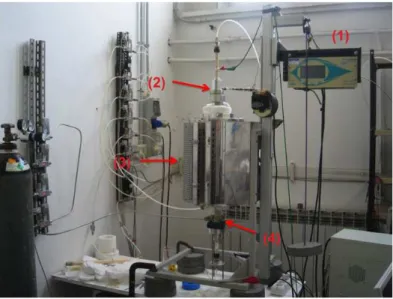
II.5.1 Experimental apparatus . . . 48
II.5.2 Experimental Procedure . . . 50
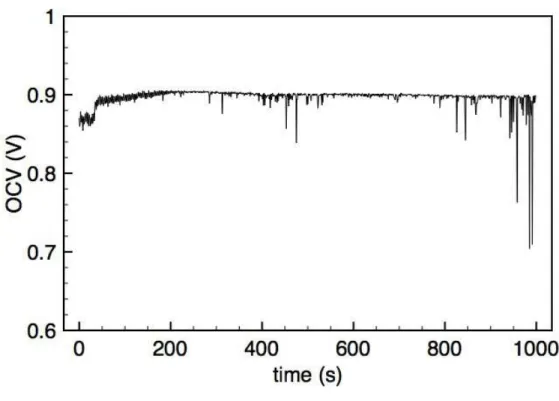
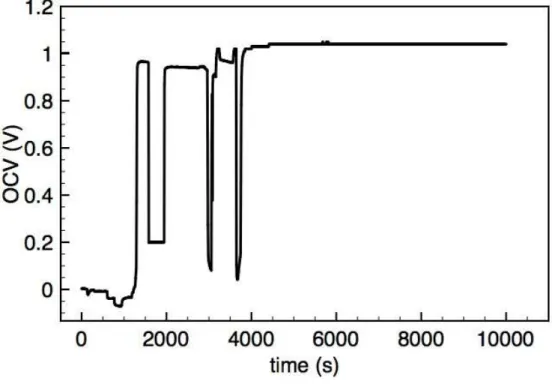
II.5.3 Results . . . 50
II.6 Discussion . . . 54
IIIIII The Electrodes: Anode and Cathode 61
III.1 Introduction . . . 62
III.2 Anode materials . . . 62
III.2.1 State-of-the-art . . . 62
III.2.2 Characterization of anode materials . . . 64
III.2.2.1 Samples description and fabrication . . . 65
III.2.2.2 S.E.M. characterization of samples . . . 69
III.2.2.3 Electrochemical testing . . . 69
III.2.3 Discussion . . . 71
III.2.4 Conclusions . . . 71
III.3 Cathode Materials . . . 72
III.3.1 State-of-the-art . . . 72
III.3.2 Characterization of cathode materials . . . 74
III.3.2.1 Samples description and fabrication . . . 77
III.3.2.2 S.E.M. characterization of samples . . . 79
III.3.2.3 Electrochemical testing . . . 80
III.3.3 Development of a composite cathode . . . 80
III.3.3.1 Experimental procedure . . . 80
III.3.3.2 Sample characterization . . . 81
III.3.3.3 Electrochemical testing . . . 81
III.3.4 Development of a new cathode material . . . 82
III.3.4.1 Experimental Procedure . . . 82
III.3.4.2 Electrochemical testing . . . 83
III.3.4.3 Discussion . . . 84
III.3.5 Conclusions . . . 86
III.4 Conclusions . . . 86
IVIV Complete cell fabrication 89 IV.1 Introduction . . . 90
IV.2 Sample description . . . 92
IV.3 Experimental procedure . . . 92
IV.4 Sample characterization . . . 96
IV.5 Discussion . . . 97
IV.6 Conclusion . . . 98
VV Central membrane characterization 101 V.1 Introduction . . . 102
V.2 X-ray microtomography . . . 106
V.3 Experimental Procedure . . . 109
V.4 X-ray microtomography results . . . 115
V.5 Image segmentation . . . 117
V.5.1 Porosity . . . 117
V.5.2 Ceramic Materials . . . 119
V.5.2.1 Halo . . . 122
V.5.3 Segmentation of the three phases . . . 127
V.6 Morphologic 3D Image Analysis . . . 127
V.6.1 Percolation . . . 129
V.6.2 Tortuosity . . . 130
V.6.3 Active triple phase boundaries . . . 131
V.8 Conclusions . . . 136
VIVI Study of water evacuation in the central membrane 139 VI.1 Introduction . . . 140
VI.2 Experimental Procedure . . . 140
VI.3 Description of the samples . . . 141
VI.4 Model . . . 143
VI.4.1 Momentum transfer . . . 143
VI.4.2 Mass Transfer . . . 146
VI.5 Evaluation of the water evacuation . . . 148
VI.5.1 Problem . . . 148
VI.5.2 Velocity Field . . . 150
VI.5.3 Water evacuation . . . 152
VI.5.4 Influence of the mesh density . . . 152
VI.5.5 Influence of the pores shape . . . 155
VI.5.6 Study of the samples anisotropy . . . 156
VI.6 Discussion . . . 160
VI.7 Conclusions . . . 161
Introduction
Contents
I.1 General context . . . 2
I.2 Fuel Cells . . . 5
I.2.1 General Overview . . . 5
I.2.2 Working principle of a fuel cell . . . 6
I.2.2.1 Theoretical Performance . . . 7
I.2.2.2 Actual Performance . . . 8
I.3 Solid Oxide Fuel Cell (SOFC) . . . 9
I.3.1 Advantages and Disadvantages . . . 10
I.4 Proton Ceramic Fuel Cell (PCFC) . . . 11
I.4.1 Advantages and Disadvantages . . . 12
I.5 IDEAL-Cell: a new concept of fuel cell . . . 13
I.5.1 Expected Advantages . . . 14
I.1
General context
The image you see below (figure I.1) is a composition of pictures taken in the year 2000 during night from one of the thousands of artificial satellites that wander around earth. Nowadays, this image, although beautiful, is not surprising. If it had been taken one hundred years ago, although it would be the result of a true technological miracle at that time, this picture would be much less impressive than it is today; we would see nothing but a black rectangle on a white page.
Figure I.1 : Planet Earth at night in the year 2000 [1].
The reason why we actually see something in the black rectangle is because in the last century men learned how to convert energy from different sources and use it to operate more and more different devices that allowed us to make tasks that were hardly feasible or completely impossible before. The benefits from the use of energy in our lives are so evident that distribution networks were created in order to spread its access to the largest number of people.
Since the beginning of this true revolution, energy consumption never stopped increasing. In 2009 total energy consumption in the world was 3 times higher than in 1965 having an increase from 3.8 to 11.2 million tons of oil equivalent (see figure I.2) [2].
The impact in our life quality is tremendous. We live better. In this same period, infant mortality decreased from 116 to 47 deaths per 1000 births while life expectancy raised from 52 to 67 years-old. As a result, world population more than doubled from 3.3 to 6.9 billion people [3].
Our lives became not only longer but also completely different than before. We travel much often and much faster; and information travels even faster than us. The world became smaller. The introduction of all kinds of mechanical devices and biochemicals in agriculture made alimentary products accessible to a larger number of people. Health care and sanitary conditions improved in our every day lives. Industries produce more products, in less time, with lower raw material and labor costs at lower prices. From 1960 to 2008 the world’s gross domestic product raised from 1.9 to 60.5 billion dollars [4].
For all these reasons, energy became a strategic sector of the uttermost importance. In its 2009 World Energy Outlook, the International Energy Agency (IEA) predicts that
Figure I.2 : Total energy consumption in the world from 1990 to 2008 in million tons of oil equivalent [2].
the primary energy demand will increase 40% until 2030; China and India represent over 50% of this increment. Fossil fuels will remain the dominant sources of energy worldwide and electricity consumption will increase 76%. China will overtake USA as the world biggest spender in oil and gas imports soon after 2025.
When in 2100 a new picture of the earth at night will be taken, things will have changed: Europe, North America, Japan and Oceania may be slightly brighter than today but the main increment will be seen in the regions of Asia and South America. However we’ll still hardly see Africa’s contours.
The IEA predicts that by 2030, 1.3 billion people worldwide will still lack access to electricity compared to 1.5 billion in 2007 [5].
An important effort has been done to spread the access to energy but we didn’t diversify enough the sources to obtain it and this has an impact in the planet’s sustainability. From 1990 to 2009 the emission of CO2 in the atmosphere increased at the same rate as the energy
consumption: 2.6 times higher from 12000 to 310000 tons per year [2]. One of the main consequences for the planet is the so called global warming. As we can see in figure I.3 most of the planet is in average 1◦
C or 2◦
C warmer and in some regions of the north, where ice surfaces are located, the differences reach 5◦
C. The continuation of current trends would have profound implications for environmental protection and air quality that would cause serious public health issues, particularly in developing countries [5].
This is the challenge we have to face: the need of producing more energy and at the same time of reducing the impact of our presence on the planet.
An effort has been done in the last decade to diversify the sources of energy and the impact of their exploitation in the planet by the use of renewable sources of energy; sources that can be replenished at least as fast as they are consumed. In 2007, renewable energies
Figure I.3 : Temperature difference between 1990 and 2010 during spring in the world [6]. represented 18% of the sources of total energy consumption in the world [2]. In figure I.4 we can see the impressive increase in solar, wind and thermal energy production in the world.
1975 1980 1985 1990 1995 2000 2005 2010 20000 40000 60000 80000 100000 120000
me
g
a
w
a
tt
s
Figure I.4 : Solar, wind and thermal energy production in the world from 1975 to 2010 [2]. The five renewable sources used most often in the world are: biomass, water (hydropower), geothermal, wind and solar.
environment through the use of fuel cells.
I.2
Fuel Cells
I.2.1 General Overview
Fuel cells are electrochemical devices that convert the chemical energy of the fuels and the combustive directly into electrical energy, producing water as byproduct. In a combustion engine, fuel undergoes a chemical reaction of combustion and electrical energy is produced through an intermediate mechanical step that takes advantage of the expansion of the gases produced to apply a force in a component of the engine making it move.
Instead, in a fuel cell, electrical energy is produced directly by electrochemical processes. Combustion of the fuel cannot occur because it’s separated from the oxidant by an electrolyte. The complete structure of a fuel cell - shown in figure I.5 - consists of the electrolyte and two electrodes on each side: the anode and the cathode. During operation, fuel is fed continuously to the anode where it’s oxidized while the oxidant is reduced in the cathode creating a flow of ions that goes through the electrolyte and a current of electrons that passes through an external circuit.
Figure I.5 : General scheme of a fuel cell [7].
Thus, a fuel cell works like a battery in sense that it also produces electrical energy through electrochemical processes. However, unlike a battery, a fuel cell cannot run out as long as fuel is continuously supplied. This is interesting for applications in which absolutely reliable energy supply is needed like military and health care. Fuel cells also allow the energy generation near the customers rather than central or remote locations which avoids losses over the long transmission and distribution lines [8]. Their ultimate advantage is the high efficiency compared to other energy generation systems but their cost keeps them from being more competitive as it is shown in table I.1.
There are different types of fuel cells in different stages of development. They are commonly classified by the nature of the electrolyte they use. Thus, we can distinguish [9]:
Polymer Electrolyte Fuel Cells (PEFC) in which the electrolyte is a polymeric proton exchange membrane where H+
Table I.1 : Comparison of different energy generation systems [8].
Diesel engine Photovoltaic Wind turbine Fuel cells
Capacity range 500 kW to 5 MW 1 kW to 1 MW 10 kW to 1 MW 200 kW to 2 MW
Efficiency 35% 6-19% 25% 40-60%
Capital cost ($/kW) 200-350 6600 1000 1500-3000
O&M cost 0.005-0.015 0.001-0.004 0.01 0.0019-0.0153
hard because water cannot be evacuated at a faster rate than it’s produced since the membrane must be hydrated to keep its conductive properties. For this reason P.E.F.C. run typically at a temperature range from 60◦
C to 80◦
C. These low operating temperatures allow the fast start-up of the system and an immediate response to changes in the demand for power. Its tolerance to shock and vibration due to plastic materials make it suitable for automotive and portable applications. Systems with a power range from 30 W to 250 kW have been tested.
Alkaline Fuel Cells (AFC) potassium hydroxide in a matrix plays the role of electrolyte conducting OH−
ions which are the charge carriers. These systems operate from 65◦
C to 220◦
C. Under development since the 1960’s, the high reactivity of the electrolyte with CO2 that may be present in the fuel is one of its main drawbacks. Power delivered
by such systems goes from 10 W to 10 kW.
Phosphoric Acid Fuel Cell (PAFC) a solution of phosphoric acid in a ceramic matrix conducts H+
ions. With an operating temperature between 150◦
C and 220◦
C, these systems are limited to stationary applications. A wide power range from 100 kW to 1.3 MW has been reached through these systems.
Molten Carbonate Fuel Cell (MCFC) uses an electrolyte composed of a mixture of lithium carbonate and potassium through which CO3
2− ions circulate. These systems
are also suitable for stationary applications since they operate from 600◦
C to 700◦
C. Units with delivering power from 10 kW to 2 MW have been tested.
Solid Oxide Fuel Cell (SOFC) has dense mixed oxide ceramics as electrolytes; typically a ceramic with a perovskite structure. These materials are good O2−
(or H+
) conductors for temperatures from 600◦
C to 1000◦
C and this fact determines the system operating temperature. Thus, these cells are also suitable for stationary applications. A power range from 1 kW to 1.7 MW was obtained using these systems.
I.2.2 Working principle of a fuel cell
A fuel cell can be seen as a charge pump. Just like a mechanical pump creates a pressure difference that makes a fluid to go from a point with higher pressure to a point with lower pressure, a fuel cell creates an electric field with a potential that moves charges from a higher to lower potential.
The potential difference ∆V, for an infinitesimal displacement dS , between two points A and B in an electric field E is defined as the change in potential energy, ∆U of the system divided by the test charge, q0:
∆V = ∆U
q0 = −
� B
A
E. ds (I.1)
The potential difference between points A and B equals the work per unit charge that must be done to move a test charge between the two points in an electric field, E. The potential
difference ∆V is therefore a measure of energy per unit charge with SI units of joules per coulomb, which is defined as volt (V) [10].
I.2.2.1 Theoretical Performance
The potential of an electric field describes the work done to displace a unit charge in this field. The potential is therefore the driving force for the charge displacement and is equivalent to the open circuit voltage - the voltage when the current is zero. The open circuit voltage of a fuel cell depends on the difference of potential of the electrochemical reactions that take place in the electrodes. The useful energy is extracted from the system directly via the electric circuit. The driving force for this process is the difference in chemical potential (or the activity) between fuel at the anode and of the combustive in the cathode.
Table I.2 : Electrochemical reactions in the electrodes of the different types of fuel cell [9]
Fuel cell Anode reaction Cathode reaction
Polymer electrolyte H2 →2H + + 2e− 1/2 O 2 + 2H + + 2e−→H 2O
and Phosphoric acid
Alkaline H2 + 2OH−→2H2O + 2e− 1/2O2 + H2O + 2e−→2OH−
Molten carbonate H2+ CO2−3 →H2O + CO2 + 2e− 1/2O2 + CO2 + 2e−→CO2−3
CO + CO2− 3 →2CO2 + 2e− H2 + O2−→H2O + 2e− Solid oxide CO + O2− →CO 2 + 2e− 1/2O2 + 2e−→O2− CH4 + 4O2−→2H2O + CO2 + 8e− Proton ceramic H2 →2H+ + 2e− 1/2 O2 + 2H+ + 2e−→H2O
The maximum electrical work Welthat can be obtained in a fuel cell operating at constant
temperature and pressure is given by the change in Gibbs free energy ∆G◦
in standard conditions of the global electrochemical reaction:
Wel= ∆G◦= −nF E◦ (I.2)
where n is the number of electrons participating in the reaction, F is the Faraday’s constant (96485 C/mol), and E◦
is the reversible potential of the cell, considering the reactants and products being in the standard state (25◦
C, 1 atm). For the general cell reaction,
αA + βB → c C + δD (I.3)
the Gibbs free energy ∆G of a reaction can be obtained from its value at standard conditions through the equation:
∆G = ∆G◦
− R T ln [C]
c[D]δ
[A]α[B]β (I.4)
When equation I.2 is replaced in I.4, we obtain: E = E◦
− R TnF ln [C]
c[D]δ
[A]α[B]β (I.5)
Therefore the concentration of the reactants and the products of the reaction can influence the potential produced by the fuel cell.
The chemical activity is linked to concentration, which in turn is linked to partial pressures P in gaseous systems. For the simple case of a hydrogen-oxygen fuel cell, where 2e−
exchanged between both the electrodes compartments, the following relation can thus be derived: E = E◦ +R T 2 F ln PH2P 1/2 O2 PH2O (I.6)
I.2.2.2 Actual Performance
Compared to an internal combustion engine, fuel cells are not submitted to the limitations of the Carnot cycle thus their theoretical efficiency is higher. The latter is given by the ratio of the Gibbs free energy of water formation ∆G◦
to the thermal energy ∆H◦
delivered by the chemical reaction. The efficiency is 83% when liquid water is formed and 95% for gaseous water at 25◦
C. At higher temperatures (> 900◦
C), this efficiency reaches 74% without taking into account the lowering of the potential delivered by the cell in closed circuit. When the circuit is closed, the electrical charges cross the cell, they go through its internal resistance and the potential decreases due to the so called losses or polarizations. These losses are due to three phenomena:
Activation polarization, ηact is dominant for low current densities when the
electrochemi-cal reactions at the electrodes are limited by the charge transfer kinetics. It’s a measure of the electrochemical performance of the electrode materials and the ability of the microstructures morphology to facilitate the electrochemical reactions. Electrochemical and chemical reactions are similar in the fact that, in both, the reactants must overcome an activation energy to start the reaction. In the case of an electrochemical reaction for which ηact ≥ 50 − 100mV , ηact is given by the general equation
ηact= R T α n F ln i i0 (I.7) in which, α is the charge transfer coefficient, i is the current density and i0 is the
exchange current density.
Ohmic polarization, ηohm is due to the resistance to the flow of ions in the electrolyte
and the flow of electrons in the electrodes. It can be reduced by enhancing the electrolyte conductivity wether through the use of better conducting materials, reducing the electrolyte thickness or increasing the cell’s operating temperature. Since most of the electrolyte materials are ohmic, the ratio of the potential loss ηohm to the current,
I, is the resistance, Re of the conductor.
ηohm= ReI (I.8)
Concentration polarization, ηconc occurs for higher values of current density, when the
mass transport of the chemical species in the electrodes control the electrochemical reactions. As the reactants are consumed in the surface of the electrochemical sites, the inability to maintain the bulk concentration creates a concentration gradient. It may be caused by slow diffusion of the gases through the porosity of the electrodes to the electrochemical reaction sites, dissolution of the reactants or products within the electrolyte or diffusion of reactants and products between the reaction sites and the electrolyte. It may be reduced by the optimization of the electrodes morphology. At high current densities, the slow transport of products to the reaction sites is the major contribution to the concentration polarization. These losses can be expressed by:
ηconc= R T n F ln � 1 −ii L � (I.9) where iL is the limit current.
The actual potential of a fuel cell Vcell is, thus, given by the maximum work determined
by equation I.2 less the losses described above:
Vcell = E◦− ηact− ηohm− ηconc (I.10)
The cell potential is function of the current density and it can be represented by a typical I-V curve, displayed in figure I.6. The operating point of a fuel cell will depend on operating variables that will optimize the performance to a specific system requirements, keeping the operating costs as low as possible. For example, operating at higher pressure will increase the cell performance, however more powerful compressors will be needed to compress the reactants and the pipes to feed the fuel and exhaust the gases will have to be adequate, which represents an additional cost.
Figure I.6 : Characteristic current-voltage curve of a fuel cell [9].
The research activities reported here are devoted to a new concept of fuel cell that, due to its characteristics, can be included in the Solid Oxide Fuel Cell family. The following parts I.3 and I.4 state the progress in the field of high temperature fuel cells, SOFC and PCFC, illustrating their advantages and drawbacks.
I.3
Solid Oxide Fuel Cell (SOFC)
Solid oxide fuel cells (figure I.7) use a solid oxide electrolyte to transfer O2− ions, the charge
carriers, from the cathode to the anode. The fuel (reducing agent) is generally hydrogen and the combustive (oxidant) is oxygen in the air. In the cathode, oxygen is reduced by a current of electrons coming from an external circuit, creating a flow of oxygen ions through the electrolyte (see equation I.11). In the anode, these ions oxidize the fuel forming water
and a current of electrons that passes through the external circuit towards the cathode (see equation I.12). The global reaction is thus given by equation I.13. At standard pressure and temperature ( T = 25◦
C, P = 1 atm) water formed in this reaction is liquid and therefore ∆G◦
= −237.3 kJ/mol. The open-circuit voltage of such system, given by equation I.2, is ∆E◦
= 1.23 V. At these same pressure and temperature conditions, if we consider that water is formed as water vapor, ∆G◦
= −228.6 kJ/mol and the open-circuit voltage will be ∆E◦
= 1.19 V [9].
Solid oxide fuel cells operate at temperatures between 600◦
C and 1000◦
C where the ionic conductivities of the electrolyte materials is high enough to assure efficiently the transport of O2− . Cathode Reaction: 1/2 O2(g) + 2e − → O2− (I.11) Anode Reaction: H2(g) + O 2− → H2O(g) + 2e − (I.12) Overall Reaction: H2(g) + 1/2 O2(g) → H2O(g) (I.13)
a
n
o
d
e
ca
th
o
d
e
electrolyte
O
2-2e
-H
2H
2O
O
2Figure I.7 : Solid oxide fuel cell scheme.
I.3.1 Advantages and Disadvantages
High temperatures allow the integration of an internal reformer to transform, in situ, methane into hydrogen. This can avoid the development of a hydrogen supply network or storage. At high temperatures the reactions at the electrodes become easier to catalyze and therefore the catalysts used can be cheaper metals than the ones used in low temperature fuel cells. Solid oxide fuel cells produce water as vapor that has a very important energetic value. Thus, this vapor can be used in the heating systems or cogeneration plants. This can increase the efficiency of this type of systems from 40% to 80%. Another advantage is related to the nature and/or composition of the anode gas: carbon monoxide is not a poison anymore for
the catalysts and the tolerance to sulfur is one or two times higher than the ones of phosphoric acid or molten carbonate cells.
Solid Oxide fuel cells present although some disadvantages that keep them from reaching a higher stage of development. Reducing (on the anode side) and oxidant (on the cathode side) atmospheres at such high temperatures create very demanding conditions to the materials used in the cells but also in the interconnects of the stacks. These materials must not be sensitive either to oxidation and reduction at high temperature. This has great impact in the systems performance stability. Other disadvantages are related to the concept itself. The hydrogen oxidation in the anode produces water that has to be evacuated at the same rate that is created while at the same time, in the opposite direction, hydrogen must flow through the microstructure to reach the electrochemical reaction sites. Hydrogen oxidation is the anode’s main function, however, water partial pressure must be kept as low as possible to avoid decreasing the cell’s potential, as one can see in equation I.6. The function of the anode is dual and somehow incompatible since two gases must flow in opposite directions. Therefore the optimization of the microstructures morphology for this dual function is particularly delicate. The presence of water in the anode dilutes the fuel, decreasing the cell potential and deactivates the electrochemical sites. In these conditions, an increase of hydrogen partial pressure, leads to the formation of more water and therefore a lower potential and a weaker electrochemical reaction rate. W.G. Coors reported that SOFCs with 45-55% efficiency are hampered by poor intrinsic fuel utilization because water vapor is produced at the anode where it dilutes the fuel [11].
The decrease of the SOFC’s working temperature is a core objective for its development and it has been attempted through two approaches: the use of thinner electrolytes in electrode supported cells and the development of new materials with higher conductivities.
In this quest, new ionic conduction mechanisms were considered, as it happens in Proton Ceramic Fuel Cells (PCFC).
I.4
Proton Ceramic Fuel Cell (PCFC)
Proton conduction in solids at temperatures below 100◦
C had been studied for a long time before the beginning of the years 1980’s when H. Iwahara demonstrated that SrCO3 based
sintered oxides had interesting proton conductivities when exposed at hydrogen atmospheres at temperatures between 600◦
C and 1000◦
C [12]. These materials can be used as electrolyte of a fuel cell having the characteristics of polymer electrolyte fuel cells but keeping the kinetic and thermal advantages of the solid oxide fuel cells.
In this concept of fuel cell, H+ charge carriers are implied instead of O2− ions like in the
SOFC concept. The relatively lower weight of H+
ion would imply a lower activation energy associated with ionic transport, and then a better conduction would be expected at lower temperatures (< 800◦
C).
Thus, in this concept, hydrogen is reduced in the anode yielding a current of protons that is conducted through the electrolyte and a current of electrons that passes by an external circuit towards the cathode (see equation I.14). In the latter, oxygen acts as oxidant and reacts with the protons and the electrons to form water vapor (see equation I.15).
Anode Reaction:
H2(g) → 2H++ 2e −
(I.14) Cathode Reaction:
1/2 O2(g) + 2H + + 2e− → H2O(g) (I.15) Overall Reaction: H2(g) + 1/2 O2(g) → H2O(g) (I.16)
a
n
o
d
e
ca
th
o
d
e
electrolyte
H+
2e
-H
2H
2O
O
2Figure I.8 : Proton ceramic fuel cell scheme
The overall reaction is the same given in I.13 and therefore, through equation I.2, the open-circuit voltage of a proton ceramic fuel cell has the same value of a SOFC, ∆E◦
= 1.19 V, considering water formed as vapor in standard conditions.
I.4.1 Advantages and Disadvantages
PCFCs have the advantages of the high temperature fuel cells. They allow higher fuel flexibility because reduction reactions of fossil fuels can be catalyzed at such temperatures. The conditions for the reactions catalysis are so favorable that cheaper metals can be used, instead of platinum or gold used in PEFCs. As in SOFCs, water vapor produced allows the integration of the cells stack in cogeneration plants and increases the global efficiency up to 80%. The advantage of the PCFCs comparing to the SOFCs is the possibility of reducing the operating temperature. Proton conductors have the advantage that the ion migration kinetics are rather faster, and so the cell can run at lower temperatures, which is very important for the materials durability and long-time performance. Another advantage is that water is no longer formed in the anode and therefore fuel is not diluted and then the electrochemical reaction rate is not decreased.
However, this is where the disadvantages of this concept begin. Although fuel dilution is avoided, the problem of water evacuation is exactly the same in the cathode of a PCFC. Oxygen must diffuse to reach the electrochemical sites and at the same time water must be evacuated in the opposite direction. The microstructure of the cathode has to be optimized for this dual and opposing function. The evacuation of water is important because its presence in the oxidizing atmosphere of the cathode at such a high temperature is highly demanding for the cathode and interconnect materials. Chemical stability of the materials is affected and therefore performance of the fuel cell is decreased.
In this context the development of fuel cells can follow two paths: the improvement of the concepts described above through the development of better performing materials and the optimization of the microstructures using different shaping techniques or the development of breakthrough concepts that will allow to overcome the difficulties the research community has been confronted with for many decades.
The second choice was made in the beginning of the years 2000s when a new concept of intermediate temperature fuel cell was conceived. This concept has so far been called Innovative Dual MEmbrAne FueL - Cell: IDEAL-Cell.
I.5
IDEAL-Cell: a new concept of fuel cell
If we keep the classification of fuel cells according to the electrolyte’s nature, IDEAL-Cell is in fact a solid oxide fuel cell, which operating temperature is intermediate between those of PCFCs and SOFCs.
In the previous sections, the major obstacles to the development of high temperature fuel cells were presented. In a SOFC the anode is an obstacle to the cell development because the fuel is diluted which decreases the voltage and the electrochemical activity. Moreover, counter-flow of fuel and water makes the microstructure optimization difficult. Although PCFC present some advantages that allow us to overcome the limitations of the SOFCs systems, the presence of water in the cathode creates an extremely severe atmosphere for the materials durability and the counter-flow of oxygen and water is a problem similar to the one found in SOFC anodes.
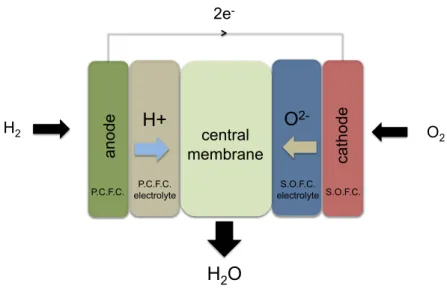
The idea behind the IDEAL Cell concept is to keep from both concepts the most performing components and to connect them through a new membrane. This innovative system that combines the advantages of state-of-the-art fuel cells (SOFC and PCFC) while avoiding their drawbacks, consists in the anode and proton conducting electrolyte of a PCFC connected to the cathode and oxygen ion conducting electrolyte of a SOFC through a porous ceramic central membrane, as one can see in figure I.9. In this cell, hydrogen is oxidized in the anode through reaction I.17 creating a current of electrons that pass through an external circuit and a flow of protons that are conducted through the electrolyte. On the other electrode, oxygen is reduced by the electrons coming from the external system creating a flow of oxygen ions that go through the electrolyte. The central membrane must allow the recombination of the two types of ions in order to react and form water (see reaction I.18) that must be evacuated through this porous central structure.
Anode reaction:
H2(g) → 2H++ 2e −
(I.17) Central membrane reaction:
2H+ + O2−→ H2O(g) (I.18) Cathode Reaction: 1/2 O2(g) + 2e − → O2− (I.19) Overall Reaction: H2(g) + 1/2 O2(g) → H2O(g) (I.20)
ca th o d e S.O.F.C. electrolyte
O
2- 2e-H
2O
O2 a n o d e P.C.F.C. electrolyteH+
H2 central membrane P.C.F.C. S.O.F.C.Figure I.9 : Innovative dual membrane fuel cell - a new concept of fuel cell
I.5.1 Expected Advantages
Proposing a new concept of fuel cell to the scientific community wouldn’t make sense if it couldn’t bring advantages with respect to the already existing concepts. What was written in the two previous sections allows us to conclude the advantages expected from IDEAL-Cell. The innovation of this concept lies on the central membrane, which is the core of the device [13]. The idea of a mixed dedicated proton and oxygen ion conducting membrane that can allow water formation and evacuation simplifies the role the electrodes have to play. Compared to the already existing systems, the constraints in terms of microstructures are decreased. Thus, materials and microstructures of the anode and the cathode can now be optimized to their main purpose: fuel and combustive diffusion and their electrochemical reactions. It is no longer necessary to take into account the gas counter-flow to evacuate water out of the electrodes microstructures. Since water is not present in the electrodes, the electrochemical sites activity is no longer decreased. In fact, oxygen and hydrogen chambers are almost closed (single gas flow, no exhaust pipe); the stack architecture design is therefore made simpler than that of SOFC and PCFC, and offers the possibility of applying a pressure independently at both anode and cathode sides. This will allow the optimization of operating conditions and will drastically limit the polarization losses. In the anode, fuel is not diluted and the cell’s potential is not decreased. In the cathode, a dry oxidizing atmosphere is less demanding both for the cathode and the interconnects materials. Since some oxygen ion electrolyte materials have been reported to have good performances at 600◦
C, this new concept would operate at a temperature close to the one of a PCFC, which has the advantages described in I.4.1. Within the central membrane, the reaction of H+
and O2−
ions recombination is an exothermal reaction, giving rise to local increases of temperature that will improve ion diffusion. In addition to this role, the central membrane must have the optimal architecture to easily evacuate water. Therefore, it will be open to the exterior via an exhaust pipe; these thermodynamic conditions will force water to condense in cooler parts of the system generating a pressure drop and thus the enhancement of the water formation reaction in the central membrane according to the Le Chatelier principle. Due to the pressure drop in the central membrane, the equilibrium of the reaction will shift to counteract the imposed change and a new equilibrium is established towards an increase of water formation. Water produced in the central membrane can be used in an internal system with an electrolyzer to
produce hydrogen or in a vapor-reforming stage. This water also has an important energetic value that can be very efficiently recovered through a heat exchanger. Recovering this steam is made easier than in SOFC or PCFC systems since it is no longer diluted with anode or cathode gases.
I.6
Outline
This concept is protected by a French [?] patent since 2005 and in the rest of Europe, USA and Japan since 2007. In order to develop this idea, the European commission agreed to sponsor a research program under the seventh framework program. This project called IDEAL Cell: Innovative Dual mEmbrAne fueL Cell began in January 2007 gathering ten partners from five different european countries. The results presented here were obtained in the last three years in the scope of this project at the Centre des Mat´eriaux from Mines ParisTech, the project coordinator.
Thus, in the following chapters are reported the results on the fabrication and testing of the first IDEAL-Cell prototypes that lead to the proof of concept, which was the first objective of the project. After this phase, efforts were focused on the development of the electrodes and the shaping of a complete cell that could have better performances that the prototypes. The optimization of the cell also took us to study how to improve the shaping procedure of the central membrane in order to increase its ability to produce and evacuate water.
En 2009, la consommation mondiale d’´energie ´etait trois fois plus ´elev´ee qu’elle ne le fut en 1965. Parall`element, la qualit´e de vie s’est fortement am´elior´ee : la mortalit´e infantile est pass´ee de 116 `a 47 par mille et l’esp´erance de vie a connu une hausse de 29% en 44 ans en passant de 52 `a 67 ans. N´eanmoins, l’am´elioration de notre qualit´e de vie, li´ee aux activit´es anthropiques, est la cause directe du bouleversement climatique qui ne cesse de s’aggraver. Selon l’agence internationale de l’´energie (AIE), l’augmentation de la consommation d’´energie dans le monde aura un impact certain sur la sant´e publique. En raison de son caract`ere ´ecologique, la pile `a combustible est une solution d’avenir pour produire de l’´energie ´electrique ”propre” directement par conversion de l’´energie chimique d’un combustible et d’un comburant, l’eau et la chaleur ´etant les seuls produits de combustion. Parmi les piles `a combustible fonctionnant haute temp´erature, deux sont en voie d’industrialisation : les piles `
a combustible `a oxydes solides (SOFC) et `a conduction protonique (PCFC). Cependant, ces deux dispositifs ´electrochimiques pr´esentes des inconvi´enents majeurs, directement li´es `
a la pr´esence d’eau aux ´electrodes, qui freinent leur d´eveloppement. Pour obvier `a ces limitations, un nouveau concept de pile `a combustible a ´et´e invent´e Centre des Mat´eriaux et brevet´e par ARMINES. Il consiste en l’assemblage des compartiments anodique et cathodique respectivement d’une PCFC et d’une SOFC par l’interm´ediaire d’une membrane centrale poreuse et conductrice anionique et protonique qui permet la formation et l’´evacuation de l’eau. La pr´esente th`ese contribue au d´eveloppement de cette cellule innovante de pile `a combustible dans le cadre d’un projet Europ´een.
Proof of concept
Contents
II.1 Introduction . . . 18 II.2 Proof of concept (POC) prototypes . . . 18 II.3 Electrolyte materials . . . 19 II.3.1 Proton electrolyte materials . . . 21 II.3.1.1 Proton conduction mechanism . . . 21 II.3.1.2 Materials choice . . . 22 II.3.2 Oxygen ion electrolyte materials . . . 27 II.3.2.1 Oxygen ion conduction mechanism . . . 28 II.3.2.2 Material choice . . . 31 II.4 Shaping of proof of concept prototypes . . . 32 II.4.1 Shaping techniques . . . 35 II.4.1.1 Cold Pressing . . . 35 II.4.1.2 Tape Casting . . . 35 II.4.2 First approach: self-supported samples . . . 41 II.4.3 Second approach : proton electrolyte-supported samples . . . 45 II.5 Electrochemical testing . . . 48 II.5.1 Experimental apparatus . . . 48 II.5.2 Experimental Procedure . . . 50 II.5.3 Results . . . 50 II.6 Discussion . . . 54 II.7 Conclusions . . . 58
II.1
Introduction
The IDEAL-Cell concept is, first of all, an effort to overcome the difficulties which the scientific community has been confronted with in order to enhance fuel cells performances. Two typical approaches have been followed so far: (1) synthesizing new materials with higher conductivities and better catalytic properties, or (2) optimizing the microstructures through new or better-tuned techniques. In both cases the objective is to converge the actual performance of the systems to their theoretical values, keeping the operating temperatures as low as possible. The introduction of a new concept of fuel cell represents a third path to reach the same objectives. Due to its original configuration the IDEAL-Cell concept (see chapter I) can be an answer to some of the relevant drawbacks of the SOFC and PCFC systems. However, this third strategy is worthy to be carried out only if it represents a simplification and not a source of new and more complex scientific and technical questions that will not add anything to the state-of-art fuel cell systems. In this perspective, our first goal was to demonstrate that IDEAL-Cell is not only a promising possibility but that it actually behaves as a fuel cell, when a difference of potential is created between its electrodes. In this chapter, the activities developed in what was called the proof of concept (POC) phase are described. These activities go from the materials choice and characterization to the fabrication and testing of the first prototypes. As every new concept, its first units are prototypes designed to demonstrate that the idea is valid, feasible and has reproducible performances. Therefore, factors such as the cost of production and the possibility of industrial scale-up of the shaping processes were not taken into account in the decisions on the first cell prototypes. The most important criterion was performance but in a qualitative and not in a quantitative point of view; for example it was more important to detect the electrical current produced than to reach a high current density. Thus, it made sense that the materials chosen to fabricate the first samples were well known for their performances and reliability in the field of fuel cells. The shaping techniques used were chosen for being used routinely in the last years in our laboratory and therefore for producing reproducible results. At last, the samples were tested in typical fuel cell operating conditions in a dedicated electrochemical tester.
The results that allowed us to demonstrate this new concept are presented and discussed here.
II.2
Proof of concept (POC) prototypes
The first step in demonstrating the IDEAL-Cell concept was to decide the configuration of the POC prototypes in terms of microstructures, materials used in each functional layer and shaping techniques. These decisions were taken keeping in mind the mechanical reliability of the samples during testing, the reproducibility of the microstructures and, consequently, of the performances as well. As it was shown in figure I.9, a complete IDEAL-Cell is an electrochemical device with five different layers, each of them with different compositions, functions and microstructures. Each compartment of the cell was described in I.5. The anode and the cathode are mixed conductors with porous structures that must allow electrochemical reactions to take place and the transport of fuel and combustive, respectively. The electrolytes must be dense layers of purely ionic conductor materials. The central membrane, the innovative part of this concept, must be a porous structure that permits the conduction and the reaction of H+ and O2− ions and the transport of water to sweep it out of the
the materials properties and to the microstructures optimization. The electrodes must be chemically compatible with the electrolytes at high temperature, in order to ensure that secondary phases are not created at the respective interfaces, which would decrease the performance of the cell. In the case of composite electrodes (as it is the case of the anode), in which the interface between an electronic conductor and an ion conductor creates the active electrochemical reaction sites, the reactivity between the two materials is a key issue. The concentration of these interfaces, called the triple-phase boundaries (TPB), can be optimized through the shaping procedure by changing the proportion and grain size of the two materials and the volume and shape of the porosity.
electrolyte
O
2-
electrolyteH+
central
membrane
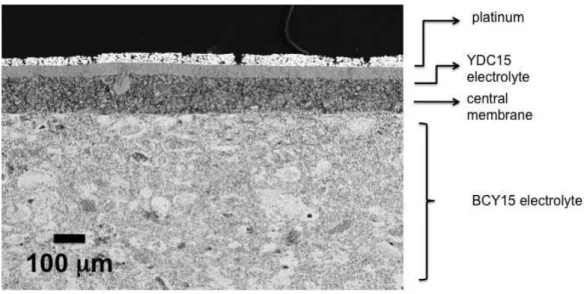
p la ti n u m p la ti n u mFigure II.1 : Proof of concept prototypes scheme.
For these reasons, it was decided that, in a first phase, the POC prototypes would not include typical electrodes because the variability of the microstructures and the compatibility of the materials would have an important impact in the system’s performance that should be studied later. Thus, the first prototypes have a three layer structure constituted by the two dense electrolytes and the porous central membrane, as it is shown in figure II.1. The electrodes are constituted by a platinum coating. Obviously, the electrolytes are constituted by a proton conductor and an oxygen-ion conductor. The central membrane must conduct both ions and therefore will be a composite of both electrolyte materials. Such a layered structure is new in field of fuel cells and therefore, at this point, many questions don’t have an answer. It is not known if the ion recombination will occur or if it needs the use of a catalyst neither what is the better percentage of each of the materials and what is the best porosity volume that allows the reaction to occur.
Once the design of the prototypes was chosen, a decision about the materials used to shape them was made.
II.3
Electrolyte materials
An electrical charge can be conducted by a material in the form of an ion or an electron. The electrical conductivity (σ) of a material is, thus, the sum of electronic parts (σe,σh) and an
ionic contribution (σion):
where n, p, and Nion are the concentrations of electrons e, holes h, and ions, respectively,
and µn, µp, and µion their mobilities (e0 is the elementary charge and z is the valence of the
ion).
Materials can be classified by their prevailing type of conductivity: in the electronic conductors the electrical charge is conducted in the form of electrons; in the mixed ionic-electronic materials, both ions and electrons are responsible for the charge conduction; and in the ionic conductors, such as several metal oxides, a specific ion generally acts as the charge carrier.
In an electrochemical device, the function of an electrolyte is to separate its electrodes, blocking electronic conduction but allowing charge to pass in the form of selected ions because any electronic conduction would short-circuit the system. An electrolyte must also be gastight in order to avoid the direct reaction of combustion between the fuel in the anode and the oxygen in the cathode. Thus, each electrolyte is in contact with one of the electrodes and, in an IDEAL-Cell, with the central membrane. Therefore they must be stable under oxidizing and reducing conditions and must not react with the electrodes and central membrane materials to avoid the formation of secondary phases that would decrease the performance of the cell. The materials must also be mechanically adjusted because during production and operation, they undergo temperature cycles that cause their expansion and contraction. If the materials have a similar behavior at high temperature, cracking and delamination of the electrode/electrolyte and central membrane/electrolyte interfaces are prevented during thermal cycling.
An electrolyte is defined by its ability to conduct electrical charge in the form of ions and not in the form of electrons and therefore the materials used as electrolytes are ionic conductors with negligible electronic conduction. A solid material with ionic conductivity must contain in its crystal structure a high concentration of mobile ions that can move relatively easily from the equilibrium position in a long-range path through which they can migrate. In order to understand the choice of an electrolyte material, it is important to understand how the ionic conduction occurs.
In an oxide, when an ion moves in a lattice, it has to occupy a new position in the crystal structure - a vacant or interstitial position - and in the act of migrating it generates a vacant site. Both vacant and interstitial oxygen ions are considered as point defects with regard to the ideal crystal structure of a material. Thus the mobility and concentration of defects in a material are linked to its conduction properties. The specific conductivity, σ is a thermally activated process given by equation II.2.
σ = σ0 T exp � −Ea k T � (II.2) where σ0 is called the prefactor, Eais the activation energy for the diffusion process and k is
the Boltzmann constant.
However, for a material to be an ionic conductor, the presence of a high concentration of mobile ions may not be enough. It must have a structure that is favorable to ions mobility, there must be an interconnected equivalent sites for the mobile ion, which are only partially occupied. At low temperatures, the normal sites are fully occupied and the interstitial sites are empty. But as the temperature increases, intrinsic thermal disorder generates large numbers of self interstitial-vacancy pairs and results in partial occupancy of the combined sub-lattices. The defects created like this are called intrinsic defects.
Partial occupation of equivalent sites can also be obtained by non-stoichiometry by doping the material with aliovalent cations to produce extrinsic defects [14].
In general, a material has a high specificity in the type of ions that are transported in its crystal structure. In the case of an electrochemical device like an IDEAL-Cell, two electrolytes
conduct two different ions: protons in the anode compartment and oxygen ions in the cathode compartment.
II.3.1 Proton electrolyte materials
Proton-conducting materials can be classified in two categories: those that contain protons in their stoichiometry and those in which protons are introduced from an external source during their synthesis or exist in equilibrium with hydrogen or water in the surrounding atmosphere. Whatever the nature of the material is, because of their charge and size, protons do not exist as free ions but always in interaction with other ions of its structure. In a solid oxide, a proton can interact with a lattice oxygen but commonly they are part of a larger molecule such as OH−
, H3O+ or NH+4. Some of the better studied proton conductors require a high
degree of hydration to be performing. A good review about the conduction mechanism in these materials can be found in [15]. However, these materials are not stable at temperatures higher than 300◦
C since they dehydrate which causes a loss in their performances [16]. At higher temperatures, in the 600-800◦
C range, the highest mobilities of proton defects have been reported for perovskite-type oxides [15].
Recently, fast proton conduction has been reported in non-perovskite structured materials. These materials have conductivities about ten times lower than the state-of-the-art perovskite proton conductors but they show improved stability in CO2- and water-containing
atmospheres [14].
II.3.1.1 Proton conduction mechanism
The perovskite structured materials draw considerable interests since they are the better known and better performing high temperature proton conductors. These ceramic oxide materials have been found to have protonic conductivity by H. Iwahara et al. in SrCO3
-based solutions under hydrogen-containing atmosphere [12]. These materials are extrinsic systems since the proton defects, which are the charge carriers, are introduced in the crystal structure by dissolution of water vapor. The reaction can be written, in Kr¨oger-Vink notation, as: H2O + Oxo + V •• o −→ 2(OH • o) (II.3)
where Oxo is a lattice oxygen and V••
o is an oxygen vacancy and OH •
o is a proton defect.
When the proton defects OH•
o have replaced oxygen vacancies, the electrolyte can diffuse
the protons coming from the anode:
Hads+ Oxo −→ OH • o + e
�
(II.4) and are then removed at the central membrane, in the case of an IDEAL-Cell.
Thus, one single oxygen vacancy generates two proton defects that are free to move acting as charge carriers. The concentration of oxygen vacancies in the perovskite crystal structure is, therefore, the driving force for the formation of proton defects. These vacancies are created intrinsically through the Frenkel and Schottky mechanisms but in too low concentrations to generate fast ionic conductivity. Therefore, these structures have to be substituted by lower valence ions. In order to compensate the missing charge, oxygen vacancies are created in the crystal structure. This is, for example, the case of doping Yb3+ for Zr4+ according to the
2ZrxZr+ Oxo + Y b2O3−→ 2Y b � Zr + V
••
o + 2ZrO2 (II.5)
The highest proton defect mobilities have been found in cubic perovskite oxides (ABO3).
These perovskites structure are called cubic because, in its ideal configuration, B ions form a cube with the A cation in its center and one oxygen in each of its corners, as shown in figure II.2(a) and (b).
(a) (b)
Figure II.2 : The aristotype structure of an ABO3 perovskite with the A-cation surrounded
by four BO6 octahedra (a). Oxygen ions are in the corners of the octahedra and the B-cation
is in its center. The crystal structure of BaCeO3 at room temperature (b) [17].
In such a structure, the mechanism of conduction happens in two steps: the rotation of the proton defect and the transfer of the proton to the neighboring oxide ion. The latter step seems to be the rate-limiting one since the rotation of the defect has low activation barriers. According to this mechanism, the proton would be the only mobile species, while oxygen has a fixed position in the materials crystal structure. However, in most perovskite-type oxides, oxygens are separated by a distance greater than 290 pm which is too high for the formation of a strong hydrogen bonds [15]. Thus, the proton can only be transferred if the lattice undergoes a distortion in order to reduce the distance between the oxygen atoms. The energy that the lattice needs to deform is equivalent to the energy it gains with hydrogen bond, therefore, short oxygen and large oxygen separations have the same probability of occurring. The first are advantageous for defect reorientation while the latter favor the proton transfer. However high activation energies of the protonic defects mobility in these structures show that the path through which protons are conducted is not linear. Proton actually is transferred outside the BO6 octahedron, creating a highly deformed hydrogen bond as one can see in figure II.3 (a)
and (b).
This path allows the transfer of the proton minimizing the interactions with the B cation charge. The influence of these interactions is shown by the difference between proton mobilities in cubic perovskites with pentavalent B-site (I-V perovskites) and tetravalent B-site (II-IV perovskites) perovskites, as shown in II.4 [15].
II.3.1.2 Materials choice
Amongst the perovskite structured oxides that have been reported to be suitable for proton electrolyte applications, Y:BaCeO3 solutions seem to be those that present higher
(a) (b)
Figure II.3 : Deformation of the perovskite structure in (a) [18] to allow the transfer of the proton, in black, to the neighboring oxygen ion (b) [15].
conductivities, as it can be seen in figure II.5. However, these materials have a low chemical stability under CO2-containing atmosphere.
(a) (b)
Figure II.5 : Proton conductivities for several perovskite-structured proton conductors [17] [16].
Ma et al. [19] studied these materials and found that BaCe0.9Y0.1O3−δ (BCY10) has one
of the highest proton conductivities at 700◦
C with σ = 20 mS cm−1
in wet hydrogen. From the experiments carried out in our laboratory by J. Hafsaoui [20], the barium cerate-based solution with higher conductivity is BaCe0.85Y0.15O3−δ. Therefore this was the material
chosen as proton conductor.
Yttrium doped barium cerate, BaCe0.85Y0.15O3−δ, was supplied by Marion Technologies,
a company specialized in ceramic materials production.
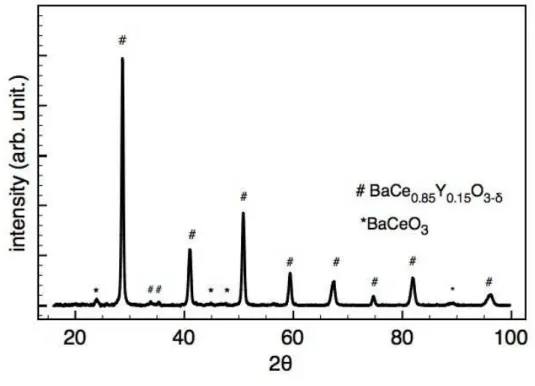
The composition of the powder was confirmed by X-ray diffraction as it can be seen in figure II.6. Residual impurities of BaCeO3 were also detected.
According to the information given by the supplier, this powder has a narrow particle size distribution centered in 0.23 µm, with the granulometric parameters presented in table II.1.
Table II.1 : Granulometric data for the BaCe0.85Y0.15O3−δ powder.
d10 d50 d90
0.15 µm 0.23 µm 0.71 µm
However, the particle size distribution is wider than what the granulometric values may indicate. As shown in figure II.7, the powder particle size distribution includes particles from 0.2 µm to 2 µm.
Observations with scanning electron microscope show that this powder is agglomerated in clusters from 100 µm to 20 µm of small particles of a few micrometers, as it can be seen in figures II.8 (a) and (b).
Figure II.6 : Particle size distribution in volume for BaCe0.85Y0.15O3−δ powder.
Figure II.7 : Particle size distribution in volume for BaCe0.85Y0.15O3−δ powder.
(a) (b)
A dilatometric study of this powder was carried out in pellets of 5.2 mm thickness and 10 mm diameter pressed at 100 MPa for 5 minutes. They were then put in the tester between two platinum foils to keep the alumina (Al2O3) of the experimental apparatus from reacting
with the barium cerate. A load of 5 g was applied in order to assure that the apparatus was in contact with the pellet during the whole experiment and would follow the sample’s shrinkage. The behavior of the platinum foils during the same thermal cycle was previously studied and it was taken into account in the analysis of the behavior of the ceramic pellet. As shown in figure II.9 the thermal cycle used consisted in heating the sample at 5◦
C/min until 1450◦
C, where the temperature is held for 5h. The sample is then cooled at 5◦
C/min until room temperature.
Figure II.9 : Thermal treatment used for the study of the thermo-mechanic behavior of BaCe0.85Y0.15O3−δ.
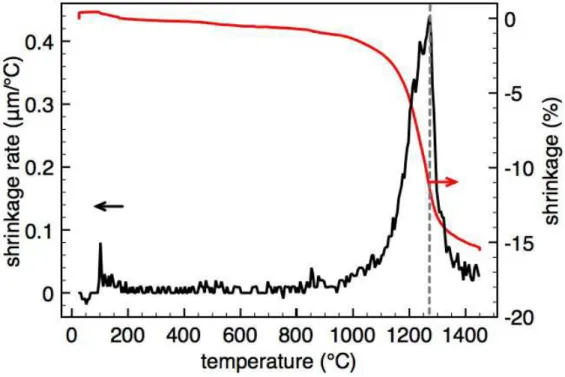
The behavior of the BaCe0.85Y0.15O3−δ pellet during the thermal treatment is shown in
figure II.9. The sample volume decreases slightly with the increasing of temperature until 900◦
C. At this temperature, the sample shrinkage strongly increases. The sample’s shrinkage rate can be obtained through the expression:
shrinkage rate = lt+1− lt
(t + 1) − t (II.6)
where ltis the height of the sample at time t.
In figure II.10 the evolution of the shrinkage rate with the sample temperature is plotted. These data allow us to conclude that BaCe0.85Y0.15O3−δ powder reaches its highest shrinkage
rate at 1260◦
C.
A pellet of BaCe0.85Y0.15O3−δ powder was sintered at 1300◦C at different durations. It
was found that the density of the pellet after sintering didn’t change significantly after 5h. The density of the pellets after sintering (see figure II.11(a) and (b)) was 94% of the theoretical
Figure II.10 : Shrinkage rate and shrinkage of BaCe0.85Y0.15O3−δ powder as function of
temperature. one.
(a) (b)
Figure II.11 : S.E.M. image of a BaCe0.85Y0.15O3−δ pellet sintered at 1300◦C for 5h.
II.3.2 Oxygen ion electrolyte materials
An oxygen ion electrolyte must fulfill the same requirements of the proton electrolyte material except that O2− ions are the charge carriers instead of H+. In the operating conditions of
type of conductivity was first observed in doped zirconia (ZrO2) by Walther Nernst in the
last decade of the nineteenth century. In the late 1930s, the first SOFC concept used yttria-stabilized zirconia (YSZ) as oxygen-ion electrolyte material which remains until today the state-of-the-art material [21].
II.3.2.1 Oxygen ion conduction mechanism
As for proton conduction, the oxygen ion conduction depends on the mobility and concentration of the defects in the structure of the oxide.
Fluorite structured doped oxides are the most well known and better understood oxygen ion conductors [22]. These materials are not fast oxygen ion conductors until they are doped with aliovalent cations. The introduction of these ions into the host lattice introduces oxygen vacancies, as for example the addition of Gd2O3 to ceria. This process can be translated by
the following defect equation in Kr¨oger-Vink notation: 2Ce× Ce+ O × o + Gd2O3 ⇒ 2Gd � Ce+ V •• O + 2CeO2 (II.7)
where Gd’Ce is a gadolinium atom replacing in a cerium position, OxO is an oxygen atom in
its position and V••
O is a vacancy in an oxygen site.
In this case the neutrality condition implies that [Gd’Ce] = 2[V••O]. Since this condition
is valid for any trivalent metal substitutional ions, the vacancy concentration will be linearly dependent upon the dopant concentration. However, as it can be seen in figure II.12(a), the conductivity of ceria solutions reaches a maximum for a certain dopant level.
The main reason for this maximum is the presence of a minimum energy barrier necessary to activate ionic conduction.This term is obviously very important because it determines the temperature dependence of the ionic mobility [22] [23]. As one can see in figure ??, Faber et al. [24] have determined the minimum of the activation energy for oxygen ion conduction in five different ceria solid solutions. The minimum determined coincides only roughly with the minimum in conductivity because it is not the only parameter having an influence in the conductivity depending on the concentration of the dopant. Two theories are proposed to understand this minimum. Wang et al. [25], explain it by the presence of a minimum of the electrostatic effect of the charged dopant ions, lowering the activation energy for conduction. On the other hand, Faber et al. [24] attribute the presence of the minimum to the change in the energy of oxygen sites in the vicinity of a dopant cation in the interaction radius, rc. The
spheres of influence of each dopant ion would overlap with the increase of its concentration, creating an interconnected pathway with a lower activation energy for conduction.
Faber et al.[24] also showed that the minimum of activation energy changed differently according to the chemical identity of the dopant cation (see figure II.12(b)).
Kilner [26] has pointed out that both calculated and experimental data for the activation enthalpies are correlated with the ionic radius of the dopant, as shown in figure II.13, finding a new minimum when the ionic radius of the host and the dopant approximately matched.
Thus, two conclusions can be drawn about the doping of fluorites with a dopant of effective charge −1: (a) the activation energy is concentration dependent with a minimum at low dopant concentrations; (b) for a given concentration the activation enthalpy is dependent upon the size of the dopant with a minimum when the radii of the host and the dopant are approximate.
Even though it is not the oxide with the highest ionic conductivity, YSZ has stable ionic conductivity in a large range of oxygen partial pressure while the low mobility of the electronic charge carriers make its electronic conductivity negligible with respect to the ionic one. Zirconia has a fluorite structure that has the same conduction mechanism explained
(a) (b)
Figure II.12 : Isothermal conductivity for different ceria-based solutions. [22]. Activation energies for oxygen ion conductivities in several doped ceria solutions [24](b).
Figure II.13 : Association enthalpy of several ions in ceria-based solutions as a function of the ions radius [22].
![Table I.2 : Electrochemical reactions in the electrodes of the different types of fuel cell [9]](https://thumb-eu.123doks.com/thumbv2/123doknet/2609594.57695/17.892.161.768.437.650/table-electrochemical-reactions-electrodes-different-types-fuel-cell.webp)
![Figure II.4 : Proton diffusion coefficients in I-V and II-IV perovskite-type oxides [15].](https://thumb-eu.123doks.com/thumbv2/123doknet/2609594.57695/33.892.225.663.704.1046/figure-ii-proton-diffusion-coefficients-perovskite-type-oxides.webp)