HAL Id: hal-01915657
https://hal-amu.archives-ouvertes.fr/hal-01915657
Submitted on 7 Nov 2018
HAL is a multi-disciplinary open access
archive for the deposit and dissemination of
sci-entific research documents, whether they are
pub-lished or not. The documents may come from
teaching and research institutions in France or
abroad, or from public or private research centers.
L’archive ouverte pluridisciplinaire HAL, est
destinée au dépôt et à la diffusion de documents
scientifiques de niveau recherche, publiés ou non,
émanant des établissements d’enseignement et de
recherche français ou étrangers, des laboratoires
publics ou privés.
M
2
APix: A Bio-Inspired Auto-Adaptive Visual Sensor
for Robust Ground Height Estimation
Julien Dupeyroux, Victor Boutin, Julien Serres, Laurent Perrinet, Stéphane
Viollet
To cite this version:
Julien Dupeyroux, Victor Boutin, Julien Serres, Laurent Perrinet, Stéphane Viollet. M
2APix: A
Bio-Inspired Auto-Adaptive Visual Sensor for Robust Ground Height Estimation. 2018 IEEE
In-ternational Symposium on Circuits and Systems (ISCAS), May 2018, Florence, Italy.
�10.1109/IS-CAS.2018.8351433�. �hal-01915657�
M
2
APix: a bio-inspired auto-adaptive visual sensor
for robust ground height estimation
Julien Dupeyroux
∗, Victor Boutin
†, Julien R Serres
∗, Laurent U Perrinet
†and St´ephane Viollet
∗∗Biorobotics Department - Institute of Movement Sciences - Aix-Marseille University, Marseille, France
Email: [email protected]
†Institute of Neuroscience of La Timone - Aix-Marseille University, Marseille, France
Email: [email protected]
Abstract—This paper presents for the first time the embed-ded stand-alone version of the bio-inspired M2APix (Michaelis-Menten auto-adaptive pixels) sensor as a ventral optic flow sensor to endow glider-type unmanned aerial vehicles with autonomous landing ability. Assuming the aircraft is equiped with any reliable speed measurement system such as a global positionning system or an inertial measurement unit, we can use the velocity of the glider to determine with high precision its height while landing. This information is robust to different outdoor lighting conditions and over different kinds of textured ground, a crucial property to control the landing phase of the aircraft.
I. INTRODUCTION
Providing Unmanned Aerial Vehicles (UAVs) with au-tonomous motion and navigation skills is one of the most important concern of modern robotics. While robots are getting smaller and smaller, motion and localization estimation sensors still need further improvements in many respects: computa-tional cost, size and weight, power consumption, signal-to-noise ratio, robustness to lighting variations, and so on. Any sensor responding to those criteria would be interesting for critical maneuvers of UAVs such as autonomous taking off, hovering and landing.
Thanks to many remarkable studies, several visual sensors and techniques are now available for precise optic flow (OF) measurement. In particular, various neuromorphic vision sen-sors were developed inspired from the vertebrates’ retina [1], [2], [3]. For instance, the Asynchronous Time-based Image Sensor (ATIS) [4], the Dynamic Vision Sensor (DVS) and the Dynamic and Active-pixel Vision Sensor (DAVIS) [5], [6] are event-based CMOS cameras, the pixels of which directly respond to changes occuring in the scene in terms of luminance or contrasts. The visual cues are no longer represented as full images but as a stream of events. Each event consists of one polarity (+1 or −1 corresponding to an increasing or decreasing contrast, respectively) associated with its timing and address location. Such sensors involve less computational cost, and allow the use of spiking neural networks to derive any information, including OF.
However, the most traditional way to compute OF remains relying on the use of CCD cameras coupled with visual Simul-taneous Localization and Mapping (SLAM) algorithms. SLAM methods extract features in the camera field of view to estimate the motion and location of the robot. Many embedded solutions using SLAM have been proposed for terrestrial robots [7], and UAVs [8], [9], [10]. Other methods for visual estimation of an
UAV’s location have been proposed. For instance, De Croon proposed to merge the self induced oscillations of the UAV when approaching the ground and the OF measurements to precisely estimate its height [11]. Despite the improvements made on the computational cost and the accuracy of these systems, efforts still need to be done in terms of weight, power consumption and robustness to light variations in order to be embedded on board Micro Aerial Vehicles (MAVs) for which weight and power consumption are crucial parameters.
These classical methods to extract OF in outdoor areas are still highly disrupted in case of light variations. Here we would like to use OF cues adaptively under varying light context as it is well known to occur in both vertebrates and invertebrates. The M2APix sensor (fig. 1) is an analog silicon retina composed of twelve auto-adaptive pixels. Each pixel’s response follows the Michaelis-Menten law in a 7-decade range [12]. The chip also includes twelve Delbruck pixels, but these are not included in this study due to a better response of the Michaelis-Menten pixels [13]. We propose here to use the M2APix sensor to measure the ventral OF produced during the landing of a glider flying above different ground textures and under natural light conditions. Assuming the ground speed of the glider is known, we propose to use this sensor to control the height of the glider to smooth the landing phase.
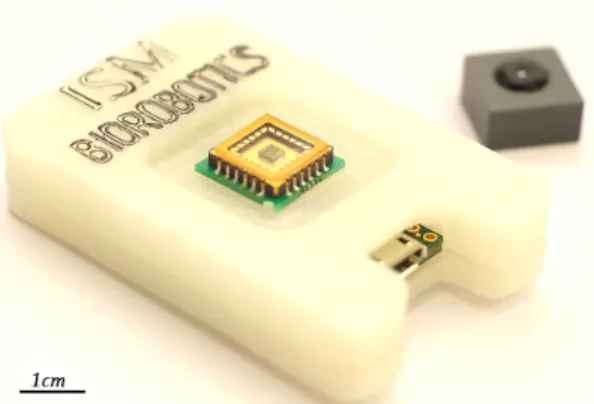
Fig. 1. The stand-alone version of the M2APix sensor in its
custom-made protective package containing the Teensy 3.2 board, i.e. an arduino-like microcontroller providing a USB port for the readout of the OF values (5V, 250mA). This sensor features a mass as small as 17.4 grams and a size of only 5.4x3.3x1.5 cm.
The M2APix sensor has many advantages as it provides fast OF measurements with only 12 pixels (> 30Hz), under 7-decade lighting conditions [14]. It also has very low power
consumption (3.3V, up to 100mA) and can be easily embedded onboard an UAV.
Section II presents the OF sensor and its electronic archi-tecture. Section III describes the methods of OF calculation applied to the M2APix sensor. Section IV focuses on the calibration process required before the use of the sensor. Then section V presents both off-line and on-line results of several real-conditions emulated landing experiments. Finally, these results will further be discussed in section VI.
II. THE OPTIC FLOW SENSOR
The M2APix sensor is composed of two rows of six hexagonal auto-adaptive Michaelis-Menten pixels (fig. 2b). The silicon retina is a 2 x 2mm CMOS circuit using the 350nm XFAB standard CMOS process encapsulated in a standard 9 x 9mm (LCC24) package with 24 pins (fig. 2a). The sampling frequency can be set from 100Hz to 1kHz. In this study, the frequency was set at 333Hz.
Fig. 2. (a) The M2APix silicon retina; (b) Magnified view of the two
Menten pixels rows used in this study; (c) View of 3 Michaelis-Menten pixels; (d) Architecture of the stand-alone version of the sensor. Adapted from [13].
Each pixel’s response V is given by the Michaelis-Menten equation [15], defined as follows
V= Vm·
In
In+ σn (1)
Where Vm is the maximum photoreceptor’s value, I is
the ambient light intensity, σ is equal to the light intensity corresponding to half saturation, and n is a an arbitrary power ranging from 0.7 to 1 (n = 1 in our M2APix retina [13]). This
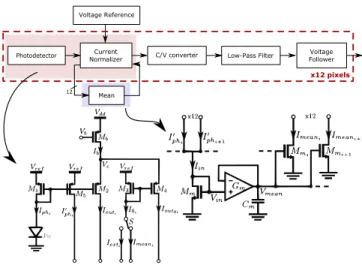
equation describes the adaptation process that has first been observed and mathematically described by Naka and Rushton while studying the cone response inside the freshwater fish’s eye (Cyprinidae) [16]. The overall structure of the M2APix circuits is provided in figure 3.
III. THEOFCALCULATION
The optic flow ω (in rad/s) is defined as
ω = ∆ϕ ∆T (2) Voltage Follower Mean Current Normalizer Photodetector Voltage Reference
C/V converter Low-Pass Filter
x12 pixels 12
Fig. 3. Gain-controlled structure of the M2APix sensor with hardware implementations in VLSI of an elementary auto-adaptive pixel and of the averaging block computing the mean current. Adapted from [13].
Where ∆ϕ is the inter-pixel angle between two adjacent pixels in a row (fig. 4), and ∆T is the time delay between the output signals of these two pixels. We call Local Motion Sensor (LMS) any pair of adjacent pixels used to compute ω. If the linear ground speed V is known, then the distance d to the ground can be calculated using equation (3).
d=V
ω (3)
Fig. 4. (a) Optics geometry of two adjacent pixels. ∆ϕ is the inter-pixel angle between the main optical axes of two adjacent pixels (refered to as a LMS), and ∆ρ is the acceptance angle given by the width of the Gaussian angular sensitivity at half height; (b) Typical signals in case of contrast detection over time. Adapted from [14].
To compute the OF, the 12 raw signals are first digitally band-pass filtered between 3Hz and 30Hz. Then, two time-of-travel methods are proposed to compute ∆T between two adjacent pixels of one LMS, and therefore the corresponding OF value. The first method is based on thresholding. Once the first pixel has reached a constant threshold, a timer is launched until the second pixel reaches the same threshold. The measured time corresponds to ∆T and is used to compute the
OF. The second method uses the principle of cross-correlation: the two pixels filtered signals are buffered [12], [14]. The time delay ∆T corresponds to the time distance between the two buffers that minimizes the cross-correlation error.
Fig. 5. Photography of the benchmark setup. (a) Pattern speed measurement system; (b) M2APix sensor set parallel to the moving pattern to measure a
1D-OF; (c) Laptop for data acquisition and processing; (d) Moving pattern made of red and white stripes.
IV. CALIBRATION
The calibration process, as described in [17], [14], consists of placing the sensor in front of a moving pattern (fig. 5). The sensor orientation and the direction of the moving pattern are set parallel so that the OF calculation can be done using equation (2). The pattern is made of red and white stripes and is moving linearly along the M2APix rows axis.
The inter-pixel angle has been estimated and the full results are displayed in table I. On the basis of 120 tests with linear speed varying from 35cm/s to 85cm/s at a distance of 20cm, the average inter-pixel angle ∆ϕ is equal to 3.05◦ with a standard deviation of 0.03◦. TABLE I. ESTIMATION OF∆ϕ (n = 20). Speed [cm/s] ∆ϕ Outliers 35 3.0378◦ 0 45 3.0584◦ 0 55 3.0315◦ 0 65 3.0726◦ 0 75 3.0031◦ 0 85 3.0940◦ 1 V. EXPERIMENTS
In the case of this study, the sensor was placed at the end of a pole hold by an operator, always facing the ground, and the motion was made by the operator, who simply walked at a speed of 1.3m/s as measured with a GPS sensor, and lowered the pole following a sigmoid curve. Therefore, since the initial and final heights of the sensor were 75cm and 20cm, the OF is ranging from 100◦/s to 400◦/s. It was shown in [14] that OF in such a range produced a coefficient of variation of about 10% using the cross-correlation method, and about 80% in the results from the threshold method. The tests were conducted on July 14th, 2017 in Telluride, Colorado, USA, at 6pm.
The off-line results with the cross-correlation method are shown in figure 6. The buffer window used for the compu-tation was set to 600 samples. The different ground textures
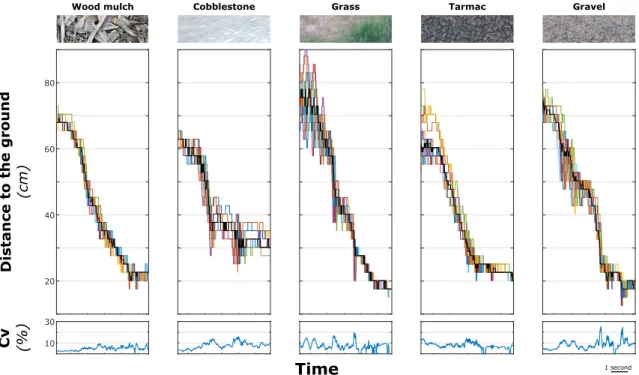
provided good estimates of the distance to the ground. The corresponding standard deviation (STD) tends to decrease with the sensor’s height. This can be explained by the increasing number of details in the texture seen by the sensor. It can be noticed that the coefficient of variation Cv is maintained
under 15% in most cases (fig. 6). Salient textures such as wood mulch and cobblestone provide good OF measurement independently from the height (ST D < 5cm). More granular textures such as tarmac have also low variations, but it seems that a maximum height should not be exceeded to provide re-liable measurements. Finally, grass and gravel textures provide irregular informations depending on the height of measurement (above 1m for grass, and below 30cm for gravel).
As the threshold method needs 50 times less computational ressources than the cross-correlation method [14], it was implemented onboard the Teensy 3.2 microcontroller (fig. 2d). In this version, only one LMS was used to compute the height of the sensor during the emulated landing phase. Figure 7 shows the result while landing above wood planks.
VI. CONCLUSION
The results presented here clearly prove the suitability of the M2APix sensor to compute 1D-ventral OF in critical maneuvers such as autonomous landing of UAVs. The various ground textures tested show that this sensor can be used in numerous environmental contexts. The very small size and weight of the sensor make it a good candidate for embedding in any type of UAVs, including MAVs, and for different types of applications, including distance estimation, real-time obstacle detection, speed measurement, and last-meter landing. 2D-OF estimation can also be considered on the basis of the method described in [18].
The threshold method offers many advantages over the cross-correlation method, such as less computational cost, fast execution and low memory needs, but is highly dependent on the threshold value, hence far less robust than the cross-correlation method. For now, it is clearly unthinkable to process OF using the cross-correlation method with the full 12 pixels on the Teensy 3.2 board. However, other low-weight boards like off-the-shelf computer on module would be sufficient to supply the computational capacity needed.
ACKNOWLEDGMENT
As the experiments were conducted during the 2017 Tel-luride Neuromorphic Vision Engineering Workshop, the au-thors would like to thank the Compound Eye group for the interesting discussions, and particularly Ryad Benosman and Tobias Delbruck. We are also grateful to Marc Boyron and Julien Diperi for their technical support.
REFERENCES
[1] C. Posch, T. Serrano-Gotarredona, B. Linares-Barranco, and T. Delbruck, Retinomorphic event-based vision sensors: bioinspired cameras with spiking output, Proceedings of the IEEE, 102(10), pp. 1470-1484, 2014. [2] K. Boahen, and A. G. Andreou, A contrast sensitive silicon retina with reciprocal synapses, In Advances in neural information processing systems, pp. 764-772, 1992.
[3] K. A. Zaghloul, and K. Boahen, A silicon retina that reproduces signals in the optic nerve, Journal of Neural Engineering, 3(4), 257, 2006.
Time 20 40 60 80 10 30 Cv (%)
Wood mulch Cobblestone Grass Tarmac Gravel
1 second
Fig. 6. Distance-to-the-ground of the M2APix sensor, computed using the cross-correlation method while a emulated landing phase is handly operated by
moving the M2APix above different textured grounds. The 10 LMSs’ responses are displayed in color while the median distance value is displayed in black.
The coefficient of variation Cv along the landing is also displayed below.
Wood planks
100
50
0
Distance to the grou
nd
(cm)
Time 2 seconds
Fig. 7. On-line results during one emulated landing of the sensor using the threshold method with only one LMS. Computation process is made onboard the Teensy 3.2 microcontroller.
[4] C. Posch, D. Matolin, and R. Wohlgenannt, An asynchronous time-based image sensor, In Circuits and Systems, 2008. ISCAS 2008. IEEE International Symposium on. IEEE, pp. 2130-2133, 2008.
[5] R. Berner, C. Brandli, M. Yang, S. C. Liu, and T. Delbruck, A 240x180 10mW 12us latency sparse-output vision sensor for mobile applications, In VLSI Circuits (VLSIC), 2013 Symposium on. IEEE, pp. C186-C187, 2013.
[6] C. Brandli, R. Berner, M. Yang, S. C. Liu, and T. Delbruck, A 240x180 130dB 3s latency global shutter spatiotemporal vision sensor, IEEE Journal of Solid-State Circuits, 49(10), pp. 2333-2341, 2014.
[7] A. Geiger, P. Lenz, and R. Urtasun, Are we ready for autonomous driving? the kitti vision benchmark suite, In Computer Vision and Pattern Recognition (CVPR), 2012 IEEE Conference on. IEEE, pp. 3354-3361, 2012.
[8] F. Kendoul, I. Fantoni, and K. Nonami, Optic flow-based vision system
for autonomous 3D localization and control of small aerial vehicles, Robotics and Autonomous Systems, 57(6), pp. 591-602, 2009. [9] M. Blosch, S. Weiss, D. Scaramuzza, and R. Siegwart, Vision based MAV
navigation in unknown and unstructured environments, In Robotics and automation (ICRA), 2010 IEEE international conference on. IEEE, pp. 21-28, 2010.
[10] L. Heng, D. Honegger, G. H. Lee, L. Meier,P. Tanskanen, F. Fraundor-fer, and M. Pollefeys, Autonomous visual mapping and exploration with a micro aerial vehicle, Journal of Field Robotics, 31(4), pp. 654-675, 2014.
[11] G. C. de Croon, Monocular distance estimation with optical flow maneuvers and efference copies: a stability-based strategy, Bioinspiration & Biomimetics, 11(1), 016004, 2016.
[12] S. Mafrica, A. Servel, and F. Ruffier, Minimalistic optic flow sensors applied to indoor and outdoor visual guidance and odometry on a car-like robot, Bioinspiration & biomimetics, 11(6), 066007, 2016. [13] S. Mafrica, S. Godiot, M. Menouni, M. Boyron, F. Expert, R. Juston,
N. Marchand, F. Ruffier, and S. Viollet, A bio-inspired analog silicon retina with Michaelis-Menten auto-adaptive pixels sensitive to small and large changes in light, Optics express, 23(5), pp. 5614-5635, 2015. [14] E. Vanhoutte, S. Mafrica, F. Ruffier, R. J. Bootsma, and J. Serres,
Time-of-Travel Methods for Measuring Optical Flow on Board a Micro Flying Robot, Sensors, 17(3), 571, 2017.
[15] L. Michaelis, and M. L. Menten, Die kinetik der invertinwirkung, Universittsbibliothek Johann Christian Senckenberg, 2007.
[16] K. I. Naka, and W. A. Rushton, S-potentials from luminosity units in the retina of fish (Cyprinidae), The Journal of physiology, 185(3), pp. 587-599, 1966.
[17] F. L. Roubieu, F. Expert, M. Boyron, B. J. Fuschlock, S. Viollet, and F. Ruffier, A novel 1-gram insect based device measuring visual motion along 5 optical directions, Sensors, 2011 IEEE, pp. 687-690, 2011. [18] R., Pericet-Camara, M. K., Dobrzynski, R., Juston, S., Viollet, R.,
Leitel, H. A., Mallot, and D., Floreano, An artificial elementary eye with optic flow detection and compositional properties, Journal of The Royal Society Interface, 12(109), 20150414, 2015.