The Climate Change Debate and Its Implications for Megacities
byJessica Elise LeBlanc S.B. Systems Engineering University of Pennsylvania (1997)
Submitted to the Departments of Civil and Environmental Engineering And the Technology and Policy Program in Partial Fulfillment of the
Requirements for the Degrees of
Master of Science in Civil and Environmental Engineering And
Master of Science in Technology and Policy At the
MASSACHUSETTS INSTITUTE OF TECHNOLOGY JUNE 1999
© Massachusetts Institute of Technology, 1999. All Rights Reserved.
Signature of Author
Technology and Policy Program Department of Civil and Environmental Engineering May 14, 1999 Certified by
...
Fre oavenzadeh
Thesis Supervisor George Macomber Profespor of Construction Management Accepted byRichard de Neufville /C iin Technology and Policy Program
Accepted by
...
it...
..
J.
W
hittle
The Climate Change Debate and Its Implications for Megacities
by
Jessica Elise LeBlanc
Submitted to the Departments of Civil and Environmental Engineering and the Technology and Policy Program on May 14, 1999 in Partial Fulfillment of the Requirements for the Degrees of Master of Science in Civil and Environmental Engineering and Master of Science in Technology and Policy.
ABSTRACT
In the past decade or so, global warming has become the most contentious of all international environmental issues. This is due to many factors including scientific uncertainties, a separation of the costs and benefits of mitigation, and diverse national pollution histories. For the most part, the debate centers between the developed world, which has historically been responsible for the majority of the world's greenhouse gas emissions; and the developing world, which is primarily interested in reaching a standard of living equitable to the developed world, irrespective of the pollution that will be produced in the process. Some of the issues of contention are as follows: the responsibilities of the developed world; the needs of the developing world; the policy mechanisms for addressing climate change; and the use of technological solutions for climate change abatement.
This thesis attempts to address those concerns over climate change as specifically pertaining to megacities, those urban areas of 10 million or more inhabitants. Along with populations of 10 million or more, exist immense needs in terms of food, water, shelter, and employment.
Although they are built on only 2% of the world's land surface, urban areas use over three-quarters of the world's resources and discharge similar amounts of waste. Pollution,
overcrowding, and unsanitary conditions plague many of the megacities of the world, especially those in the developing countries.
By addressing and analyzing those political, economic, and environmental concerns of
megacities in the climate change context, this thesis finds that these urban areas have much to be concerned about. The urban areas of the developed world will likely find ways to decrease their per capita greenhouse gas emissions through more efficient energy uses and technologies. In doing so, they are likely to experience the ancillary benefit of reduced, localized air pollution. Urban areas in the developing world, however, may make the mistake of sacrificing their local environments in order to promote economic growth. However, if they are willing to cooperate with the industrialized countries of the world, they may be able to reap the benefits of
international financial aid and technology transfers. Thesis Supervisor: Fred Moavenzadeh
Titles: George Macomber Professor of Construction Management Director, Technology and Development Program
TABLE OF CONTENTS
ABSTRACT LIST OF TABLES LIST OF FIGURES CHAPTER 1:. CHAPTER 2: CHAPTER 3: CHAPTER 4: CHAPTER 5: CHAPTER 6: CHAPTER 7: CHAPTER 8: REFERENCESINTRODUCTION & OVERVIEW MEGACITY ATORIBUTES
SCIENTIFIC & SOCIAL DIMENSIONS OF GLOBAL WARMING
CLIMATE CHANGE POLITICS
A DIVERSITY OF INTERESTS
APPROACHES & SOLUTIONS TO CLIMATE CHANGE MEGACITY IMPLICATIONS
CONCLUSIONS & RECOMMENDATIONS
9 14 25 36
47
6378
84 86LIST OF TABLES
TABLE 1. POPULATIONS OF EXAMPLE MEGACITIES
TABLE 2. ECONOMY, SERVICES & MOBlIZATION IN EXAMPLE MEGACITIES
TABLE 3. RESOURCE DEPLETION IN EXAMPLE COUNTRIES TABLE 4. AIR POLLUTION IN EXAMPLE MEGACITIES
TABLE 5. 1995 C02 EMISSIONS FROM FOSSIL FUEL BURNING AND CEMENT MANUFACTURING
TABLE 6. PARTY QUANTIFIED EMISSION LIMITATION OR REDUCTION OBLIGATION (QELRO) WITHIN KYOTO PROTOCOL
TABLE 7. NATIONAL CARBON DIOXIDE EMISSIONS & LIMITATIONS
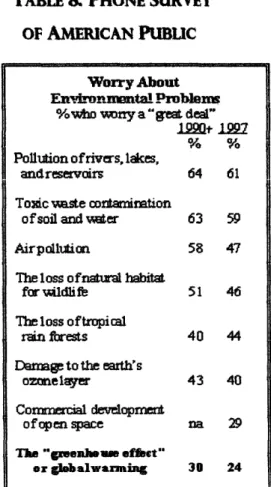
TABLE 8. PHONE SURVEY OF AMERICAN PUBLIC
LIST OF FIGURES
WORLD URBAN POPULATION GROWTH, 1950-2025 REGIONAL SHARES OF
C02
EMISSIONSWORLD POPULATION SIZE PAST ESTIMATES AND MEDIUM-, HIGH- AND LOW FERTILITY VARIANTS, 1950-2050
ATMOSPHERIC CARBON DIOXIDE CONCENTRATIONS
THE MULTIPLE GOALS OF SUSTAINABLE DEVELOPMENT AS APPLIED TO
CITIES
FIGURE 1.
FIGURE 2. FIGURE 3.FIGURE 4.
FIGURE 5.CHAPTER
I
INTRODUCTION & OVERVIEW
Concerns about Global Warming have only truly come to the international political forefront within the last decade or so, chiefly due to the establishment of the Intergovernmental Panel on Climate Change (IPCC), a creation of the World Meteorological Organization (WMO) and the United Nations Environment Program (UNEP). Nonetheless, the topic has created an astounding amount of controversy, debate and tension both within and between nations. Although it is now widely accepted that the Greenhouse Effect and the associated Global Warming are true scientific phenomena expected to occur over a long time period, significant controversy and uncertainty continue to surround the consequential climate change resulting from these phenomena. Because global warming is inherently global in nature, actions taken (or gases emitted) in one part of the world may contribute to positive consequences, such as
increased agricultural growth periods, in a second part of the world and negative consequences, such as increased flooding, in a third. Subsequently, it is this lack of equal delegation of the costs and benefits of global warming over both time and space that has led to a multitude of political, economic, and social debates over what has been done to cause, and what could and should be done to mitigate global warming. The largest ideological division has been drawn between the developed world, which has historically been responsible for the majority of the world's greenhouse gas emissions, and the developing world, which is most interested in reaching a standard of living equitable to that of the developed world. However, the debate is certainly not limited internally within the two sectors, developed and developing.
This thesis is intended to provide an analysis of the multitude of issues surrounding global warming. In doing so, the author aims to truly articulate the drivers - political, social, and
economic -behind each issue and their implications for future progress towards climate change mitigation. The paper is structured so as to address those issues and predictions of climate change specifically pertaining to Megacities. Megacities are formally defined as those cities with populations greater than 10 million. However, rather than by a specific population number, megacities may also be defined as those cities and urban areas, which are regional focal points due to their accounting for the majority of the population; municipal, industrial, and
governmental services; and economy contained within that region. In either context, megacities vary widely across regions, specifically between industrialized and developing nations. Some important features to note:
* Urban areas currently accommodate approximately 47% of the world's population'. In 1995, the ten largest cities -Tokyo, Mexico City, Sao Paulo, New York, Bombay,
Shanghai, Los Angeles, Calcutta, Buenos Aires, and Seoul -encompassed 155 million people. The trend of increasing urban populations is expected to rise even further, to an
estimated 57% of the world's population by the year 2020. (UN, 1996)
* As of 1995, there were fourteen cities with populations exceeding 10 million, half of
them in Asia. By 2015, ten more cities are expected to reach or surpass the 10 million mark, all of which are in Asia. (WRI, 1998)
* Cities generate more wealth than do nations as a whole; on average, city level output is more than 10 percent higher than national level output. This divergence is more evident in the lower income nations of Africa, Asia, and Latin America, where urban output surpasses national output by 30-40 percent. (Urban Age, 1998)
1 The percentage of urban population refers to the census population of areas defined as urban in each of the countries of the world. Because each country sets its own definition of "urban", there is a wide range of definitions around the world. (WRI, 1998)
* Cities are major consumers of fossil fuels with over 80% of global consumption.
(Girardet, 1996)
* A 1992 WHO/UNEP study of megacities showed that the most severe air pollution is monitored in cities in developing countries, but that air pollution is a widespread problem in megacities with at least one major air pollutant exceeding health guidelines in all of the 20 megacities studies. Seven of the megacities had three or more pollutants which
exceeded WHO health protection guidelines - Mexico City, Beijing, Cairo, Jakarta, Los Angeles, Sao Paulo, and Moscow. (WHO & UNEP, 1992)
That said, it is clear the important role that megacities play and will continue to play in the future within the global warming context. However, many of these urban areas, especially those in the developing countries have done little to mitigate global warming, mainly due to a lack of
information, resources, long-term goals, and political power. Nonetheless, climate change and climate change policies will have significant implications on megacities. Therefore, the main goal of this thesis is to address the political, economic and social concerns of climate change and relate them to megacities and other urban areas.
Overview
The remainder of this chapter consists of a quick summary of the major findings and conclusions made within this research project in order to introduce the reader to the important issues of the paper. Chapter 2 discusses the somewhat ambiguous concept of megacities and its relation to global warming, citing many of the important statistics related to the climate change issue. Chapter 3 then addresses the scientific and social dimensions of global warming,
including the uncertainties associated with and the anticipated effects of climate change. Chapter 4 provides a review of the institutional political components of climate change, such as the IPCC and the Kyoto Protocol. Chapter 5 then discusses the international interests of specific countries, regions, non-governmental groups and industries within the climate change debate. Chapter 6 then looks at the various policy options applicable to climate change and the anticipated
advantages and disadvantages of each. Chapter 7 combines all the work of the previous chapters in order to address and evaluate the anticipated effects of, and policies for climate change, as pertaining to megacities. It will discuss the positive and negative consequences that regulations and incentives may entail for these urban areas and draws attention to their concerns. Finally, the conclusion will tie together the findings of the paper by summarizing those issues, which are vital to the megacities in the context of climate change.
Summary of Findings
Having completed this research, the ideas that are now most clear to me are the following:
* in a business-as-usual scenario, megacities will be more prevalent in the future than ever before, specifically in the developing world countries,
* as of yet, specific urban interests have played a minimal, if any, role in the climate change debates, due to a lack of resources and long-term political foresight within municipal governments,
* as the world's largest consumers and producers, megacities and other urban areas potentially have much to gain and lose from both climate change and climate
change-related policies including disproportional economic burdens and ancillary environmental benefits and sacrifices,
climate change prevention must be synonymous with megacity/urban development that is both sustainable and strategic, and accounts for the needs of its hinterland, which in many cases is the entire world.
MEGACITY ATTRIBUTES
As mentioned in chapter 1, megacities are the focal point of this paper. In order to articulate the concerns of megacities in the climate change context, I have chosen nine cities, which will function as examples (pictures and information on each city are on the last three pages of this chapter). These nine cities -Lagos, Bombay, Shanghai, Tokyo, Mexico City, Moscow, Paris, New York, and Sao Paulo - were chosen for two main reasons. Firstly, they are distributed throughout the globe, in both industrialized and developing countries, therefore providing an adequate degree of representation. Secondly, most are either national or state capitals, facilitating data collection. None of them is an exact depiction of the term megacity, since they are all very diverse. However, they are used to illustrate both the similarities and the diversities, which resonate throughout urban regions across the globe. Two of these cities, Moscow and Paris, do not fit the formal definition of the megacity with 10 million or more inhabitants, however, they are the closest examples Europe has to offer. In this chapter, population, economic and environmental indicators are used in order to draw comparisons and contrasts between the example cities. In addition, the same cities will be continuously used as illustrative examples throughout the remainder of this thesis, to physically connect the concept of megacities to the concept of climate change.
Population & Growth
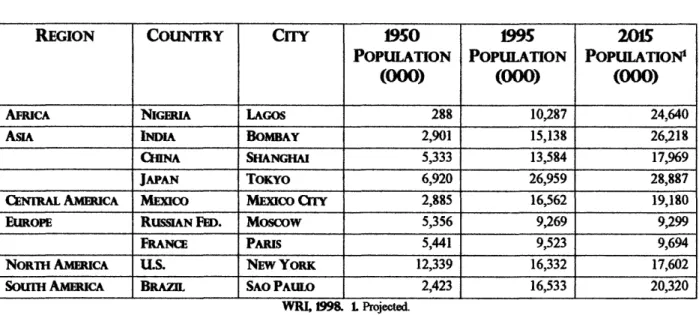
The most common denominator of the megacity is its astounding population. However, as you can see in Table 1, the population numbers vary significantly across the example cities.
CHAPTER 2
Whereas Lagos, Nigeria is just over 10 million in size, New York City is over 16 million in size, and Tokyo, Japan is at almost 27 million.
TABLE 1. POPULATIONS OF EXAMPLE MEGACITIES
REGION COUNTRY CITY 1950 1995 2015
POPULATION POPULATION POPULATION'
(000)
(000)
(000)
AFRICA NIGERIA LAGOS 288 10,287 24,640
ASIA INDIA BOMBAY 2,901 15,138 26,218
CHINA SHANGHAI 5,333 13,584 17,969
JAPAN TOKYO 6,920 26,959 28,887
CENIRAL AMERICA MEXICO MEXICO CITY 2,885 16,562 19,180
EUROPE RUSSIAN FED. MOSCow 5,356 9,269 9,299
FRANCE PARIS 5,441 9,523 9,694
NORTH AMERICA U.S. NEW YORK 12,339 16,332 17,602
SouTH AMERICA BRAZIL SAO PAULO 2,423 16,533 20,320 WRI, 199&8. Projected.
Although population itself is a common denominator between these megacities, the population growth trends of the past and present are widely disparate amongst the examples. In
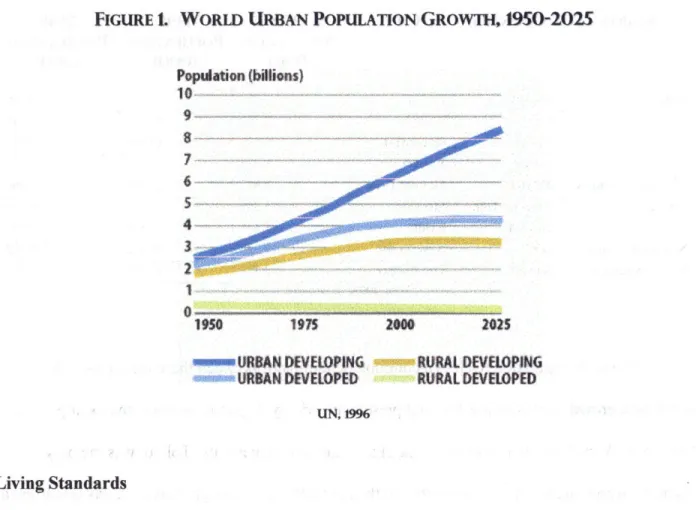
1950, New York City, at almost twice the size of the next largest city, Tokyo, was the only example, which qualified as a megacity. In the next fifty years though, Tokyo nearly quadrupled in size, surpassing New York City by more than 10 million people. The steepest urban growth rates by far, though, have been and will continue to be witnessed by the developing world. As Figure 1 shows, developed world as well as rural developing population growths are expected to reach a plateau just after the year 2000. On the other hand, urban populations in the developing countries are expected to continue their precipitous ascension well into the next millenium.
There are many reasons for this trend of increasing urbanization within the developing world. Expectations of higher wages, better sanitary and utility services, and increased
educational opportunities are all motivations for rural to urban migrations. These are especially true in developing countries, where the divergence between rural and urban areas, in terms of
opportunities and services, is more extreme than in industrialized countries.
FIGURE L. WORLD URBAN POPULATION GROWTH, 190-2025
Population (billions)
9- D
6
S
---1950 1975 2M ZZs
URBAN DEELOPIN RUR1AL DEVELOPING URBAN DEVELOPED RURAL DEVELOPED
UN, 1996
Living Standards
Differences between the developed and developing urban areas become overwhelmingly apparent when comparing living standards, such as purchasing power parity (PPP), utility services, and mobilization. Table 2 illustrates these divergences between the example cities. Going by wealth (PPP) alone, an individual living in New York City is more than 32 times better off than his counterpart in Lagos. That same New Yorker is basically guaranteed water,
sewerage, and electricity services, whereas the Lagosian has a good chance of receiving water and electricity services, but almost nil for sewerage. According to the data, those in the
developing cities of Asia and Africa are significantly less likely to receive water and sewerage services than the corresponding Westerners. Although important in terms of climate change, mobilization is a less valuable living standard statistic than the others are, because it does not control for choice and alternatives. For example, individuals living in cities with excellent public transportation facilities may not require or even desire car ownership. New York City is a good example of this. On the other hand, in cities such as Bombay, and Shanghai, other forms of mobility, such as mopeds, motorcycles, and three-wheelers are very popular. In India, for example, 73% of the vehicles are two stroke, which includes the two and three-wheelers (CSE,
1999).
TABLE 2. ECONOMY, SERVICES & MOBILIZATION IN EXAMPLE MEGACITIES
CITY LAGOS BOMBAY SHANGHAI TOKYO MEXICO OrY Moscow PARIS NEW YORK SAO PAULOI PER CAPITA PPPt (997 INTS) 880 1,650 3,570 23,400 8,120 4,190 21,860 28,740 6,240
WRI, 1998. 1 By Country, World Bank, 1998.
Financial and Political Power
Relative to the nations that encircle them, cities tend to be responsible for a
disproportional amount of financial and political power. Many of the megacities of the world function as both state (or national) capitals and financial megalopolises. The megacities of
% OF URBAN HOUSEHOLDS CONNECTED TO
WATER SEWERAGE ELECTRICITY
65 2 100
55 51 90
100 58 100
N/A N/A N/A
N/A N/A N/A
100 100 100
100 98 100
100 99 N/A
N/A N/A N/A
MOBLIuzATION (CARS/1OO PEOPLE) 4 130 32 552' 1401 138 426 232 791
Tokyo, New York, Sao Paulo, and Mexico City house the headquarters of banks and multinational corporations, which dominate over the global economy. With the continuous introduction of newer, faster communications technologies, international capital and power have become increasingly more transient. Political and financial decisions and trades made within the megacities of the world in one day can define the future existences of far-off nations. (Girardet,
1996)
Environment
The final categories of indicators addressed here are those relating to the environment. Environmental degradation can come in two different, yet usually related, forms -pollution and resource depletion. Countries at varying levels of development are likely to exhibit differing levels of degradation. The less developed countries (LDCs) tend to be resource intensive, utilizing resource depletion (deforestation) and sales as a means of income. LDCs are also more likely to suffer from a larger amount of localized air and water pollution than the developed countries. The industrialized countries, on the other hand, are better equipped to manage their resource stocks and control their local pollution, but are larger contributors to global air
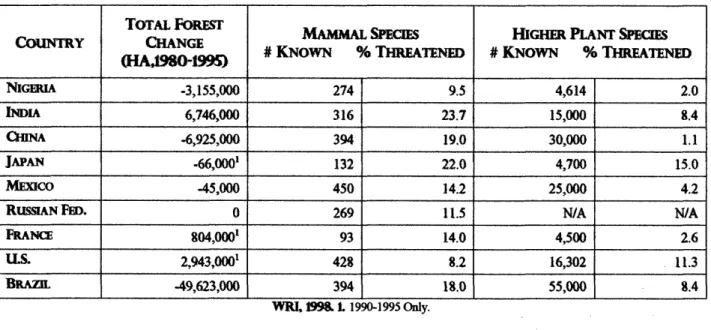
pollution, especially on a per capita basis. This is evident in the statistics presented in Tables 3 and 4. The lower income countries of Brazil, Nigeria, and China have very high deforestation rates, whereas the United States and France have increased their forest cover over time. India is the anomaly here in that, as a lower income country, it also increased its total forest area by
almost 7 million hectares from 1980 to 1995. Species extinction, however, does not seem to be correlated with income and is occurring to varying degrees amongst all of the nations examined.
TABLE 3. RESOURCE DEPLETION IN EXAMPLE COUNTRIES
TOTAL FOREST L MAMMAL SPECIES HIGHER PLANT SPECIES
COuNTRY CHANGE
# KNOWN % THREATENED # KNOWN % THREATENED
(HA,1980O-1995) NIGERIA -3,155,000 274 9.5 4,614 2.0 INDIA 6,746,000 316 23.7 15,000 8.4 CHINA -6,925,000 394 19.0 30,000 1.1 JAPAN -66,000' 132 22.0 4,700 15.0 MEXICO -45,000 450 14.2 25,000 4.2
RUssIAN FED. 0 269 11.5 N/A N/A
FRANCE 804,000' 93 14.0 4,500 2.6
U.S. 2,943,000' 428 8.2 16,302 11.3
BRAZIL -49,623,000 394 18,0 55,000 8.4
WRI 199 8. L 1990-1995 Only.
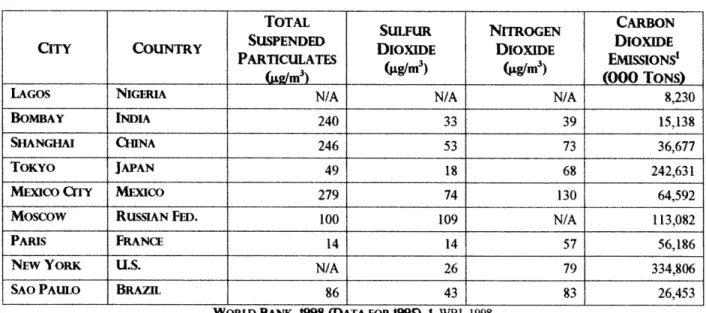
The air pollution data presented in Table 4 is indicative of the urban pollution trends discussed earlier. The localized concentrations of pollutants are much higher in the developing cities, where vehicles and power producers tend to use antiquated technologies and have few pollution controls in place, than the developed ones. According to the data, Mexico City has the worst aggregate air quality, with the highest concentrations of total suspended particulates and nitrogen dioxide, and the second highest concentration of sulfur dioxide. Paris has the best overall air quality, with the lowest concentrations of particulates and sulfur dioxide, and the second lowest concentration of nitrogen dioxide. The primary sources of these pollutants are power stations, motor vehicles, and heating. However, geographic factors also come into play in determining pollutant concentrations. Mexico City for instance is surrounded by a ring of
mountains, which enclose the metropolitan area and also reduce the flow of winds and hence, pollution dispersion. The city is also situated at an altitude of 2,240 m, which means the
atmospheric oxygen content is low and contributes to incomplete combustion processes, causing higher concentrations of some pollutants.
TABLE 4. AIR POLLUTION IN EXAMPLE MEGACITIES
TOTAL CARBON
SUtFUR NITROGEN
SUSPENDED DIOXIDE
CITY COUNTRY SUSPENDED DIOXIDE DIOXIDE DIOXE
PARTICULATES g/ 3) (m3) EMISSIONS
(lLg/m/ 3) 3 (000 TONS)
LAGOS NIGERIA N/A N/A N/A 8,230
BOMBAY INDIA 240 33 39 15,138
SHANGHAI CHINA 246 53 73 36,677
TOKYO JAPAN 49 18 68 242,631
MEXICO CITY MEXICO 279 74 130 64,592
Moscow RUSSIAN FED. 100 109 N/A 113,082
PARIS FRANCE 14 14 57 56,186
NEW YORK U.S. N/A 26 79 334,806
SAO PAULO BRAZIL 86 43 83 26,453
WORLD BANK, 1998 (DATA FOR 1995). 1. WRI, 1998.
Unfortunately, it was impossible to find carbon dioxide emissions on a city basis, so the CO2 data presented in table 4 has been extrapolated from national to city emissions by way of per
capita emissions and population. It is likely, however, that these estimates are conservative since urban areas tend to have higher per capita carbon dioxide emissions than rural areas. Using these indicators, we see that the developed, highly industrialized cities of New York, Tokyo, and Moscow are the largest emitters - all with emissions greater than 100 million metric tons. Of the
developing world cities, Mexico City has the highest emissions -greater than those of Paris, and Lagos has the lowest.
The statistics presented in this chapter illustrate the widespread disparities between urban regions across the globe. These deviations are most apparent when comparing developing to developed regions. The similarities and differences presented here are extremely important in
the climate change context when contemplating the issues of national sovereignty, equity, and sustainability, all of which will be addressed in the upcoming chapters.
CITY SNAPSHOTS
LAGOS, NIGERIA
Location - Western Africa
Population
-
10,287,000
Country Status - Low Income Climate - EquatorialBOMBAY, INDIA
Location - South Asia Population - 15,138,000
Country Status - Low Income Climate - Tropical Savanna
SHANGHAI, CHINA
Location - Southeast Asia Population - 13,584,000
Country Status - Lower Middle Income Climate - Tropical
~
--TOKYO, JAPAN
Location - East Asia Population - 26,959,000 Country Status - High Income Climate - Temperate
MEXICO CITY, MEXICO
Location - Central America Population - 26,959,000
Country Status - Upper Middle Income
Climate - Marine West Coast
Moscow, RUSSIA
Location - Eastern Europe Population - 9,269,000 Country Status - Lower
Middle Income
Climate - Continental Cool Summer
PARIS, FRANCE
Location - Western Europe Population - 9,523,000
Country Status - High Income Climate - Temperate
NEW YORK CITY, USA
Location - North America Population - 16,332,000 Country Status - High Income Climate - Temperate
SAO PAULO, BRAZIL
Location - South America Population - 16,533,000 Country Status - Upper
Middle Income Climate - Tropical
-~---CHAPTER 3
SCIENTIFIC & SOCIAL DIMENSIONS
OF
GLOBAL
WARMING
The Industrial Revolution and the invention of the automobile have irreparably changed our lives forever. They contributed to rapid socioeconomic changes by reducing the time required for travel and the production of goods, inherently making our lives easier. However, mechanization and mobilization were not the only outcomes of this time period. Also associated with the industrialization of America and the other developed nations is the widespread
pollution, which escalated during this time period. In particular, the concentrations of greenhouse gases (GHGs) in the atmosphere have increased by over 30 per cent since the
beginning of the Industrial Revolution (1850s). This rate is unprecedented in geologic time and is expected to continue increasing as the global economy expands, lesser-developed countries (LDCs) industrialize, and populations skyrocket. Although the industrialized world is still responsible for the majority of the world's carbon dioxide and other greenhouse gas emissions, the developing world is quickly catching up.
FIGURE 2.
1973
Non-OECD C Asia** Latinf Europe China 33%
F;cpr " "" $
REGIONAL SHARES OF CO EMISSIONS
1996
merica Asia** Latin America
8% Non- China8.7% 7% s2.6% Europ 1.4% Former USSR 10.3% Midd& UL'LU 64.3% 3.'g OEC D 53.3%
IEA M96
USSR 16 4% Midd Easi 1.15 1% 1.8% ,, ,,,.Population & Emissions
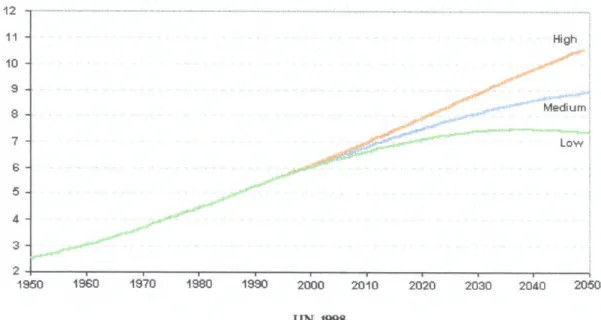
FIGURE 3. WORLD POPULATION SIZE: PAST ESTIMATES AND MEDIUM-, HIGH- AND LOW FERTILITY VARIANTS, 1950-2050
(BILLIONS) 12 . 11 High 10 8 Medium 7 Low 4 3 2 1950 1o60 1870 1980 1990 2000 2010 2020 2030 2040 2050 UN, 1998
Between 1950 and 1998, world population grew from 2.5 billion to 5.9 billion, a 234% increase. It is expected to reach the 6 billion mark sometime this year (1999). However, world population is not only increasing, it is essentially changing its structure. In mid-1998, eighty per cent of the world lived in the less developed regions and twenty per cent in the more developed regions. According to the United Nations Population Division, the population of the less developed regions of the world is expected to increase by 64% over the next 50 years, with the fastest growth occurring in Africa. If these heavily populated countries were to industrialize in the same manner as the North American and European countries have, the associated pollution generation would be astounding.
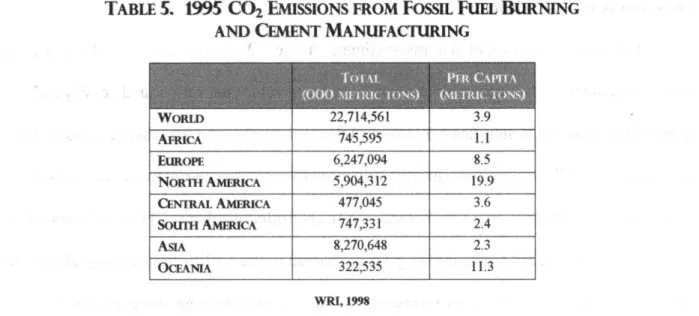
TABLE 5. 1995 CO2 EMISSIONS FROM FOSSIL FUEL BURNING
AND CEMENT MANUFACTURING
WORLD 22,714,561 3.9 AFRICA 745,595 1.1 EUROPE 6,247,094 8.5 NORTH AMERICA 5,904,312 19.9 CENIRAL AMERICA 477,045 3.6 SouTH AMERICA 747,331 2.4 ASIA 8,270,648 2.3 OCEANIA 322,535 11.3 WRI, 1998
As it stands now (Table 5), the African countries emit about 1 metric ton carbon dioxide per capita, compared to North American emissions of 19.9 metric tons per capita.
Hypothetically, if the entire population of Africa were to emit 20 tons of CO2 per person, 15 billion metric tons of CO2 would be released into the atmosphere. This would be equivalent to
66% of the world's total carbon dioxide emissions in 1995. Imagine what this number would be
if the entire world were to emit at the same rate as North America.
These statistics demonstrate the gravity of the situation that the world is facing. After their contemplation, two thoughts should become increasingly clear. The first is that the per capita emissions differentials between the different regions of the world are astounding. The second is that the lesser-developed regions' decisions about development will have widespread implications on the world's environmental health. These concepts will be more thoroughly addressed in later sections of this paper, so it is important to keep them in mind.
Emissions & Global Warming
What does this all mean in terms of climate change? Well, that question is debatable, but some facts remain. First, increased levels of fossil fuel combustion, agricultural activity and deforestation have led to significant increases in the concentrations of greenhouse gases in the atmosphere. The GHGs which are directly influenced by anthropogenic activities are carbon dioxide (CO2), methane (CH4), nitrous oxide (NO), chlorofluorocarbons (CFCs) and ozone (03)
(Houghton, 1994). Second, greenhouse gases are named so due to their heat-trapping ability. As these gases collect within the earth's atmosphere, they prevent heat (long wave terrestrial
radiation) from radiating back out to space, eventually leading to a warming of the earth- "the greenhouse effect". Unfortunately, the precise relationship between the amount of GHGs in the atmosphere and the temperature rise on Earth is unknown.
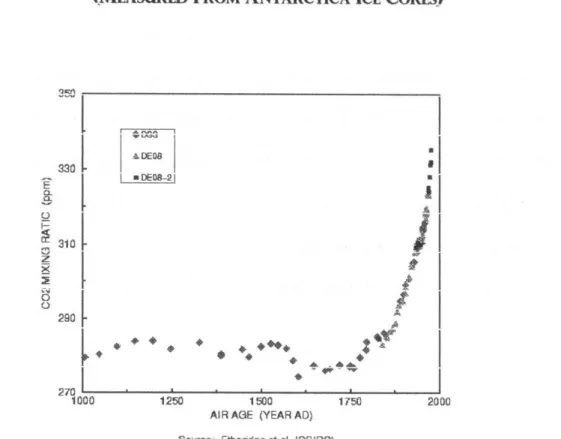
FIGURE 4. ATMOSPHERIC CARBON DIOXIDE CONCENTRATIONS
(MEASURED FROM ANTARCTICA ICE CORES)
J= 330 310 z x o202g0 4DEoN I DEO-21
i
l
-
* -
+
:
'Y~$
270I
1000 1250 1500 1750 2000AIR AGE (YEAR AD) Rntirrne Ftherindnat at I( NIRO)
All in all, the combination of emissions and deforestation has led to an increase in
atmospheric carbon dioxide concentrations from a pre-industrial level of 280 ppm (parts per million), to 363 ppm in 1996. Other greenhouse gases are not nearly as prevalent as CO2, but are also on the rise. For example, methane, mainly produced through farming, has increased by 670 ppb (parts per billion) to 1670 ppb between 1986 and 1996 alone. Whereas industrial and
agricultural activities lead directly to GHG emissions, deforestation is an indirect source of carbon dioxide. Forests contain a multitude of natural acceptors of carbon dioxide. Therefore, as they are cleared, the earth's natural absorption capacity is decreased, resulting in an increase in the amount of CO2 present in the atmosphere. The majority of the world's deforestation has occurred in the tropical regions of South America, Africa, and Asia, which lost over 59 million hectares between 1990 and 1995. Since 1990, tropical forest regions have decreased by over
10%, 196 million hectares. (WRI, 1998)
To complicate the situation further, there are other factors, which indirectly affect global warming. For instance, gases such as carbon monoxide (CO) and nitrogen oxides (NO and NO2), instigate chemical reactions with other GHGs, further augmenting the global warming
phenomenon. On the other hand, atmospheric particles, know as aerosols, can actually have the opposite effect on global warming, by absorbing solar radiation and scattering it back to space. Aerosols are produced in much the same manner as GHGs - through fossil fuel combustion and biomass burning. At present, in some locations, the cooling effects of aerosols can be large enough to more than offset the warming due to greenhouse gases. However, since they do not persist in the atmosphere for long periods of time, aerosols are not expected to offset the global long-term effects of greenhouse gases, which are more long-lived (IPCC, 1997).
Expected Effects of Climate Change
Although the scientific specifics are unclear, there are estimates as to the amount of warming that can be expected in the future. The most noted (and debated) of which is the Intergovernmental Panel on Climate Change's (IPCC) estimation of a 1-3.50C rise in
temperature by the year 2100. To put this into context, during the last major ice age, which ended about 10,000 years ago, temperatures were only about 5°C colder than today (Hill, 1997). Scientists are also unclear as to what exactly the effect this temperature rise will have on the Earth's ecosystem. Predicted effects include rises in sea level, due to glacial melting; increased weather variability, including extremes such as floods, hurricanes, and tornadoes; changes in terrain, including desertification; modified agricultural yields; enhanced air pollution; and the spread of disease (Hill, 1997). Although the actual warming will be experienced globally, due to the current differentiation in regional temperatures and latitudes, the associated effects of
warming will not be the same across the globe. Because they mainly inhabit the warmer parts of the world near the equator and in the Southern Hemisphere, and they are more dependent upon
natural resources for sustenance, many developing countries and island states are expected to incur the more brutal consequences of climate change. For instance, rising sea levels will diminish the total landmass of many of the smaller island countries by a much larger percentage than the continental countries. For example, in the case of the Majuro atoll in the Marshall Islands, it is estimated that for a 1 meter rise in sea level as much as 80 per cent of the total land would be vulnerable (IPCC, 1997). Therefore, we can see that along with the sources of climate change, the symptoms are likely to be severely unequally distributed.
The effects of climate change will by no means be equally distributed across the globe, only adding to the current unequal distribution of population and wealth. Currently, 2 out of 5
people in the world live in either China or India the world's most populated countries, and less than 18% live in Europe and North America. Yet, in terms of purchasing power parity, China ranks 72nd and India 101st, whereas, the United States is 1st (World Bank, 1998). Based on the
international poverty line of less than lInt$/day, 1.4% of the United States, 29.4% of China, and 52.5% of India live in poverty (WRI, 1998). Although these statistics are constantly changing, the comparisons are clear. Global warming and its disparate consequences are likely to only worsen the situation. According to the IPCC, climate change represents an important additional
stress on those systems already affected by increasing resource demands, unsustainable
management practices and pollution, which in many cases may be equal to or greater than those of climate change (IPCC, 1997).
Environmental and ecological destruction induced by climate change will be much more devastating to the poorer economies of the world for several reasons. First off, many developing economies depend on (and in many cases take advantage of) their natural resources for means of income. If those resources were to be destroyed, few prospects would remain for wealth
generation. Secondly, with less capital and technological abundance, developing countries will be less equipped to deal with the negative effects of climate change by means of adaptation. Whereas, industrialized countries may be able to use technological means and methods to adapt to climate change, developing countries will most likely have to depend upon foreign aid and technology transfers. Finally, because the lesser-developed countries (LDCs) play home to the majority of the world's biological diversity, their environmental assets tend to be unique, highly valuable, both intrinsically and financially, and irreproducible.
Although most developing regions are particularly vulnerable to changes in climate, widespread poverty, increasing population rates, and overwhelming natural resource
dependencies are likely to make Africa the region most defenseless to climate change. Even without climate change, many of the countries in Africa are already classified as water-stressed, their tropical forests and rangelands are under threat, biomass energy resources are being depleted and much of the population does not have access to adequate food, water, or sanitation services. Rural to urban migrations are on the rise and many urban areas are already feeling the strain on their inadequate infrastructure. Possible changes in the African climate due to global warming include increased incidences of vector-borne diseases, such as malaria and dengue fever, and droughts, which could make agricultural lands less productive, further increasing the trend of urbanization. In addition, many of the larger African cities and megacities, such as Lagos, are located on coastal areas, which will be more threatened by sea-level rises than inland areas. Without any financial resources and increasing pressure on its natural resource base, Africa is severely limited in terms of its ability to adapt -more so than any other region. (UN,
1997)
The Latin American countries are likely to be most threatened by changes in water availability, losses of agricultural lands, and flooding of coastal, riverine, and flatland areas. Particularly vulnerable groups in these areas include those living in the outskirts of large cities,
especially in flood-prone and unstable hillside areas. Other regions, specifically the more
temperate climates of China, Japan, Europe, and North America are likely to be most effected by the migration and or disappearance of large ecosystems, due to the shift in temperatures. Coastal loss is a significant threat, not only for island states, but also for areas with active ports - Tokyo and New York for instance. The resounding finding in much of climate change research is that the effects of climate change will be most significant in those areas in which the environment
and natural resource endowments are already under stress due to mismanagement, pollution, and unsustainable use - many of the same dilemmas that already affect urban areas.
Sustainability
Although global warming is an environmental concern, it is part of a larger array of social/environmental issues under the title of sustainability. Sustainability and sustainable development have become fashionable words in the realm of environmental protection, but their true meanings are somewhat ambiguous. The obvious interpretation of sustainability or
sustainable development is that it entails sustaining something. That 'something', however, is highly controversial. For those of us in the industrialized world, we are looking for ways to sustain our current living standards, which for many include 3 televisions, 2 VCRs, and 2 cars per household, while simultaneously finding ways to minimize the damage we inflict upon the environment through living in this manner. Our idea of increased living standards would be a newer car, a faster computer, and another trip to Honolulu. However, there are those in the so-called "South" for whom living means inhabiting a one-room mud hut with seven other family members and without any sanitary facilities, never mind running water, electricity, or television. What are they looking to sustain? This is where development comes into play. Sustainable development then must be development that minimizes this gap without sacrificing the environment in the meantime.
The most widely used definition of sustainable development is that of the Brundtland Commission, which calls it 'development that meets the needs of the present without
compromising the ability of future generations to meet their own needs' (WCED, 1987). Figure 5 illustrates this definition as it specifically relates to cities.
THE MULTIPLE GOALS OF SUSTAINABLE DEVELOPMENT As APPIED TO COIES
(MIN AND SATRTHWATE,
1994)
FIGURE
5.
MEETING THE NEEDS OF THE PRESENT....
* Economic needs - includes access to an adequate livelihood or productive assets; also economic
security when unemployed, ill, disabled or otherwise unable to secure a livelihood.
* Sociau, cutural aria neamt nees - includes a shelter which is neatiny, sate, arffordable and secure,
within a neighborhood with provision for piped water, sanitation, drainage, transport, health care,-h;]A A
loea hrma w oo - anAn tI frr •nA m
environmental hazards, including chemical pollution. Also important are needs related to people's
choice and control - including homes and neighborhoods which they value and where their social and cultural priorities are met. Shelters and services must meet the specific needs of children and of adults responsible for most child- rearing (usually women). Achieving this implies a more equitable distribution of income between nations and, in most, within nations.
* Political needs - includes freedom to participate in national and local politics and in decisions
regarding management and development of one's home and neighborhood - within a broader laitlewofk which etsuV5es iespet dfo civil aind politiual rights .aiid Ui0e iiiple•ilietat•ii ofi
environmental legislation.
....WITHOUT COMPROMISING THE ABILITY OF FUTURE GENERATIONS TO MEET THEIR OWN NEEDS
* Minimizing use or waste of non-renewable resources - includes minimizing the consumption of
fossil fuels in housing, commerce, industry and transport plus substituting renewable sources where feasible. Also, minimizing waste of scarce mineral resources (reduce use, re-use, reclaim). There are also cultural, historical and natural assets within cities that are irreplaceable and thus non-renewable
-for instance, historic distvrict oA ovire %nA naturaml lo"AndspE" which, ,,%p for plQy, recreation and access to nature.
* Sustainable use of renewable resources - cities drawing on freshwater resources at levels which
can be sustained; keeping to a sustainable ecological footprint in terms of land areas on which producers and consumers in any city draw for agricultural crops, wood products and biomass fuels.
* Wastes from cities keeping within absorptive capacity of local and global sinks - including
renewable sinks (e.g. capacity of river to break down biodegradable wastes) and non-renewable sinks (for persisienti chemicals, including greehlouse gases, stratospheiic ozoue-dpileting chelicals allnd
The definition introduces two conceptual parts of sustainability: intragenerational equity and intergenerational equity. Intragenerational equity refers to equal treatment within a
generation, meaning between the 'North' and the 'South, whereas, intergenerational equity refers to equal treatment between this generation and the next and so on. It is obvious that there is not currently intragenerational equity throughout the world. For instance, in Luanda, Angola, an urban area with a population in excess of 2 million, only 13% of the population is connected to a
sewerage system, 41% to water, and a mere 10% to electricity networks (WRI, 1998). This is a far cry from the 100% connection rates, which pervade the developed world. For some, it is difficult to discuss intergenerational concerns when there is such a colossal intragenerational divergence. This is the most pervasive reasoning behind the developing world's resistance to participate in climate change mitigation. They are fearful that it will inherently lead to
developmental sacrifices. Therefore, much of the debate over the social issues of climate change boils down to one concept - sacrifice.
Will the rich, industrialized world have to sacrifice its comfortable way of life, or will the developing countries be forced into permanent poverty? This is obviously a somewhat
simplified, exaggerated, hypothetical question, but it encompasses the fears of both the developed and developing regions. To truly address the problem of global warming though, it must first be viewed under a more optimistic light. When viewed as a fight between the
sovereignty of nations, it will never be solved. Unfortunately, this is much of what has occurred in the political forefront of climate change negotiations.
CLIMATE CHANGE POLITICS
Although scientists had been studying global warming since the 19h t century, climate change didn't surface on the international political agenda until the late 1980s. It became a "hot" topic in 1988 when, on a 980 day, United States Senator Timothy Wirth called a hearing to express his concerns over global warming. At the hearing, experts including James Hansen, then
director of NASA's Institute for Space Studies, testified as to the seriousness of the issue, saying that the world was warmer than at any time in this century and that it was 99% certain that the
cause was man-made gases and not natural variation. Hansen's stature and initiative gave credibility to the subject and led to a snowball of political actions and negotiations amongst the industrialized countries. (Anderson, 1998)
Negotiating Bodies
Negotiations officially began later that year, when the World Meteorological
Organization and the United Nations Environmental Programme formed the Intergovernmental Panel on Climate Change (IPCC). The IPCC was established in order to address the rising
concerns and questions about increasing worldwide anthropogenic emissions and their relation to the greenhouse effect. The IPCC's 1990 report, which called for more research and attention to the climate change issue, led to the establishment of the Intergovernmental Negotiating
Committee for a Framework Convention on Climate Change (INC/FCCC). The mandate of the INC/FCCC was to prepare an effective framework convention on climate change that would
provide some sort of consensus of the broad majority of participants.
CHAPTER 4
Finally, in 1992, after many negotiating sessions, the UN Framework Convention on Climate Change (FCCC) was opened for signature at the Earth Summit in Rio de Janeiro, and subsequently entered into force in 1994. Also negotiated here was the Rio Declaration on Environment and Development, which contains twenty seven principles for state and interstate behavior, including such concepts as the eradication of poverty, recognition of the special needs of developing countries, and the responsibility of states not to cause environmental damage beyond their borders. The Convention called for the founding of the Conference of the Parties (COPs), the supreme body of the FCCC, whose purpose is to implement and continuously review the Convention. The members of the COP are divided into two groups - Annex 1 (Al), which accounts for 38 developed countries and economies in transition, and Annex 2 (A2), which only includes the 25 developed countries. According to the Convention, the Al countries are
committed to adopting policies and measures aimed at returning GHG emissions to 1990 levels by the year 2000, and the A2 countries, which consist mainly of the OECD countries, are to
provide financial resources and technology transfers. Decisions as to the specifics of adoption were left up to the COPs and their annual negotiation sessions.
Kyoto Protocol
The third COP took place in Kyoto, Japan in December of 1997. The goal of this session was for the negotiators to finally agree upon a protocol containing binding emissions reductions. All countries involved went into the conference with different ideas of what was an ideal
commitment.
Although concerns over climate change had originally been brought to the Congress in 1988, the US, the world's largest emitter, was fighting the climate change battle hardest on the
domestic front. Months before the conference began, the Senate had already passed a unanimous resolution telling the president not to sign a treaty unless it would apply to all nations,
specifically some "key developing countries". The US finally went into the conference with a proposal of a reduction to 1990 levels. The Europeans, who had proposed a reduction of 15% below 1990 levels were very critical of the US's stance and exerted much pressure upon Clinton to take on a larger commitment. Japan, as host of the conference and the world's second largest energy consumer, was intent upon making the meeting a success and therefore, suggested an
intermediary proposal of 5% below 1990 levels.
The final result, the Kyoto Protocol, contains country-specific emissions reductions for the Annex 1 nations, which would aggregately lead to worldwide emissions reductions of 5.2%
below 1990 levels. The reductions incorporate six of the major greenhouse gases (CO2,
methane, nitrous oxide, hydrofluorocarbons, perfluorocarbons, and sulphur hexafluoride) and the target reduction period is 2008-2012. The specific reduction obligations are listed below in Table 6. The Protocol and its associated quantified emission limitations or reduction obligations (QELROs) will only become legally binding when at least 55 of the Annex 1 countries,
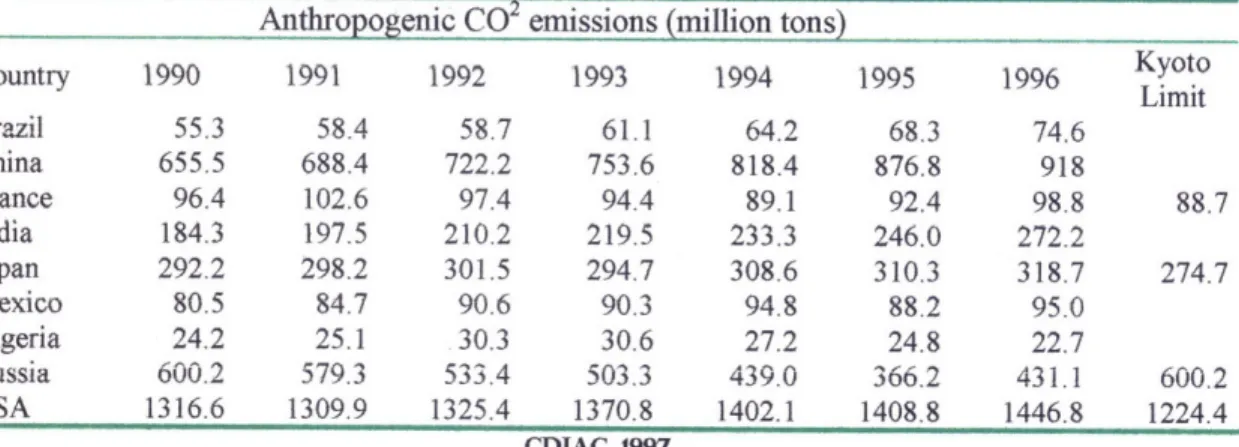
representing 55% of the developed world's emissions, have signed and ratified the document. Notably, no developing country actions are stipulated within the Protocol framework, except for potential involvement in CDM projects. Table 7 illustrates the carbon dioxide emission trends of those countries, which are home to the example megacities, including the Kyoto limits of those that are Annex 1 countries. This table is particularly indicative of the emission differences amongst the example nations, specifically between the U.S. and the rest of the world, and the divergence between the US's emission limitation and its unlimited emission trends.
TABLE 6. PARTY QUANTIFIED EMISSION LIMITATION OR REDUCTION OBLIGATION (QELRO) WITHIN KYOTO PROTOCOL
AUSTRALIA 108 AUSTRIA 92 BELGIUM 92 BULGARIA 92 CANADA 94 CROATIA 95 CZECH REPUBLIC 92 DENMARK 92 ESTONIA 92 EUROPEAN COMMUNITY 92 FINLAND 92 FRANCE 92 GERMANY 92 GREECE 92 HUNGARY 94 ICELAND 110 IRELAND 92 ITALY 92 JAPAN 94 LATVIA 92 LIECHTENSTEIN 92 LITHUANIA 92 LUXEMBOURG 92 MONACO 92 NETHERLANDS 92 NEW ZEALAND 100 NORWAY 101 POLAND 94 PORTUGAL 92 ROMANIA 92 RUSSIAN FEDERATION 100 SLOVAKIA 92 SLOVENIA 92 SPAIN 92 SWEDEN 92 SWITZERLAND 92 UKRAINE 100 UNITED KINGDOM 92 UNITED STATES 93
TABLE 7. NATIONAL CARBON DIOXIDE EMISSIONS & LIMITATIONS
Anthropogenic CO2 emissions (million tons)
Country 1990 1991 1992 1993 1994 1995 1996 Kyoto Limit Brazil 55.3 58.4 58.7 61.1 64.2 68.3 74.6 China 655.5 688.4 722.2 753.6 818.4 876.8 918 France 96.4 102.6 97.4 94.4 89.1 92.4 98.8 88.7 India 184.3 197.5 210.2 219.5 233.3 246.0 272.2 Japan 292.2 298.2 301.5 294.7 308.6 310.3 318.7 274.7 Mexico 80.5 84.7 90.6 90.3 94.8 88.2 95.0 Nigeria 24.2 25.1 30.3 30.6 27.2 24.8 22.7 Russia 600.2 579.3 533.4 503.3 439.0 366.2 431.1 600.2 USA 1316.6 1309.9 1325.4 1370.8 1402.1 1408.8 1446.8 1224.4 CDIAC, 1997
PERCENTAGE OF BASE YEAR (1990)
PERCENTAGE OF BASE YEAR (1990)
Flexibility Mechanisms
In addition to reduction variations among countries, multiple methods of reductions, which increase the flexibility of compliance, have also been approved. Emissions trading allows two countries (or companies), one above its limit, one below, to buy and sell emissions amongst each other. This mechanism was vital for the US agreement. The United States already has a successful history of emissions trading, originating from the domestic Acid Rain Program, which allows for emissions trading amongst electric utility plants. Without trading, the US would be forced to make all reductions domestically. With such a large energy production industry, this would be detrimental to the US economy. In order to provide a net decrease in emissions, trades can only be made between two regulated countries. Therefore, it only applies to Annex 1 countries. Joint implementation (JI) also yields net reductions amongst Annex 1 countries, by allowing one country to manage its emissions by paying for emissions reductions in another country. Because future emissions reductions will be least expensive in developing countries where fossil fuel usage is very inefficient, many developed countries were eager to include them in the agreement. The Clean Development Mechanism (CDM) allows for this by permitting Annex 1 countries to reduce emissions by making investments in non-Annex 1 countries.
However, in order for any of these emission management programs to function efficiently, there must be emission monitoring capabilities, and funding and enforcement procedures in place. As of yet, the infrastructure necessary to utilize these mechanisms has yet to be agreed upon and constructed. In addition, many developed and developing countries still view these mechanisms as a "way out" of domestic actions by developed nations, even though they may be more
economically efficient than domestic reductions. The European Union, for instance, in contradiction to the United States has argued that domestic measures must be taken first,
previous to the use of trading. The EU also advocates the imposition of a cap on the total amount of the quantified emissions limitation or reduction obligation (QELRO) that can be achieved internationally, rather than domestically. This conflict over domestic versus
international reductions is just one of the multitude, which has delayed action towards emissions reductions.
Many of the opponents of emissions reductions use cost as a reason for delaying action towards climate change mitigation. In analyzing President Clinton's plan to reduce greenhouse gas emissions to 1990 levels, the WEFA Group, a Philadelphia-based economic consulting firm, predicts a loss to the U.S. economy of $3.3 trillion between 2001 and 2020 accompanied by the disappearance of millions ofjobs (Srodes, 1998).
There is some degree of truth to the cost argument depending on the way in which the associated environmental policies are structured. For instance, the U.S. currently spends approximately $150 billion each year to comply with existing federal regulations, mostly based on command and control measures. This accounts for over 2% of U.S. GDP. (Palframan and Tank, 1998) However, command and control measures, such as technology or emissions standards, are not the only forms of regulatory policy. "Apart from command and control, another way to protect the environment is by trying to repair the market for environmental endowments such that the energy and innovation that markets can unleash is mobilised to conserve the environment rather than colluding in its destruction. The idea is to get people to automatically conserve the environment as a result of the signals they receive from the
marketplace" (Palframan and Tank, 1998).
Many economists have demonstrated that by incorporating flexible, economically driven policy mechanisms such as emissions trading, carbon taxes, and joint implementation into the
global warming policy mix, excessive costs may be avoided. Paul Portney, President of the Washington, D.C. based Resources for the Future, has argued that 'the cost-saving potential of incentive-based approaches compared with command and control is at least 10 percent and possibly as much as 75 percent' (Palframan and Tank, 1998).
As mentioned earlier, allowances for emissions trading between Annex 1 countries, joint implementation between Annex 2 countries, and clean development of developing countries have already been incorporated into the Kyoto Protocol. However, the means by which each nation chooses to meet its emissions limitation are solely up to that nation's own discretion. According to Portney, the available economic incentives that can be used in environmental policy include taxes, marketable permits, subsidies, liability assignment, information provision, and product return. He says that these economic incentives 'are attractive for one reason: They economize on administrative staff and information requirements' (Palframan and Tank, 1998).
Experience with Market Mechanisms
Throughout the climate change negotiations the U.S. has been a staunch advocate of the inclusion of permit trading and other economic incentive programs into the Kyoto Protocol. The
primary reason for this is that the US has achieved success with incentive-based programs, specifically in the form of a tradeable permits system for sulfur dioxide (SO2) emissions from
electric utilities. Savings from this program have been estimated at $1 to $6 billion annually, when compared to the alternative command and control approach. (Palframan and Tank, 1998) However, the success of the US sulfur dioxide permit trading scheme does not necessarily mean CO2permit trading is the only or even part of the answer to climate change.
There are several factors that made permit trading appropriate to sulfur dioxide emissions in the US that may not apply to carbon dioxide emissions worldwide. The first reason for the program's success is that S02 emissions were easily quantifiable and limited to a finite number of sources - the electric utilities. In the case of carbon dioxide, emissions do not originate within only one industrial activity, such as electricity production, but across all sectors - household, government, and industry, and from all types of sources - energy production, transportation, forestry, etc. A second differentiation between sulfur dioxide and carbon dioxide is that whereas CO2 is a global pollutant, SO2 is more regional and its effects are less widespread. For example,
sulfur dioxide emissions in the Midwestern United States may lead to acid rain in New England, but not Bangladesh. Therefore, a reduction of sulfur dioxide emissions within the US was expected to lead to air quality benefits within the US. A third component that makes trading of the two pollutants different is national sovereignty. Inasmuch as the SO2 program led to conflict
and called for cooperation amongst the States, the US government was still the sole decision-maker in its development and implementation. On the other hand, in order to generate carbon dioxide reductions, all nations must be involved in the process and find ways to cooperate. In this case, there is no single government body, which yields the power to implement and enforce the way that the US government could over the electric utilities within its borders. Still, these are not reasons for the dismissal of permit trading as an option, just an indication of the difficult nature of the problem.
Buenos Aires Plan of Action
The fourth COP took place in November of 1998 in Buenos Aires, Argentina. The purpose of the meeting was to iron out the issues left ambiguous by the Kyoto Protocol. After
two weeks of negotiations, the outcomes were deadlines set at late 2000 for adopting rules and regulations necessary for implementation of the flexibility mechanisms of the Protocol - Permit Trading, Joint Implementation, and the Clean Development Mechanism. What may be even more important than this Plan of Action, however, are the events, which took place during the conference.
Before many issues were even addressed, the US and Argentina both took serious political actions. Argentina, as host of the conference parted ways with the other developing countries, known as G77/China, by offering to take on voluntary commitments at COP5 in Amman, Jordan. Kazakhstan soon followed suit by also vowing to take on a binding reduction commitment. The US also took a stand when the Clinton Administration signed the Kyoto Protocol, without the support of the Congress.
Throughout the conference, the negotiators continued to air their concerns over voluntary commitments by non Annex 1 countries, financial mechanisms and funding related to the Clean Development Mechanism, and the transfer of clean technologies from the developed world to the developing. The European Union, along with many developing countries continued to insist that emissions trading caps, which limit the amount of a nation's QELRO that can be attained
through permit trading and other mechanisms, be established. They view the US's adherence to permit trading as an indication of a lack of long-term commitment to reducing GHGs at home. However, advocates of a permit trading system have asserted the fact that, when viewed from an
Outstanding Issues
Although many important issues were addressed and commitments made in Argentina, the plan of action, when boiled down, represents nothing more than another imposed deadline. The fate of the Kyoto Protocol still ultimately hinges upon a number of issues including
implementation, enforcement, and fees, which up until now have failed to be agreed upon. The most important of which is the fact that the deadline for reductions (2008-2012) is fast
approaching. Continued delays and negotiations coupled with increasing emissions only work to make the inevitably necessary reductions more expensive and difficult to implement. The US Department of Energy estimates that, if nothing is done, emissions will be more than 30 percent above 1990 levels by the year 2010 (Anderson, Morgenstern, and Toman, 1999).
Another undressed, yet significant concern is that for the need of the international institutions, which will measure, monitor, and verify claimed emissions reductions. The existence of so-called "hot air", which represents unused emissions from countries such as the former Soviet Union, who currently emit less than in 1990, has also led to much debate. On the one hand, is the US, as a buyer of emissions permits, likely to pay Russia for its formerly
untamed emissions? On the other, is this even a sound proposal? In aggregate economic terms it is; by buying Russia's unused emissions, the US may incur lower costs than it would
domestically. In addition, the Protocol calls for a share of the CDM proceeds to be donated to those countries most vulnerable to climate change. The size, mechanics, or bearers of this fee are still undecided. The CDM is also vague on the terms for making qualified reductions and their applicability to national quotas. And maybe most important, how will reductions be enforced, and what are the penalties for non-compliance?
Even if the issues of implementation, enforcement, and governance were to be resolved the Kyoto Protocol is not a long-term strategy. It only represents a first round attack on climate change. Developing country emissions are on the rise and expected to supercede those of the developed world in less than a decade. If this is the case, in order to prevent climate change, they must be included within any long-term emissions reduction strategy. How this will occur, and how the Protocol will be reviewed and adjusted over time are also uncertain.
A
DIVERSITY OF INTERESTS
Because greenhouse gases and climate changes cross international borders, lack distributional equality, and have the potential to cause extensive environmental and economic damage, many people have been led to associate climate change policy with a loss of national
sovereignty and the potential for economic ruin. Around the world, radical environmentalists are predicting an ecological apocalypse, whereas right-wing conservatives predict an economic one. Radical views have led many to fear both action and inaction on the political front. Scientific uncertainties have been used by different groups as both reasons for and against political,
specifically international, actions. Many governmental and non-governmental groups maintain vested interests in the outcome of any political agreement, specifically in terms of natural resource and capital commitments. Because of this, debates between industrialized and lesser-developed countries, conservative and liberal think tanks, and democrats and republicans persist over what, if anything should be done to mitigate climate change. Within all the chaos, there are
specific drivers behind each viewpoint. Some are historical and/or cultural, others strategic. Specifically missing from the debate, however, have been the interests of urban areas. Because of this, this chapter does not explicitly address their concerns. However, chapter 7 will identify and analyze those issues and concerns, which should be of primary interest to cities in the climate change debate.
Domestic Concerns
The European Union (as a whole) and the United States are the two largest members of the Annex 1 group of nations under the Framework Convention - using either economic or