HAL Id: hal-02182467
https://hal.archives-ouvertes.fr/hal-02182467
Submitted on 12 Jul 2019
HAL is a multi-disciplinary open access
archive for the deposit and dissemination of
sci-entific research documents, whether they are
pub-lished or not. The documents may come from
teaching and research institutions in France or
abroad, or from public or private research centers.
L’archive ouverte pluridisciplinaire HAL, est
destinée au dépôt et à la diffusion de documents
scientifiques de niveau recherche, publiés ou non,
émanant des établissements d’enseignement et de
recherche français ou étrangers, des laboratoires
publics ou privés.
Partial discharge risk under space charges generation
and transport effects
Mallys Banda, David Malec, Jean-Pascal Cambronne
To cite this version:
Mallys Banda, David Malec, Jean-Pascal Cambronne. Partial discharge risk under space charges
gen-eration and transport effects. Comsol International Conference, Lausanne 2018, Oct 2018, Lausanne,
France. �hal-02182467�
Partial discharge risk under space charges generation and transport
effects
M. E. Banda*, D. Malec, Jean-Pascal Cambronne
LAPLACE, Université de Toulouse, CNRS, INPT, UPS, France
118 Route de Narbonne, 61062, Toulouse Cedex 9
*banda@laplace.univ-tlse.fr
Abstract –
Based on a topological model from power
busbars designed for hybrid aircraft propulsion,
simulations of partial discharges risks induced by space
charge accumulation in PTFE has been developed under
Comsol Multiphysics® (CM) through a bipolar model of
charge generation and transport. The model was
implemented by using the General Form PDE of
Mathematics modules. The simulation results were
focused on the risk of partial discharges appearance in air
surrounding the busbars. Both space charge generation
and transport mechanisms within PTFE busbar solid
insulators, show a significant impact of the nature, the
quantity and the space-time distribution of accumulated
charges on partial discharges inception in air.
Key words: Partial discharges, Busbars, Space charge, PTFE, Hybrid propulsion.
1. Introduction
Due to its good electrical, thermal, mechanical and chemical properties, PTFE is widely used in electrical insulation of both energy transport devices and power electronic systems. However, under both electrical (HVDC) and environmental (thermal cycle, humidity, pressure, ...) operating constraints, the increase of confinement requirements and power densities, these insulators can accumulate charges in their bulk. These ‘space charges’ could modify the local distribution of the electric field within them [1]. These initial charges could come as well from bulk impurities (chemical traps, ions) as surface ones (roughness, moisture, metal particles, microcavities…). These various conditions can increase DP activities and irreversibly damage the insulation systems, even at short-time [2-3].
In particular case of power converters intended for the future hybrid and electric aircrafts propulsion, power busbars can be insulated with PTFE films. But it is well established that power electronics converters are also the main factors responsible of power increase within these devices [4]. So, although PTFE is known for its superior charge-storage capabilities because of its chemical backbone [(CF2-CF2)n] made of carbon tightly
bonded by fluorine atoms in semi-crystalline structure [5-6], it can accumulate charges during operation that can impact the electrical field at the sensitive interfaces of the device. In many cases, the triple points (PTFE/Air/busbars) are most electrically exposed to partial discharges and then contribute to
premature degradation with time of insulator. For all these reason, study of charge generation and transport mechanisms operating in such dielectrics contributes to a better prediction of their ageing and prevent them from discharge phenomenon. Through a mathematical model previously validated with charged LDPE films measurements [7], this study aims to simulate the behaviour of a charged PTFE film sandwiched between two laminated power busbars in regard of partial discharge risks at triple points.
2. Materials and Model
3.1. From power converters to studied dielectrics
This study was based on the converter topology shown in figure 1 and performed by [8]. It consists in seven busbars slats (2 mm-thick) mounted between input bus capacitors, supplied by a DC 2.5 kV input voltage, and flying output capacitors. Insulating PTFE films are sandwiched between each busbars pairs. The simulation is focused on the most stressed triple point in busbars/PTFE/air interfaces (zoomed in) since it is most exposed to partial discharges risks.
Figure 1. Overview of power busbars embedded inside a power electronics converter designed for hybrid aircraft propulsion.
A 2D-model geometry was implemented to apply the meshing conditions as illustrated in figure 2. x-position represents the thickness and y-position the length of materials. Compared to the zoomed in configuration shown in figure 1, the cooper electrode geometry was curved to prevent an electric field strengthening. All geometry domains were previously sized with normal fluid dynamics meshing. Then, boundaries layers were added to dielectrics to increase the accuracy of injection and extraction fluxes at dielectrics interfaces. Also, refinement was
applied around PTFE/conductors boundaries and at air confinement areas. All meshing was completed in 162 k domain elements and ~4 k boundary elements.
Figure 2. Finite elements meshing of the total studied geometry. Neumann’s limit conditions were applied at both external air domain boundaries and dielectrics/conductors interfaces. Dirichlet’s limit conditions were applied on electrodes.
3.2. Generation and transport model
The model simulated in this study is based on a bipolar electrical conduction (electrons and holes), including charges trapping, detrapping and recombination between mobile and trapped species [9-10], such as schematized in figure 3.
Figure 3. Description of electronics conduction model applied to PTFE dielectrics. Taking into account injection, trapping, detrapping and recombination between all charge species.
Charges generation was taken into account through two fluxes of negative (electrons) and positive (holes) injection at dielectrics/conductors interfaces modelled by modified Schottky law, given by:
Je,h(x,t)= AT2exp − φei kBT ⎛ ⎝⎜ ⎞ ⎠⎟ exp q kBT ⎛ ⎝⎜ ⎞ ⎠⎟ qE(x,t) 4πε −1 ⎡ ⎣ ⎢ ⎢ ⎤ ⎦ ⎥ ⎥ (1)
Where A is the Richardson’s constant and φei and
φ
hi areSchottky’s injection barrier for PTFE.
Others generation mechanisms induced by the other processes are directly taken into account inside source terms of each
charge carriers. In the case of mobile electrons, the source term is modelled by: seµ(x,t)= −Be⋅ neµ 1− net N0.et ⎛ ⎝⎜ ⎞ ⎠⎟ trapping !###"###$ + net⋅
ν
exp −φ
tre kBT ⎛ ⎝⎜ ⎞ ⎠⎟ detrapping !###"###$ − S1⋅ neµ⋅ nht− S3⋅ neµ⋅ nhµ recombination %####&####' (2)With neµ, net, nhµ, nht, [C.m-3] the charge densities for mobile electrons, trapped electrons, mobile holes and trapped holes, respectively.
Charge transport is mainly governed by the set of these three equations:
• Transport equation, giving the instantaneous current density of each transported species, when diffusion is neglected: ) , ( ) , ( ) , ( ) , ( , , , xt n xt E t E xt jeh = eh ⋅
µ
eh ⋅ (3)• Continuity equation, solved for each carrier type:
) , ( ) , ( ) , ( , , t x s x t x j t t x n i h e h e = ∂ ∂ + ∂ ∂ (4)
• Poisson equation, expressing the total distribution of electric field, as a function of net charge density:
ε
ρ
( , ) ) , ( xt x t x E = ∂ ∂ (5)With for the three equations (3-4-5), Je,h[A.m-2] the current
flux of carriers, ne,h[C.m-3] the charge density of each carrier, µe,h[m
2.V-1.s-1] the free carriers mobility, E[V.m-1] the
electric field, Si[A.m-3] the source term which takes into
account all physical phenomena other than those related to the transport: trapping, detrapping, recombination,
ρ
[C.m-3] is the net charge density given by algebraic sum of all carrier densities :ρ
= n
eµ+ n
et+ n
hµ+ n
ht (6)Free carriers transport (mobile electrons and holes) was considered through a hopping mobility, as a function of electric field and temperature, such as:
⎟⎟ ⎠ ⎞ ⎜⎜ ⎝ ⎛ ⎥ ⎦ ⎤ ⎢ ⎣ ⎡ ⎟⎟ ⎠ ⎞ ⎜⎜ ⎝ ⎛ − = T k t x E q T k t x E t E µ B B a 2 ) , ( sinh exp ) , ( 2 ) , (
λν
φ
λ
(7)Where
λ
[m] is the inter-traps distance, ν[s-1] the escapefrequency of trapped carriers set to
k
BT / h
[s-1] at room temperatureT
,k
B[J.KPlank constants, respectively;
φ
a[eV] is the hopping potentialbarrier coefficient and
q
[C] the elementary charge. 3.3. Model parameters choiceThe model parameters used for all simulations are given in table 1. Most of them have been adapted from literature, based on pears experimental measurements already performed on PTFE films [11-14].
As for other solid insulators, various situations happen after voltage application on PTFE. By taking into account quantum chemical calculation to estimate the injection barrier reduction in PTFE [11] and since the holes in PTFE have a significantly higher mobility than the electrons [12-13], the hole injection barrier was considered much higher than that of LDPE. The deep trap densities for holes and electrons were acquired from measurements of the density of trapping centers as a function of its energy level for PTFE samples [13]. One trap level was considered for holes and electrons. The recombination coefficients are from Langevin type, as a function of free charges mobility. Other parameters were directly taken from [14].
Table 1. All model parameters simulated in this study.
Parameter [unit] Value
Relative permittivity:
ε
r 2Mobility [m2.V-1.s-1] Function of electric field
Trapping coefficient [s-1]
Electrons: Be
Holes: Bh
6.78×10⁻⁴
7.36×10⁻⁴
Detrapping barrier [eV]
Electrons:
φ
tre 1.17Holes:
φ
trh 1.27Schottky injection barrier [eV]
For electrons:
φ
ei 1.35For holes:
φ
hi 1.2Deep trap density [C.m-3]
Electrons: N0.et
Holes: N0.ht
290.9 290.9
Recombination coef. [C.m-3.s-1] function of mobility
Hopping barrier for mobility[eV]
Electrons:
φ
a,e 0.795Holes:
h a,
φ 0.772
3.4. Implementation under Comsol Multiphysics®
The coupled set of model equations was implemented through CM mathematics modules. All equations are inserted step by step inside general-PDE modules before to apply all limit conditions. A Poisson-Equation module (poeq) is used to solve electric field from net charge density and four Convection-Diffusion-Equation modules (cdeq) are used to solve continuity equations for each charge species. Natural and
artificial diffusion were added since mathematics modules would not automatically integrate it.
Firstly, the computation begins by initialization of all model variables and parameters. Then, all limit conditions are applied and knowing initial charge density for each carrier, the net charge density is computed. From net charge density, the electric field is evaluated by solving Poisson’s equation (5) through ‘poeq’ module. In second, the charge mobilities and recombination coefficients are calculated as a function of electric field, according to equation (7). Next, default MUMPS solver computes, in segregated mode, the optimal time-step to solve transport (3) and continuity equation (4) for each charge species through ‘cdeq’ modules. In last, solvers compute once again all equation sets for next calculation step and so on.
4. Simulation results and discussion
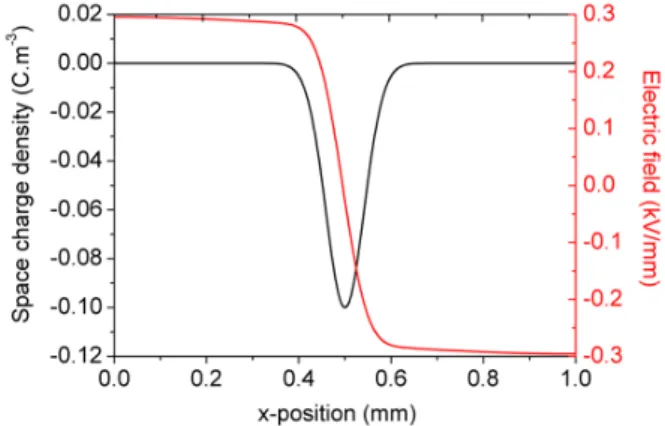
The main results of this study are based on the electric field behaviour at triple point in regard of charge generation and transport phenomenon occurring inside dielectrics bulk under a DC electric field. These triple points are the most exposed area at partial discharge inception because of lower permittivity of air and due to confinement environment between these three materials (conductor/dielectrics/air). Firstly, we consider a charged PTFE film with an initial mobile electrons density. In these conditions, the internal electric field is not null inside dielectrics before electric potential application. The implanted charge density added and its associated electric field are plotted in figure 4.
Figure 4. Initial charge density and its associated electric field distribution as a function of x-position within dielectrics.
If there is no applied electric field (figure 5a), the electric potential shows a symmetrical behaviour in both triple points positioned at (0, 1) and (1, 1). As soon as the DC 2.5 kV electric potential was applied, we observe a non-symetrical distribution of potential at each triple point. The resulting electric potential, obtained after 60 min of simulation, is shown in figure 5b. Under the effect of both charges generation and transport mechanisms, the simulation of electric field was performed for four hours. For each hour, by step of 60 minutes, a cartography was extracted and post-treated. Figure 6 presents these cartographies of simulated electric field distribution for 60, 120, 180 and 240 minutes.
(a)
(b)
Figure 5. Electric potential cartographies. (a) Short-circuited conditions, with only potential due to initial mobile electrons (cf. figure 4); (b) electric potential after 60 min under application of a DC 2.5 kV electric potential. Simulation parameters from table 1.
Whatever the considered simulation time, the electric field is not uniform in the dielectric bulk and remains invariable with time. The charges previously implanted in the volume of the dielectric impact the electric field distribution within dielectric, on either side of the implantation area (figure 4).
(a)
(b)
(c)
(d)
Figure 6. Cartographies of simulated electric field. (a) t = 60 min, (b) t = 120 min, (c) t = 180 min, (d) t = 240 min. Simulation parameters from table 1.
At t = 60 min, the absolute value of the simulated electric field is around 5.56 kV/mm at triple point positioned at the cathode and 4.82 kV/mm at the one positioned at anode. As time increases, the electric field increases within the triple point positioned at the cathode and decreases in the one at the anode. This difference is remarkable between 60 min and 240 min, where the electric field grows by only 4% at the triple point positioned at the cathode while it decreases by 72% at the triple point positioned at the anode.
After DC voltage application, the simulated electric field shows a rapid decrease of the influence of initial charges. After 1 hour, the electric field at both triple points appear to be higher than the partial discharges inception voltage in air (>3 kV/mm)
[15]. Although other physico-chemical considerations should also be met to activate electronic priming processes for partial discharges in air [16], it appears that the modelled charge injection mechanism is not yet important in the short term (<1h) to generate a sufficient quantity of homocharges at the PTFE/conductor interfaces.
Looking closely at the net charge densities associated with the electric field distributions shown in Figure 7 (i.e.: net fluxes of mobile and trapped charges injected at the electrodes), it can be seen that the net charge density is negative at the cathode whereas it is positive at the anode.
(a)
(b)
Figure 7. Net charge densities as a function of x-position within PTFE film in y = 1 mm (i.e.: at triple points level). (a) Negative charges arising from cathode electrode; (b) Positive charges arising from anode electrode. Simulation parameters from table 1.
This implies that more holes are injected/trapped at the anode and the injected/trapped electrons are dominant at the cathode. The electrons distribution is extended over approximately 10 µm while the holes distribution is extended over 2 µm. Quantitatively, the holes density injected from the anode, and trapped near the surface of the dielectric, is thirty times greater than electrons injected and trapped at the cathode. However, the charge density increases with time for both electrons and holes; with 400% of total increase in charge density between 60 and 240 minutes.
Beyond 180 minutes, simulations seem to confirm the hypothesis of a very weak electron injection within the PTFE, for the electric field considered. The significant decrease of the electric field within the triple point positioned at the anode would confirm a progressive accumulation of holes injected at the anode. These positive charges, of the same sign as the applied voltage, form a homocharges area which will promote a reduction of the electric field at the PTFE/conductor interfaces. On the other hand, a very weak injection of negative charges at the cathode does not induce the creation of a large zone of negative homocharges. De facto, the electric field is less affected at the cathode triple point. These observations are in agreement with experimental ones that measure a larger injection of holes than electrons in PTFE films [11, 14], even for a highest DC electric field.
Moreover, when we go through the dielectric/conductive interface, along the lines y = 0 and y = 1 corresponding to the cathode/dielectric interface and dielectric/anode interface, respectively; we note a similar behaviour of the charges near to the both triple points. Figure 8 shows the net charge
densities at each interface as a function of the proximity of the triple point.
The charges density increases (in absolute value) with time, along both interfaces. More spectacular, the closer to the triple point on both sides of the dielectric, the more the net charge density. This increase is quantitatively more remarkable in y=1 where the holes dominate. The simulated model has the advantage to help to distinguish the types of charges responsible of generation and transport phenomenon. In this case, it would seem that the electrode injection mechanism is the predominant mechanism over other charge generation mechanisms (including detrapping and recombination).
(a)
(b)
Figure 8. Net charge densities as a function of y-position along PTFE/electrodes interfaces, for 4 hours of simulation time. (a) x = 0 mm, PTFE/cathode interface; (b) x = 1 mm, PTFE/anode interface. Simulation parameters from table 1.
The increase of injection activity at the triple points could explain the increase of the electric field in the air at these sensitive points. As long as the injected homocharges are immediately trapped near the interfaces, this modify the electric field distribution in the air at the triple points and thus partial discharge risks. PTFE being a material with a very weak charges mobility (~10-16 m2/V/s), compare to LDPE for
example (~10-13 m2/V/s) [12-14], a large part of the injected charges is trapped near the interfaces and impact electric field behaviour in air at triple points and, in the charge extraction case, increase discharge risks due to heterocharges. This behaviour could be explained in part by the higher PTFE detrapping barriers because of its large energy gap between its fermi level and its conduction band [11].
Conclusion
Overall, the charge state of the material would impact the electric field in the air, at triple points. The simulated model shows a preponderance of generation phenomena dominated by the injection at electrodes with very weak extraction fluxes. This injection is more intense near to the triple points and shows a ratio of thirty between the injection of the holes at the anode and the one of electrons at the cathode. This significantly impacts the electric field at the triple point close to the anode. As a result, in the presence of a large accumulation of homocharges at this electrode, the risk of partial discharges is reduced to this triple point than the one exposed to the low electron injection at the cathode. The initially implanted charges within the dielectric do not seem to significantly impact the applied electric field since the electric field they
induce is around ten times lower than the applied electric field. Furthermore, due to the very low mobility of the charges within the PTFE, no important charge transport activity, able to significantly disturb the electric field, is observed in the dielectric bulk, meaning that accumulated charges are difficult to extract. These ones remain deeply trapped near to interfaces. To be complete, this simulation study will be very soon confronted with experimental measurements in order to confirm these observations. Similarly, in application of the future operating conditions of these power busbars intended to hybrid/electrical aircraft, taking into account the propulsion environment and fly conditions would be more suitable.
References
[1] Montanari, G. C., & Morshuis, P. H. F. (2005) Space charge phenomenology in polymeric insulating materials. IEEE Transactions on dielectrics and electrical Insulation, 12, 754-767.
[2] Tanaka, T. (1986) Internal partial discharge and material degradation. IEEE Transactions on Electrical Insulation, 6, 899-905.
[3] Gao, Y., Chen, L. Y., Zhang, L. M., Huang, S. H., Du, B. X., & Wang, F. (2015) PD characteristics in PTFE insulated tubular busbar models measured with HFCT and acoustic sensor. In (ICPADM), 2015 IEEE International Conference on Properties and Applications of Dielectric Materials, 736-739.
[4] Fabiani, D., & Montanari, G. C. (2001) The effect of voltage distortion on ageing acceleration of insulation systems under partial discharge activity. IEEE Electrical Insulation Magazine, 17, 24-33.
[5] Dhanumalayan, E., & Joshi, G. M. (2018) Performance properties and applications of polytetrafluoroethylene (PTFE)—a review. Advanced Composites and Hybrid Materials, 1-22.
[6] Sessler, G. M. (1997) Charge distribution and transport in polymers. IEEE transactions on dielectrics and electrical insulation, 4 614-628.
[7] Banda, M. E., Griseri, V., Teyssèdre G. and Le Roy S. (2018) Modelling Charge Generation and Transport in Low Density Polyethylene Irradiated by an Electron-Beam. IEEE International Conference on Dielectrics, Budapest 1-5 July 2018.
[8] Erroui, N., Gateau, G., and Roux, N. (2018) Continuous-caliber semiconductor components. IEEE International Conference on Industrial Technology, 658-663.
[9] Alison J M and Hill R M. (1994) A model for bipolar charge transport, trapping and recombination in degassed crosslinked polyethene J. Phys. D: Appl. Phys. 27 1291-99. [10] Le Roy S, Segur P, Teyssedre G and Laurent C. (2003) Description of bipolar charge transport in polyethylene using a fluid model with a constant mobility: model prediction J. Phys. D: Appl. Phys. 37 298-305.
[11] Wang, W., Takada, T., Tanaka, Y., & Li, S. (2017) Space charge mechanism of polyethylene and polytetrafluoroethylene by electrode/dielectrics interface study using quantum chemical method. IEEE Transactions on Dielectrics and Electrical Insulation, 24, 2599-2606. [12] Seki, K., Tanaka, H., Ohta, T., Aoki, Y., Imamura, A.,
structure of poly (tetrafluoroethylene) studied by UPS, VUV absorption, and band calculations. Phys. Scri. 41, 167.
[13] Zhang, G. J., Yang, K., Zhao, W. B., & Yan, Z. (2006) On the surface trapping parameters of polytetrafluoroethylene block. Appl. Surf. Sci. 253, 1995-1998.
[14] Min, D., Cho, M., Li, S., & Khan, A. R. (2012) Charge transport properties of insulators revealed by surface potential decay experiment and bipolar charge transport model with genetic algorithm. IEEE Transactions on Dielectrics and Electrical Insulation. 19.
[15] Bilodeau, T. M., Dunbar, W. G. and Sarjeant, W. J. (1989) High-voltage and partial dis-charge testing techniques for space power systems. IEEE Electrical Insulation Magazine, 5, 12-21.
[16] Niemeyer, L. (1995) A generalized approach to partial discharge modeling. IEEE transactions on Dielectrics and Electrical insulation, 2, 510-528.
Acknowledgements
This project has received funding from the Clean Sky 2 Joint Undertaking under the European Union’s Horizon 2020 research and innovation program under grant agreement No: