HAL Id: halshs-02800958
https://halshs.archives-ouvertes.fr/halshs-02800958
Preprint submitted on 5 Jun 2020
HAL is a multi-disciplinary open access archive for the deposit and dissemination of sci-entific research documents, whether they are pub-lished or not. The documents may come from teaching and research institutions in France or abroad, or from public or private research centers.
L’archive ouverte pluridisciplinaire HAL, est destinée au dépôt et à la diffusion de documents scientifiques de niveau recherche, publiés ou non, émanant des établissements d’enseignement et de recherche français ou étrangers, des laboratoires publics ou privés.
Pauvreté, Egalité, Mortalité: mortality (in)equality in
France and the United States
Janet Currie, Hannes Schwandt, Josselin Thuilliez
To cite this version:
Janet Currie, Hannes Schwandt, Josselin Thuilliez. Pauvreté, Egalité, Mortalité: mortality (in)equality in France and the United States: NBER Working Paper No. 24623. 2018. �halshs-02800958�
NBER WORKING PAPER SERIES
PAUVRETÉ, EGALITÉ, MORTALITÉ:
MORTALITY (IN)EQUALITY IN FRANCE AND THE UNITED STATES Janet Currie
Hannes Schwandt Josselin Thuilliez Working Paper 24623
http://www.nber.org/papers/w24623
NATIONAL BUREAU OF ECONOMIC RESEARCH 1050 Massachusetts Avenue
Cambridge, MA 02138 May 2018
We thank the Center for Health and Wellbeing at Princeton University for supporting this
research and CépiDc for providing the data used in this analysis. Josselin Thuilliez benefited from
a research fellowship at Princeton University and a Fulbright fellowship (2016–2017). We are
also thankful to Magali Barbieri, Pierre-Yves Geoffard, and Jean-Paul Moatti for useful
comments. The views expressed herein are those of the authors and do not necessarily reflect the
views of the National Bureau of Economic Research.
NBER working papers are circulated for discussion and comment purposes. They have not been peer-reviewed or been subject to the review by the NBER Board of Directors that accompanies
official NBER publications.
Pauvreté, Egalité, Mortalité: Mortality (In)Equality in France and the United States Janet Currie, Hannes Schwandt, and Josselin Thuilliez
NBER Working Paper No. 24623 May 2018
JEL No. I14,J1
ABSTRACT
We develop a method to compare levels and trends in inequality in mortality in the United States and France in a similar framework. The comparison shows that while income inequality has
increased in both the United States and France, inequality in mortality in France remained
remarkably low and stable. In the United States, inequality in mortality increased for older
groups (especially women) while it decreased for children and young adults. These patterns
highlight the fact that despite the strong cross-sectional relationship between income and health,
there is no necessary connection between changes in income inequality and changes in health
inequality. Janet Currie
Department of Economics Center for Health and Wellbeing 185A Julis Romo Rabinowitz Building Princeton University Princeton, NJ 08544 and NBER jcurrie@princeton.edu Hannes Schwandt University of Zurich Department of Economics Schönberggasse 1 8001 Zürich, CH and CEPR hannes.schwandt@uzh.ch Josselin Thuilliez
Centre National de la Recherche Scientifique Centre d’économie de la Sorbonne,
75013 Paris, France
1 Introduction
In recent years, several highly publicized studies have analyzed changes in inequality in life expectancy and mortality, sparking broad public debate in the United States (Deaton 2002; Ezzati et al. 2008; Cutler et al 2011; Pijoan-Mas and Rios-Rull 2014; Chetty et al. 2016; Currie and Schwandt 2016a,b; Shiels et al. 2017). These studies show that mortality at older ages decreased more among the rich than among the poor over the past twenty years, indicating a widening of the mortality gap between the rich and the poor. A particularly worrisome development has been documented for non-Hispanic whites in the United States, who experienced increases in mortality at middle ages (Shiels et al. 2017; Case and Deaton 2015, 2017). Two recent studies by Currie and Schwandt (2016a,b) extended the analysis to younger ages, finding more positive developments for infants, children and adolescents. In these age groups, mortality improvements were particularly pronounced among the poor, leading to a sharp decline in mortality and a reduction in inequality in mortality at younger ages.
There is a long tradition of research on economic inequality and inequality in mortality in France (Desplanques 1984; Piketty et al 2006; Barbieri 2014; Baron 2016), but this research has been underrepresented in the current debate, perhaps due to differences in methodology that make it difficult to directly compare developments in France and the United States. Cross-sectional analyses confirm that there is a positive relationship between socioeconomic status and health in France, just as there is in the United States. (Hollande 2016; Heritage 2009), which in turn may reflect a positive relationship between socioeconomic status and health-seeking behaviors (Jusot, Or, and Sirven 2012).
Our focus is on the evolution of inequality in mortality by age in France and the United States, and we aim to measure it in a way that allows comparisons between the two countries. This comparison is of interest in part because the health care systems in the two countries are
often contrasted. The so called “French model”—with its principle of equal access to care and its funding methods— aims to promote equality of access to health care among citizens (Nay et al. 2016). In 2000, (before the recent Affordable Care Act, sometimes known as “Obamacare”), the French health care system was regarded by the World Health Organization as one of the best health care systems in the world, while the United States ranked only 54th in the World Health Report 2000 (World Health Organization, 2000).
We use mortality register data from France and vital statistics mortality data from the United States to analyze trends in inequality in age-specific mortality rates over the past 20 years. In France, we focus on mortality trends in groups of départements, where
départements are first ranked by their poverty rates and then divided into 20 groups each
representing 5% of the French population. These départements groups are ranked by their poverty rates so that we can consistently compare mortality in the lowest and highest ranked slices of the population. Similarly, for the United States we first rank counties using poverty rates and then group them into ventiles so that we can compare mortality trends in the richest and poorest places. By comparing trends in mortality inequality in France and the United States over time using the same methods and similar data for both countries, we hope to shed light on cross-national differences in the evolution of inequality in mortality.
We find that while income inequality has increased in both the United States and France, inequality in mortality in France remained remarkably low and stable. In the United States, inequality in mortality increased for older groups (especially women) while it decreased for children and young adults. These patterns highlight the fact that despite the strong cross-sectional relationship between income and health, there is no necessary connection between changes in income inequality and changes in health inequality. In other words, it may be possible to effectively use public policy to buffer the effects of income inequality on health.
A further analysis of differences in the effects of leading causes of death in the two countries indicates that there is no one cause of death that is a “smoking gun” that would explain the large differences in mortality across all age groups. However, two causes stand out as particularly important. For younger groups, differences in deaths due to accidents account for over a third of the gap in mortality between the two countries. For older groups— where most mortality is concentrated— we find that applying French mortality rates for heart disease to the U.S. data would have dramatic effects. For example, it would close the gap in death rates between French and American elderly men in the poorest places and would result in lower than actual death rates in the richest U.S. places. In contrast, despite their
prominence in the literature on U.S. mortality rates, differences in “deaths of despair” (deaths from suicide, homicide, drug overdoses, and alcohol-related causes) have relatively little impact on the U.S.-French mortality gap. For cancer, French male death rates are higher than those in the United States, especially in lower poverty areas, so that if American men had the French cancer death rate, American mortality rates would actually increase.
The paper proceeds as follows: Section 2 describes some of the background literature. Section 3 describes the data and the methods. Section 4 displays descriptive statistics and our main results regarding the comparison between France and the United States. Section 5 simulates U.S. mortality rates in 1990 and 2010, assuming the 2010 French rates for selected causes and age groups in order to focus on specific reasons for the differences between the two countries. Finally, Section 6 summarizes our conclusions and highlights avenues for future research.
2. Background
According to the U.S. National Academy (National Academies of Science, Engineering, and Medicine (NAS) 2015), there are three ways to measure inequality in mortality: “One
looks at differences in the mortality of populations of U.S. counties in relation to county-level economic measures. Another looks at mortality by educational attainment. A third approach looks at mortality by career earnings.”
Many U.S. studies divide the population by level of education (Pappas et al. (1993); Elo and Preston (1996); Preston and Elo (1995); Olshansky et al. (2012); Meara et al. (2008); Cutler et al. (2011); Montez and Berman (2014); and Montez and Zajacova (2013)), although the share of the population with high school or college education has increased dramatically over time (Dowd and Hamoudi 2014; Hendi, 2015; Bound et al., 2014; Godring et al., 2015). If those who would have been expected to have less education in 1990 have moved into higher education categories by 2010, then it would not be surprising if the remaining high school dropouts proved less healthy in 2010.
Using education as the main measure of socioeconomic status has also been popular in France (Leclerc et al. 2006; Menvielle et al. 2007; Menvielle et al. 2008; Saurel-Cubizolles et al. 2009). However, just as in the United States, strong increases in educational attainment in France over the period we examine mean that in younger cohorts, the less educated are a smaller and more negatively selected group than in previous cohorts. This type of selection could lead to a measured increase in mortality inequality even if the distribution of relative mortality risk across the population remained constant.
French studies have also examined the relationship between individual occupational changes and mortality (Cambois 2004) though causality could run both ways in explaining this association. Other studies have investigated the relationship between economic inequality and mortality across different European countries with somewhat inconclusive results (Leigh and Jencks 2007; Mackenbach et al. 2008; Strand et al. 2010; Wood et al. 2012; Mackenbach et al. 2016). One general challenge of these studies is that they typically rank individuals by socioeconomic indicators, such as educational attainment, that are difficult to compare across
countries. A high school dropout, for example, might be much more negatively selected in Norway than in Bulgaria where a larger share of the population does not complete high school. As a consequence, the mortality gap between high school dropouts and more educated groups would be expected to be much larger in Norway than in Bulgaria, everything else being equal. Our method is not subject to these concerns, as we are comparing the same percentiles of the population in each country.
The closest equivalent in the United States may be studies that focus on inequality in mortality by relative income (NRC 2015; Pappas et al. 1993; Waldron 2007; Waldron 2013; Bosworth and Burke 2014; Pijoan-Mas and Rios-Rull, 2014). However, low income could be caused by ill health rather than the reverse (Smith 1999, 2005, 2007).
Finally, one can pursue the strategy we use here and examine mortality by geographical areas. Selective migration is a possible concern. For example, if the healthiest people in a declining area leave, then the average health of the area may decline even if the health of all individuals remains the same. Some previous studies following this geographical approach have not accounted for selective migration (for example, Wilmoth et al. 2011; Kulkarni et al. 2011; Wang et al. 2013; Murray et al. 2006). Sing and Siahpush (2006) confront this problem by dividing U.S. counties into groups based on an index of the socioeconomic status of the population in 1980 and following these same county groups up to 2000— a strategy that is also followed by Currie and Schwandt (2016a,b). Barbieri (2014) follows a similar strategy when analyzing longevity trends across French département and finds large geographical disparities in mortality. To our knowledge, ours is the first paper to apply these methods to a comparative analysis of the United States and a large European country.
3. Data and Methods
For both the United States and France, we first rank geographic areas by the fraction of poor in each area and then create groups of areas that each account for approximately 5% of the national populations. In this way we can consistently compare, for example, the bottom fifth to the top fifth of the population, without the confounding that can be caused by changes in the composition of educational or occupational groups.
In France, we rank by département, which is the level of government in between the administrative regions (until 2015, there were 27 of these regions; in 2016, the number was reduced to 18) and the smaller communes. We rank all 96 mainland départements in 1990, 2000, and 2010 by their poverty level in 2010 and then divide them into 20 roughly equal groups (Figure S1). We use the 2010 level for all years because the poverty and income measures available from the Institut National de la Statistique et des études économiques (INSEE) before 2006 are not produced with a single consistent methodology.
However, we also show results below for alternative rankings by educational outcomes, which are available for 1990, 1999, and 2012 and therefore allow us to re-rank départements in every year. As we discuss below, this re-ranking does not affect our results. Note that ranking by educational level is different than tracking a single educational group over time.For example, we can look at areas with the highest fractions of high school dropouts, even if the fraction of high school dropouts is declining over time.
In what follows, we will refer to the département groups with the highest (lowest) fractions of their populations in poverty as the poorest (richest) areas. In France, the poverty rate is defined as the share of population living with less than 60% of the median national disposable income. The INSEE, like EUROSTAT and other European countries, measures income poverty in a relative manner whereas other countries (such as the United States and Australia) take an absolute approach. To measure poverty in relative terms, a poverty line
is determined with respect to the distribution of income in the whole population. Specifically, in France, a family with less than 60% of the national median income is considered poor.
In the United States, the Census Bureau uses a set of money income thresholds that vary by family size and composition in order to determine who is in poverty. If a family's total income is less than the family's threshold, then that family and every individual in it is considered to be in poverty.
Figure 1 shows a map of French départements ranked by their level of poverty and a map of the United States showing counties by their poverty ranking. The figures show that in France, the poorest areas are in the extreme north and south of the country, while in the United States there is a concentration of poverty in Appalachia and in the south, with pockets of poverty scattered across other areas.
Ranking départements by their poverty rate in 2010 and dividing them into ventiles of the overall population results in groups that contain an average of 3 million people each in France and approximately 15 million people each in the United States, consistent with the United States' having a much larger population (Figure 2, Table A1). In France, the lowest poverty group had a poverty rate of 9.33% in 2010, while 22.48% of the population in the top poverty group was poor. In 2010, median French income reached €42,259 in the richest group, while it was €31,751 in the poorest group. Thus, there is substantial variation in these measures across France. Comparable figures for the United States in 2010 are 5.58% poor in the richest group (with a median income of €61.336) and 28.30% poor in the top poverty group (with a median income of €24,831).
Mortality data in France are from the Centre d'épidémiologie sur les causes médicales de
décès (CépiDc). The CépiDc maintains a database with more than 20 million death records
since 1979. Data are gathered from two documents: the medical certificate and the bulletin of civil status of death. Total deaths are available by département, year, gender, and age group.
We focus on mortality rates for 1990, 2000, and 2010 in order to have the best quality population data to create death rates.
In the United States, mortality data are constructed at the level of county group, gender, and age by dividing death counts from the United States. Vital Statistics by population counts are from the decennial Census.
3. Results
We will present most of our results graphically, for ease of interpretation. Figure A1 provides a schematic overview of how our graphs reflect different inequality trends.
Mortality rates will be measured on the y-axis, while the x-axis indicates poverty percentiles; a place with a poverty percentile near zero is a rich place, and a place with a poverty
percentile near 100 is among the poorest places. The well-known positive cross-sectional relationship between income and health suggests that we should expect to see the lines on the graph slope upwards, indicating higher mortality in poorer places. The slope of the line indicates how strong this relationship is—flatter lines indicate more equality in mortality outcomes. If mortality falls over time, then we should expect to see the lines representing later decades lie below the line for 1990.
Finally, in order to ask whether inequality in mortality increased, decreased, or remained constant over time, we look at the relative slopes of the lines for the different decades. A parallel shift indicates that mortality has fallen by roughly the same amount for everyone, so that there is no change in inequality in mortality. If mortality fell more in the richest places, there will be an increase in inequality in mortality and the lines representing different decades will appear to converge as one moves from left to right across the figure. Conversely, if mortality fell more in the poorest places, then there will be a decrease in inequality in mortality and the lines representing different decades will appear to diverge or fan out.
With this schematic in mind, we turn to our main results, which are summarized in Figure 3. More detailed figures (plotting the points for each ventile of the distribution) are shown for France in Figure A2 and for the United States in Figure A3. Table 1 reports the exact mortality rates for the highest and lowest poverty percentiles plotted in Figure 3, while the slopes of the lines plotting mortality against poverty percentiles are shown in Table 2, along with p-values for a test of the hypothesis that the slope is non-zero.
The first panel of Figure 3 focuses on mortality for males (which is higher at all age groups than mortality for females in both countries), while the second panel focuses on mortality for females. The solid lines refer to France, while the dashed lines refer to the United States. Bolded lines represent 2010, while lighter lines represent 1990. Thus, this figure allows one to examine inequality in mortality both within countries over time and across countries. As discussed above, flatter lines indicate less inequality in mortality (lower and flatter lines are better).
Figure 3 shows several striking patterns. First, as of 2010, age-specific mortality was higher in the United States than in France for all ages and both genders. Moreover, the French gradients are remarkable flat relative to the U.S. gradients. In fact, Table 2 indicates that for males less than 24 and for females less than 34, there is no relationship between mortality and the poverty percentile in France as of 2010. In contrast, in the United States, the 2010 relationships are all strongly upward sloping and significantly different than zero for every age and gender group, indicating a strong relationship between poverty percentile and mortality.
Comparing mortality levels in the United States and France shows that in 1990, the French and U.S. lines for males 25–64 crossed at between the 20th and 60th poverty
percentiles. What this means is that in 1990, rich Frenchmen had higher mortality rates than rich American men. That is, compared to Americans, some of the strong equality in outcomes
among Frenchmen was achieved via worse prospects for the rich rather than through better prospects for the poor. However, by 2010, these crossovers (which never existed for females) had largely disappeared. In 2010, the richest French people do as well as the richest
Americans in many, though not all, age categories, but poorer Americans do much worse than poor French people in terms of mortality. It is striking that even in richer areas, American women over 65 have higher mortality than French women of the same age.
Turning to the evolution of inequality in mortality, Figure 3 suggests that there was very little change in the slopes of the lines relating mortality rates to poverty percentiles in France. Table 2 confirms that there were no statistically significant changes in the slope of this relationship, indicating no change in inequality in mortality.
In contrast, the development of inequality in mortality in the United States showed more variation, both over time and across groups. Consistent with Currie and Schwandt (2016a,b) we show that inequality in mortality fell for American children and young adults between 1990 and 2010, while inequality in mortality among older adults increased, especially among women. Note however that these increases in inequality in mortality at older ages are milder than those based on data for whites only. That is because, as Currie and Schwandt show, there was tremendous improvement in mortality among African-American men and women over this period. Hence, pooling whites and African-Americans (who had higher mortality rates to begin with) together as we do here, tends to mute increases in inequality in mortality for older adults.
Overall, the evolution of mortality in France over this period is quite remarkable. Not only were mortality rates much more equal to begin with, mortality also improved over time more strongly than in the United States, especially for women over 15 and for men aged 35 to 54. The much greater decline in mortality for women aged 75–84 in France relative to the United States is especially noteworthy given that in 1990, mortality in this age and gender
group was approximately equal in the two countries. These patterns indicate that the “social justice” achieved in France does not come at the expense of lower rates of innovation and health improvements.
Specific causes of death
It is natural to ask whether there are specific causes of death that show especially large differences in mortality rates across the two countries, in terms of either levels or changes. Table 3 shows the three leading causes of death for each age group. Appendix Table A3 provides more information on the underlying International Classification of Disease Codes that were used to create these categories. Following Case and Deaton’s famous work, we have adopted the category “Deaths of Despair,” which includes homicides, suicides,
accidental drug poisoning, and alcohol/liver disease. Further information about each of these separate causes of death is shown in Appendix Table A4.
Table 3 indicates that the most common causes of death shift as people age. For infants, complications arising from labor and delivery in the perinatal period are the leading cause. As children get older, unintentional injuries (accidents) become the leading cause of death, while for prime-age adults, it is deaths of despair. Finally, as adults age further, cancer (malignant neoplasms) and heart disease become leading causes.
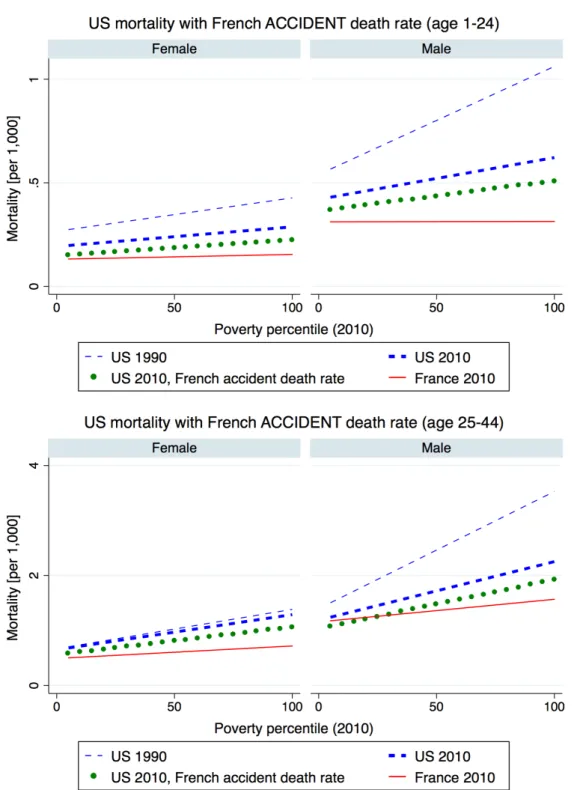
In the rest of this section, we consider how overall mortality for males and females in a specific age group would be affected if the U.S. mortality rate by poverty percentile was set equal to the French mortality rate for the same poverty percentile for selected leading causes of death in each age group. Each figure shows the actual U.S. rates for 1990 to 2010 as dashed lines and the actual 2010 rates for France as a solid line. A fourth, dotted line shows the counterfactual U.S. rate that would be observed if the U.S. mortality rate was set to the French mortality rate for one specific cause.
Figure 4 considers accident rates for people aged 1–24 and 25–44, age groups where accidents are among the leading causes of death. Comparing the dotted line indicating the counterfactual to the actual lines for the United States and France in 2010, one can see that reducing U.S. accident rates to French levels would close the gap in overall mortality rates by between 30% to 40% depending on the gender and age group. Thus, higher death rates from unintentional injuries are a leading cause of the gap in death rates at younger ages between these two countries. One might conjecture that higher accident rates in the United States are largely a matter of lifestyle (reflecting factors such as more vehicle miles driven) and thus beyond the reach of policy. However, according to the Institute of Medicine (1999), factors as diverse as product regulation, safety education, and the organization of trauma care can all play a role in reducing the burden of injury, which makes injury reduction an appropriate target for public policy.
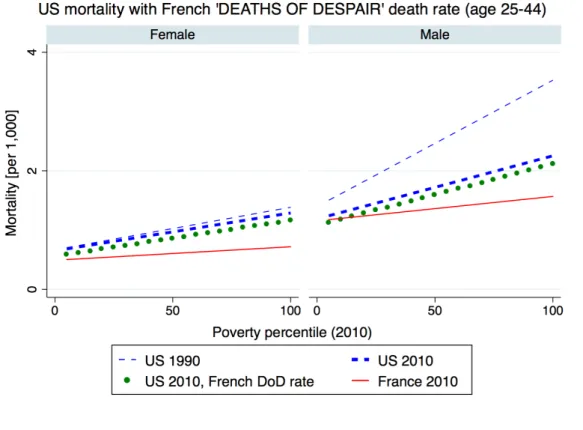
Figure 5 focuses on deaths of despair in the 25–44 and 45–64 year-old age groups; they have become leading causes of death for these groups and have received a great deal of attention in the United States (see Case and Deaton 2015, 2017). As reported in Table 3C, deaths of despair have increased by 42% and 106% for U.S. middle-aged males and females, respectively, while they decreased by 17% and 35% in France over the same period. Given this development, one might expect to see that overall, U.S. mortality rates in these age groups would have been much lower if the French mortality rates for deaths of despair had prevailed in the United States. Perhaps surprisingly then, Figure 5 suggests that setting U.S. rates to French rates would have had little impact on either U.S. mortality rates or on the closing of the gap between U.S. and French rates. The dotted line, showing simulated U.S. mortality with the French rate for deaths of despair, is only marginally lower than the actual U.S. mortality rate for these age groups.
There are two reasons U.S. deaths of despair do not make much of a difference in this cross-country comparison. First, deaths of despair are relatively high in France, driven primarily by suicides, which are slightly higher in France than in the United States, for both middle-aged men and women (see Appendix Table A4). Moreover, deaths of despair only make up between one-third and one-tenth of all deaths at middle and older ages. Overall, Figure 5 suggests that deaths of despair can therefore play only a minor role in explaining differential mortality developments in France and in the United States. One reason this observation is interesting is that it suggests that whatever underlying social malaise is driving U.S. deaths of despair, it is not a peculiarly American phenomenon.
Before turning from deaths of despair, it is worth discussing homicides specifically, as higher rates of violent crime are one of the things that distinguishes the U.S. from Europe (Lynch and Pridemore 2011). Figure 1 shows that setting U.S. homicide rates to French rates would have little impact on deaths among women, but it would have an impact on death rates among men, especially at men at younger ages in the highest poverty places.
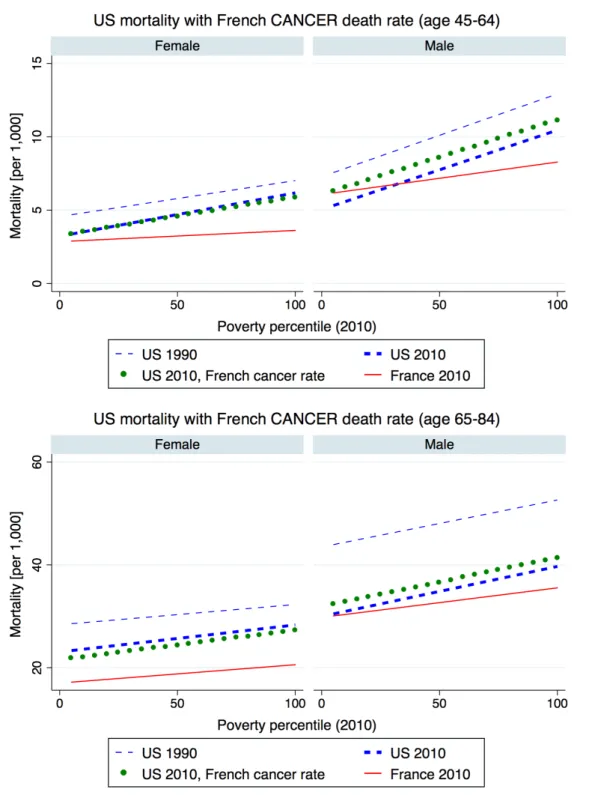
Figure 6 focuses on cancer deaths, in the 45–64 and 65–84 year-old age groups where cancer is a leading cause of death. These figures indicate that among men, applying French cancer death rates to the United States would actually increase U.S. overall mortality rates. That is, French men have higher death rates from cancer than American men, particularly at ages 45–64. It is not clear whether this gap represents differences in prevalence, screening, or treatment, or all three. Among women, applying French cancer rates to the U.S. data would result in very slight reductions in American mortality in these age groups. This means we can rule out differential cancer mortality as a primary reason for higher U.S. mortality rates.
One reason for the lower cancer mortality rate among older U.S. males could be declining smoking rates in these cohorts. The United States has experienced great success in smoking cessation that occurred first among men and only later among women (the affected
women have not yet entered old age). In France, reductions in smoking rates have been more moderate and occurred later as discussed further below.
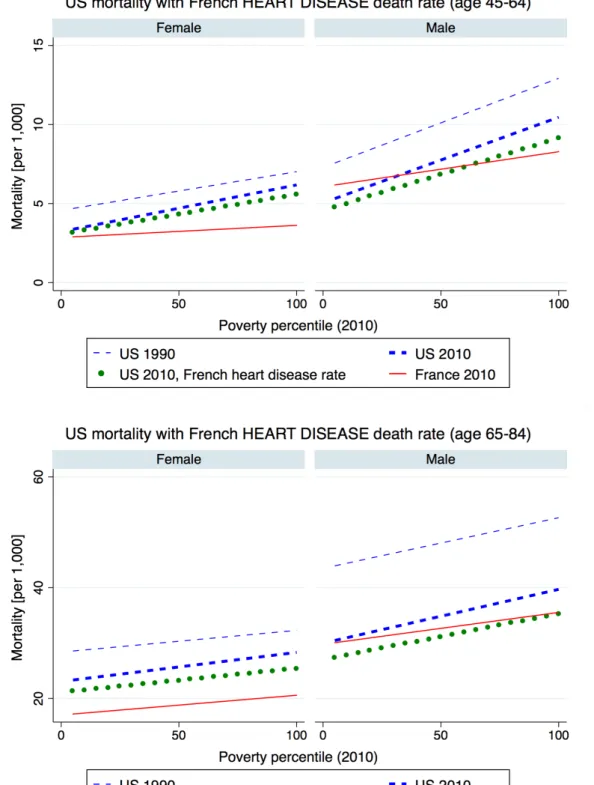
Figure 7 shows that applying French mortality rates from ischemic heart disease to the U.S. data for ages 45–64 would reduce the gap in mortality between French men and American men by about two-thirds in the higher poverty percentiles. In the low poverty percentiles, the French death rates are actually higher than the equivalent U.S. rates. In these percentiles, applying the French rates for heart disease would result in an even lower overall death rate. At ages 65–84, when ischemic heart disease becomes a more prominent cause of death, applying the French rates eliminates the mortality gap at the top poverty percentile. Moreover, at all other poverty percentiles, the resulting simulated rate is below the actual rate in both the United States and France!
Among women, there is a very large gap in mortality rates, particularly for women aged 65–84; applying French heart disease mortality rates would have only a small impact on the gap between U.S. and French rates.
4. Discussion and Conclusions
Our focus on using département groups and counties as the unit of analysis to examine inequality has advantages and disadvantages. The main advantage is that by grouping smaller geographic areas into groups each representing a fixed slice of the population, we can focus on trends in a relatively constant share of the population over time and thus avoid the large changes in composition that complicate analyses when grouping people by characteristics such as education or occupation (Strand et al. 2010; Mackenbach et al. 2016). Départements and counties are also large enough to provide precise mortality estimates even in age ranges with low mortality. Arguably, our method is well suited to conducting comparative research,
as even administrative units of different average size can be converted into ventiles of the population, which can then be compared across countries.
The main limitation of our approach is that it focuses on differences between groups of
départements whereas some variation in inequality will occur within départements. It is
unclear, for example, whether low poverty areas are healthier simply because they contain more rich and healthy people or whether poor people who live in rich areas are also healthier. Chetty et al. (2016) argue that in the United States, the poor appear to be better off in places where there are more rich people, presumably because the quality of public services and amenities are better and the poor cannot be completely excluded from enjoying these benefits. It will be important for future work to determine which sorts of amenities are most
responsible for reducing mortality in these areas.
A second limitation is that because there is no consistent data on département-level poverty rates available over time in France before 2004, we are unable to rank the
départements using contemporaneous poverty rates in each year and hence use the 2010
poverty rate for all our rankings. (However, this procedure also has the advantage that the poorest area in 2010 is identified as the poorest area throughout the entire period of analysis, rather than shifting from decade to decade).
To address this issue, we have redone our calculations ordering département by education levels (specifically, by the fraction of the population without a baccalaureate degree).
Education is available consistently for each département in 1990, 1999, and 2012, and the fraction without a baccalaureate is highly correlated with the fraction of poor (see Figure A7). Note that we can consistently identify areas with the lowest levels of education, even when there are large changes over time in the fraction of the population in each education category.
As one would expect, the results based on education rankings look quite similar to those discussed above (see Figure A4). Moreover, with these data it is possible to compare the
effects of reordering the départements in each year with the estimates obtained above when only the education ranking in 2012 is used. A comparison of Figures A3 and A4 shows that the results are virtually identical. This finding is in line with Currie and Schwandt (2016a,b), who demonstrate that in the United States, results are also very similar when county groups are reordered every year rather than being kept constant over time.
Our results point to stark differences in both levels and trends in inequality in mortality in the United States and France. Age-specific mortality was higher in the United States than in France for all ages and both genders in 2010, though this was not always the case:in 1990, middle-aged Frenchmen in wealthy areas were more likely to die than men in wealthy American areas. By 2010, in general, rich Americans did as well as rich French citizens, with the main exception being elderly American women, who had much higher mortality rates than elderly French women. However, Americans in poor areas were more likely to die that French people in poor areas in all age and gender groups.
Overall, the French mortality-poverty percentile gradients are remarkably flat relative to the comparable U.S. gradients, and this is especially true for children and young adults—in France, inequality in mortality has largely been eliminated in these groups. In contrast, in the United States, the traditional strong relationship between income and health continues to hold for all groups, which is reflected in strongly upward sloping gradients.
The French gradients also show remarkably little change over time. Thus, over a period when income inequality increased sharply in France (Garbinti et al., 2017), there was essentially no change in inequality in mortality. This fact is significant because it shows that there is no necessary relationship between income inequality and health inequality;while it is true that on average, income and health are related, they do not necessarily move in lockstep. (This is in line with Leigh and Jencks (2007), who find no relationship between inequality in income and inequality in mortality for 12 developed countries over the past century).
The U.S. trends also support this conclusion. While income inequality increased greatly between 1990 and 2010 and fueled a large body of academic literature (c.f. Piketty 2014; Piketty and Saez 2003; Piketty, Saez, and Zucman 2018), inequality in mortality grew for some demographic groups but shrank for others. As we demonstrate above, inequality in mortality fell for American children and young adults between 1990 and 2010, while
inequality in mortality among older adults increased, especially among women.
What are the protective factors that can prevent increases in income inequality from being reflected in increases in inequality in mortality? Health care systems are likely to play a role. As discussed above, France has a system dedicated to ensuring equal access to care. France has seen many changes in the organization of health care over this period, though it is not known to what extent they have driven the changes we document here.1 The French
health insurance system remains one of the most redistributive systems in the OECD, with particularly low out-of-pocket expenditures. However, despite the generosity of the system, some inequality in mortality remains among adults and the elderly in France, pointing to the continued importance of social determinants of health such as education, access to
employment, and income supports, which have recently been identified as priorities in France’s national health strategy (Touraine, 2014).
In the United States, the reductions in inequality in mortality among poor infants and children may be attributable at least in part to the tremendous expansion of public health insurance for poor infants and children that took place beginning in the late 1980s. The eligibility of pregnant women for public health insurance coverage of their pregnancies and deliveries increased by roughly 30% , and this increase was associated with an 8.5%
1 Between 1990 and 1999, a funding reform for public hospitals introduced global budgeting, and Act #91-748
aimed to balance health-care delivery across French regions and to introduce strategic planning for hospitals. The 1996 reform aimed to create "universal health insurance" giving the right to social security to anyone over the age of 18 regularly residing in French territory. Many changes occurred after 2000 as well, including the
reduction in infant mortality (Currie and Gruber 1996a). Over the same period, a 15% increase in eligibility for public health insurance coverage among children reduced the probability that children went without any doctor visits over the course of a year by 9.6% (Currie and Gruber 1996b).
Recently, several studies have examined the longer-term impact of the expansions of children’s public health insurance coverage (Brown, Kowlaski and Lurie 2015; Cahodes et al. 2014; Currie, Decker, and Lin 2008; Miller and Wherry 2014; Wherry and Meyer 2015; Wherry et al. 2015). Many of these studies rely on a cohort design that compares cohorts who received Medicaid coverage in early childhood because they were born after the cutoff date for eligibility, to cohorts who were born just prior to that cutoff. The affected cohorts attain more education, are more likely to be employed and have higher earnings, and are in better health as adults. Most relevant for this study, Wherry and Meyer (2015) show that cohorts eligible for the Medicaid expansions had lower child mortality than slightly older cohorts and that the effect was largest in demographic groups with the highest increase in eligibility.
Aizer and Currie (2014) identify many additional U.S. policies that may have been important for safeguarding the health of young children, including measures to reduce domestic violence and improve nutrition. Thus, a possible interpretation of the U.S. data is that an underlying tendency for inequality in mortality to follow trends in inequality in income found expression among older people, but was counterbalanced among young people by a tremendous multi-pronged policy effort to improve the health of American children.
Following Preston (2006), Currie and Schwandt (2016a,b) also argue that cohort-level smoking patterns maybe responsible for some of the increasing inequality at older ages. In the United States, when the dangers of smoking became widely known, people of higher
status. Smoking increased in France longer than the United States (Hill 1998), implying a similar effect on inequality for old-age mortality in France.
To conclude, the results of this paper suggest that policy makers should not be fatalistic about the link between income and health. Ideally, public policy would eliminate poverty. However, while policy makers struggle with that difficult task, there is much that can be done to improve health among the poor and eliminate health disparities. We have identified public health insurance and tobacco control policies as two of the factors that have been responsible for some of the recent improvements in health and reductions in inequality in mortality. Policies that target other modern threats to health, such as opioid addiction and obesity, may also prove promising.
References
Anderson RN, Miniño AM, Hoyert DL, Rosenberg HM (2001) Comparability of cause of death between ICD-9 and ICD-10: preliminary estimates. National Vital Statistics Reports 18;49(2):1-32
Aizer A, Currie J (2014) The intergenerational transmission of inequality: Maternal disadvantage and health at birth. Science 23; 344(6186):856–61
Barbieri M (2014) La mortalité départementale en France. Population.17; 68(3):433–79 Baron E (2016) Liberté, égalité, fraternité…santé. The Lancet 387(10034):2179–81 Bound J, Geronimus A, Rodriguez J, Waidman T (2014) The implications of differential
trends in mortality for social security policy. University of Michigan Retirement Research Center (MRRC) Working Paper, WP 2014-314. Ann Arbor, MI.
Bosworth B, Burke K (2014) Differential mortality and retirement benefits in the health and retirement study. (Washington D.C.: The Brookings Institution).
Brown D, Kowalski A, Lurie I (2015) Medicaid as an investment in children: what is the long-term impact on tax receipts? National Bureau of Economic Research
Cambois E (2004) Careers and mortality in France: evidence on how far occupational mobility predicts differentiated risks. Soc Sci Med 58(12):2545–58
Case A, Deaton A (2015) Rising morbidity and mortality in midlife among white non-Hispanic Americans in the 21st century. Proc Natl Acad Sci 112(49):15078–83 Case A, Deaton A (2017) Mortality and morbidity in the 21st Century. Brookings Pap on
Econ Act 48(1) 397-476
Chetty R, Stepner M, Abraham S, Lin S, Scuderi B, Turner N, et al (2016) The association between income and life expectancy in the United States, 2001-2014. JAMA
315(16):1750–66
Cohodes S, Grossman D, Kleiner S, Lovenheim M (2016) The effect of child health insurance access on schooling: evidence from public insurance expansions. J Human Resources 51(3):727-759
Currie J, Decker S, Lin W (2008) Has public health insurance for older children reduced disparities in access to care and health outcomes? J Health Econ 27(6):1407-1652 Currie J, Gruber, J (1996a) Saving babies: the efficacy and cost of recent expansions of
Medicaid eligibility for pregnant women. J Political Economy 104:1263–96
Currie J, Gruber J (1996b) Health insurance eligibility, utilization of medical care, and child health. Quarterly J of Econ 111(2):431-466
Currie J, Schwandt H (2016) Inequality in mortality decreased among the young while increasing for older adults, 1990–2010. Science 352(6286):708-12
Currie J, Schwandt H (2016) Mortality inequality: the good news from a county-level approach. J Econ Perspectives 30(2):29–52
Cutler DM, Lange F, Meara E, Richards-Shubik S, Ruhm CJ (2011) Rising educational gradients in mortality: the role of behavioral risk factors. J Health Econ 30(6):1174–87 Deaton A (2002) Policy implications of the gradient of health and wealth. Health Aff
(Millwood) 21(2):13–30
Desplanques G (1984) L’inégalité sociale devant la mort. Econ Stat 162(1):29–50 Dowd JB, Hamoudi A (2014) Is life expectancy really falling for groups of low
socio-economic status? Lagged selection bias and artefactual trends in mortality. Int J Epidemiology 43(4):983-988
Ezzati M, Friedman AB, Kulkarni SC, Murray CJ (2008) The reversal of fortunes: trends in county mortality and cross-county mortality disparities in the United States. PLoS Med 5(4):e66
Garbinti G, Goupille-Lebret J, Piketty T (2017) Income inequality in France 1900-2014: evidence from distributional accounts WID.world Working Paper 04
Goldring T, Lange F, Richards-Shubik S (2016) Testing for changes in the
SES-mortality gradient when the distribution of education changes too. J Health Econ 46:120-130
Hendi AS (2015) Trends in U.S. life expectancy gradients: the role of changing educational composition. Int J Epidemiology 44(3):946-55
Heritage Z (2009) Inequalities, social ties and health in France. Public Health 123(1):e29–34 Hill C (1998) Trends in tobacco smoking and consequences on health in France. Prev Med 27(4):514–9
Hollande F (2016) Towards a global agenda on health security. The Lancet 387(10034):2173– 4
Institute of Medicine (1999) Reducing the burden of injury (Washington D.C.: National Academies Press)
Jusot F, Or Z, Sirven N (2012) Variations in preventive care utilisation in Europe. Eur J Ageing 9(1):15–25
Kulkarni SC, Levin-Rector a, Ezzati M, Murray CJL (2011) Falling behind: life expectancy in U.S. counties from 2000 to 2007 in an international context. Popul Health Metr 9(1):16 Leclerc A, Chastang JF, Menvielle G, Luce D (2006) Socioeconomic inequalities in
premature mortality in France: Have they widened in recent decades? Soc Sci Med 62(8):2035–45
Leigh A, Jencks C (2007) Inequality and mortality: Long-run evidence from a panel of countries. J Health Econ 26(1):1–24
Lynch J, Pridemore W (2011) "Crime in International Perspective," in Crime and Public Policy, William J. Wilson and Joan Petersillia (eds.) (Oxford: Oxford University Press) Mackenbach JP, Stirbu I, Roskam AJR, Schaap MM, Menvielle G, Leinsalu M, et al (2008)
Socioeconomic Inequalities in Health in 22 European Countries. N Engl J Med 358(23):2468–81
Mackenbach JP, Kulhánová I, Artnik B, Bopp M, Borrell C, Clemens T, et al (2016) Changes in mortality inequalities over two decades: register based study of European countries. BMJ 353:i1732
Meara ER, Richards S, Cutler DM (2008) The gap gets bigger: changes in mortality and life expectancy, by education, 1981-2000. Health Aff 27(2):350-360
Menvielle G, Chastang J-F, Luce D, Leclerc A (2007) Évolution temporelle des inégalités sociales de mortalité en France entre 1968 et 1996. Étude en fonction du niveau d’études par cause de décès. Rev DÉpidémiologie Santé Publique 55(2):97–105
Menvielle G, Leclerc A, Chastang JF, Luce D (2008) Inégalités sociales de mortalité par cancer en France: état des lieux et évolution temporelle. InVS BEH 33:289–92
Miller, SM, Wherry, LR (2014) The long-term health effects of early life Medicaid coverage. J. Human Resources 53(2)
Montez JK, Berkamn LF (2014) Trends in the educational gradient of mortality among U.S. adults aged 45 to 84 years: bringing regional context into the explanation. Am J Public Health 104(1):e82-90
Montez JK, Zajacova A (2013) Explaining the widening education gap in mortality amoung ?? U.S. white women. J Health and Soc Behav 54(2): 166-182
Murray CJL, Kulkarni SC, Michaud C, Tomijima N, Bulzacchelli TJI, Ezzati M (2006) Eight Americas: instigating mortality disparities across races, counties, and race-counties in the United States. PLoS Med 3(9):e260
National Academies of Sciences, Engineering, and Medicine (NAS). 2015. The growing gap in life expectancy by income: implications for federal programs and policy responses. Committee on the Long- Run Macroeconomic Effects of the Aging U.S. Population-Phase II; Committee on Population, Division of Behavioral and Social Sciences and Education; Board on Mathematical Sciences and Their Applications, Division on Engineering and Physical Sciences. Washington, DC: The National Academies Press.
Nay O, Béjean S, Benamouzig D, Bergeron H, Castel P, Ventelou B (2016) Achieving universal health coverage in France: policy reforms and the challenge of inequalities. The Lancet 387(10034):2236–49
NRC (2015) The growing gap in life expectancy by income: implications for federal programs and policy responses. National Research Council, Committee on the Long-Run
Macroeconomics Effects of the Aging U.S. Population
Olshansky JS, Antonucci T, Berkman L, Binstock RH, Boersch-Supan A, Cacioppo JT, et al (2012) Differences in life expectancy due to race and ecuational differences are widening, and many may not catch up. Health Aff 31(8):1803-1813
Pappas G, Queen S, Hadden W, Fisher G (1993) The increasing disparity in mortality
between socioeconomic groups in the United States, 1960 and 1986. N Engl J of Med 329 (2):103-109
Pijoan-Mas J, Ríos-Rull JV (2014) Heterogeneity in expected longevities. Demography 51(6):2075–102
Piketty T (2014) Capital in the 21st Century (Cambridge MA: Harvard University Press)
Piketty T, Saez E (2003) Income Inequality in the United States, 1913-1998 Quarterly J of Econ 118(1):1-39
Piketty T, Saez E, Zucman G (2018) Distributional national accounts: methods and estimates for the United States, 1913-2013 Quarterly J of Econ. Forthcoming
Piketty T, Postel-Vinay G, Rosenthal JL (2006) Wealth concentration in a developing economy: Paris and France, 1807–1994. Am Econ Rev 96(1):236–56
Preston, SH, Wang H (2006) Sex mortality differences in the United States: the role of cohort smoking patterns. Demography 43(4):631–646
Preston SH, Elo IT (1995) Are educational differentials in adult mortality increasing in the United States? J Aging Health 7(4):476-496
Saurel-Cubizolles MJ, Chastang JF, Menvielle G, Leclerc A, Luce D, et al (2009) Social inequalities in mortality by cause among men and women in France. J Epidemiol Community Health 63(3):197–202
Shiels MS, Chernyavskiy P, Anderson WF, Best AF, Haozous EA, Hartge P, et al. Trends in premature mortality in the USA by sex, race, and ethnicity from 1999 to 2014: an analysis of death certificate data. (2017) The Lancet 389(10073):1043-1054
Singh GK, Siahpush M (2006) Widening socioeconomic inequalities in U.S. life expectancy, 1980–2000. Int J Epidemiol 35(4):969–79
Smith JP (1999) Healthy bodies and thick wallets: the dual relation between health and economic status. J Econ Perspect 3(2):145-166
Smith JP (2005) Consequences and predictors of new health events. NBER Chapters, in: Analyses in the Economics of Aging, pages 213-240 National Bureau of Economic Research, Inc.
Smith JP (2007) The impact of socioeconomic status on health over the life-course. J Human Resources 42 (4):739-764
Strand BH, Grøholt EK, Steingrímsdóttir ÓA, Blakely T, Graff-Iversen S, Næss Ø (2010) Educational inequalities in mortality over four decades in Norway: prospective study of middle aged men and women followed for cause specific mortality, 1960-2000. BMJ 23;340:c654
Touraine M (2014) Health inequalities and France’s national health strategy. The Lancet 383(9923):1101–2
Waldron H (2007) Trends in mortality differentials and life expectancy for male Social Security-covered workers, by socioeconomic status. Social Security Bulletin 67(3) Waldron H (2013) Mortality differentials by lifetime earnings decile: implications for evaluations of proposed Social Security law changes. Social Security Bulletin 73(1)
Wang H, Schumacher AE, Levitz CE, Mokdad AH, Murray CJL (2013) Left behind widening disparities for males and females in U.S. county life expectancy, 1985-2010. Popul Health Metr 11(1):8
Wherry LR, Meyer BD (2015) Saving teens: using a policy discontinuity to estimate the effects of Medicaid eligibility. J. of Human Resources 51(3) 556-588
Wherry LR, Miller S, Kaestner R, Meyer BD (2015) Childhood Medicaid coverage and later life health care utilization. Review of Economics and Statistics
Wilmoth CBJ, Barbieri M (2011) Geographic differences in life expectancy at age 50 in the United States compared with other high-income countries; in: Eileen M. Crimmins,
Samuel H. Preston, and Barney Cohen (eds.), International differences in mortality at older ages: dimensions and sources, Washington, D.C.: National Academies Press, pp. 337-372 Wood AM, Pasupathy D, Pell JP, Fleming M, Smith GCS (2012) Trends in socioeconomic
inequalities in risk of sudden infant death syndrome, other causes of infant mortality, and stillbirth in Scotland: population based study. BMJ 16;344:e1552
Figure 1: 2010 poverty rates across French départements and U.S. counties
(A) France
Figure 2: Population size of poverty quantile in France and the United States
Notes: Poverty quantiles are constructed by ranking French départements and U.S. counties by their 2010 poverty rates and dividing them into 20 groups, each representing
approximately 5% of the total population.
0 5 10 15 20 0 50 100 0 50 100 France United-States Po pu la tio n in mi lli on s Poverty quantiles in 2010
Figure 3: France versus U.S. mortality rates in 1990 and 2010
Notes: One-year mortality rates across département/county groups ranked by their poverty level are plotted for France and the United States by age group across 2 different years.
5 10 15 M o rt al ity [ pe r 1, 0 00 ] 0 20 40 60 80 100 Poverty percentile (2010) Age 0 .2 .4 .6 0 20 40 60 80 100 Poverty percentile (2010) Age 1-4 .1 .2 .3 .4 0 20 40 60 80 100 Poverty percentile (2010) Age 5-14 .5 1 1. 5 2 0 20 40 60 80 100 Poverty percentile (2010) Age 15-24 1 2 3 M o rt al ity [ pe r 1, 0 00 ] 0 20 40 60 80 100 Poverty percentile (2010) Age 25-34 0 2 4 0 20 40 60 80 100 Poverty percentile (2010) Age 35-44 4 6 8 0 20 40 60 80 100 Poverty percentile (2010) Age 45-54 5 10 15 20 0 20 40 60 80 100 Poverty percentile (2010) Age 55-64 20 30 40 M o rt al ity [ pe r 1, 0 00 ] 0 20 40 60 80 100 Poverty percentile (2010) Age 65-74 50 60 70 80 0 20 40 60 80 100 Poverty percentile (2010) Age 75-84
Male Mortality by poverty ranking
1990 France 1990 US 2010 France 2010 US 0 5 10 M o rt al ity [ pe r 1, 0 00 ] 0 20 40 60 80 100 Poverty percentile (2010) Age 0 .2 .4 .6 0 20 40 60 80 100 Poverty percentile (2010) Age 1-4 0 .2 0 20 40 60 80 100 Poverty percentile (2010) Age 5-14 .2 .4 .6 0 20 40 60 80 100 Poverty percentile (2010) Age 15-24 0 .5 1 M o rt al ity [ pe r 1, 0 00 ] 0 20 40 60 80 100 Poverty percentile (2010) Age 25-34 .5 1 1. 5 2 0 20 40 60 80 100 Poverty percentile (2010) Age 35-44 2 3 4 0 20 40 60 80 100 Poverty percentile (2010) Age 45-54 4 6 8 10 0 20 40 60 80 100 Poverty percentile (2010) Age 55-64 10 15 20 M o rt al ity [ pe r 1, 0 00 ] 0 20 40 60 80 100 Poverty percentile (2010) Age 65-74 30 40 50 0 20 40 60 80 100 Poverty percentile (2010) Age 75-84
Female Mortality by poverty ranking
Figure 4: U.S. mortality rates in 1990 and 2010, assuming the French 2010 rates for accidents
Note: The dashed blue lines show the mortality rates across poverty percentiles for the United States in 1990 and 2010. The solid red line shows mortality rates for France in 2010. The dotted green line shows hypothetical U.S. mortality rates using the French mortality rate for selected causes of death. Overall death rates for leading causes of death are reported in Table 3.
Figure 5: U.S. mortality rates in 1990 and 2010, assuming the French 2010 rates for deaths of
despair
Note: The dashed blue lines show the mortality rates across poverty percentiles for the United States in 1990 and 2010. The solid red line shows mortality rates for France in 2010. The dotted green line shows hypothetical U.S. mortality rates using the French mortality rate for selected causes of death. Overall death rates for leading causes of death are reported in Table 3.
Figure 6: U.S. mortality rates in 1990 and 2010, assuming the French 2010 rates for cancer
Note: The dashed blue lines show the mortality rates across poverty percentiles for the United States in 1990 and 2010. The solid red line shows mortality rates for France in 2010. The dotted green line shows hypothetical U.S. mortality rates using the French mortality rate for selected causes of death. Overall death rates for leading causes of death are reported in Table 3.
Figure 7: U.S. mortality rates in 1990 and 2010, assuming the French 2010 rates for heart
disease
Note: The dashed blue lines show the mortality rates across poverty percentiles for the United States in 1990 and 2010. The solid red line shows mortality rates for France in 2010. The dotted green line shows hypothetical U.S. mortality rates using the French mortality rate for selected causes of death. Overall death rates for leading causes of death are reported in Table 3. The heart disease death rate refers to deaths caused by ischemic heart diseases.
Table 1: Mortality in bottom and top poverty groups in 1990 and relative change 1990 to 2010
France United States
Mortality rate (per 1,000) in 5% of the population living in Mortality rate (per 1,000) in 5% of the population living in Age
Départements with lowest poverty rate
Départements with highest poverty rate
Counties with lowest poverty rate
Counties with highest poverty rate
group 1990 2010 Change 1990 2010 change 1990 2010 change 1990 2010 change
Panel A. Female <1 5.97 2.73 -54.3% 6.29 3.95 -37.1% 5.78 4.20 -27.3% 11.68 7.04 -39.7% 1-4 0.31 0.21 -32.8% 0.33 0.32 -2.9% 0.27 0.18 -32.4% 0.54 0.31 -43.3% 5-14 0.11 0.06 -47.7% 0.13 0.05 -65.6% 0.10 0.06 -43.9% 0.26 0.16 -39.3% 15-24 0.38 0.17 -56.3% 0.38 0.23 -40.1% 0.41 0.32 -21.3% 0.59 0.41 -30.5% 25-34 0.52 0.32 -38.3% 0.79 0.33 -57.7% 0.51 0.47 -6.5% 1.11 0.92 -17.5% 35-44 1.08 0.58 -45.7% 1.43 0.93 -34.6% 0.99 0.80 -19.4% 2.11 2.04 -3.0% 45-54 2.13 1.97 -7.4% 2.85 2.04 -28.4% 2.53 2.05 -19.0% 4.75 4.48 -5.7% 55-64 5.14 4.34 -15.5% 6.06 4.91 -19.0% 7.56 4.83 -36.0% 10.70 8.87 -17.0% 65-74 12.59 8.83 -29.9% 13.59 9.99 -26.5% 18.92 13.17 -30.4% 22.19 18.86 -15.0% 75-84 46.22 28.12 -39.1% 47.64 29.92 -37.2% 49.04 39.83 -18.8% 50.87 42.43 -16.6% Panel B. Male <1 8.52 3.46 -59.4% 7.88 4.10 -47.9% 7.08 4.82 -32.0% 14.36 8.21 -42.9% 1-4 0.45 0.17 -61.1% 0.31 0.18 -42.7% 0.36 0.18 -50.8% 0.74 0.30 -58.8% 5-14 0.18 0.09 -50.4% 0.23 0.10 -57.0% 0.20 0.11 -46.4% 0.37 0.19 -48.4% 15-24 1.11 0.53 -52.6% 1.16 0.53 -54.5% 1.04 0.81 -22.5% 2.06 1.21 -41.1% 25-34 1.60 0.80 -50.2% 2.05 0.77 -62.2% 1.21 1.05 -12.7% 3.35 1.92 -42.6% 35-44 2.29 1.34 -41.6% 2.91 1.67 -42.6% 1.89 1.39 -26.7% 4.90 3.27 -33.3% 45-54 5.20 3.41 -34.4% 6.33 4.52 -28.6% 4.03 3.19 -20.9% 8.92 7.80 -12.6% 55-64 13.18 8.70 -34.0% 15.02 9.86 -34.4% 12.38 7.49 -39.5% 19.97 15.72 -21.3% 65-74 26.95 17.91 -33.6% 31.35 20.54 -34.5% 31.12 18.37 -41.0% 40.36 29.34 -27.3% 75-84 76.51 48.02 -37.2% 76.31 51.53 -32.5% 77.06 52.65 -31.7% 84.20 61.58 -26.9%
Note: This table shows male and female one-year mortality rates at different ages, providing the numerical values underlying Figure 3 and respective relative changes from 1990 to 2010.
Table 2: Slopes regression lines fitted through 1-year mortality rates across poverty percentiles
France United States
1990 2010 1990 2010
Age
group Slope p-value Slope p-value
p-value of
difference Slope p-value Slope p-value
p-value of difference Panel A. Females <1 0.009 0.028 0.004 0.498 0.298 0.053 <0.001 0.024 <0.001 <0.001 1-4 0.000 0.569 0.001 0.502 0.384 0.002 <0.001 0.001 <0.001 <0.001 5-14 0.000 0.788 0.000 0.299 0.754 0.001 <0.001 0.001 <0.001 0.011 15-24 0.000 0.142 0.001 0.634 0.842 0.002 <0.001 0.001 <0.001 0.012 25-34 0.002 0.006 0.002 0.333 0.325 0.006 <0.001 0.004 <0.001 0.045 35-44 0.004 0.013 0.009 0.015 0.932 0.009 <0.001 0.010 <0.001 0.811 45-54 0.008 0.007 0.022 0.086 0.591 0.018 <0.001 0.023 <0.001 0.054 55-64 0.015 0.011 0.032 0.123 0.634 0.029 <0.001 0.036 <0.001 0.069 65-74 0.025 0.047 0.050 0.041 0.875 0.039 <0.001 0.053 <0.001 0.069 75-84 0.050 0.083 0.074 0.179 0.822 0.040 0.002 0.049 <0.001 0.534 Panel B. Males <1 0.004 0.315 -0.003 0.512 0.345 0.063 <0.001 0.027 <0.001 <0.001 1-4 0.001 0.141 0.000 0.891 0.491 0.003 <0.001 0.001 0.003 <0.001 5-14 0.000 0.328 0.000 0.757 0.395 0.002 <0.001 0.001 <0.001 <0.001 15-24 0.000 0.368 0.000 0.892 0.620 0.009 <0.001 0.003 <0.001 <0.001 25-34 0.001 0.017 0.002 0.031 0.923 0.018 <0.001 0.007 <0.001 <0.001 35-44 0.004 0.000 0.006 0.003 0.433 0.026 <0.001 0.015 <0.001 0.002 45-54 0.006 0.037 0.020 0.014 0.877 0.042 <0.001 0.040 <0.001 0.636 55-64 0.012 0.005 0.033 0.030 0.986 0.068 <0.001 0.068 <0.001 0.988 65-74 0.023 0.041 0.052 0.025 0.945 0.087 <0.001 0.098 <0.001 0.329 75-84 0.059 0.038 0.084 0.057 0.880 0.087 <0.001 0.090 <0.001 0.875
Note: Slopes are fitted using OLS regressions of mortality on the poverty percentile, including an intercept. The p-value of the difference is derived from a pooled OLS regression, including an interaction term of the poverty percentile with the year 2010. Regressions are weighted by gender-specific population.
Table 3: Mortality rates by age groups and cause in France and the United States
2010 deaths per 100,000 Change, 1990-2010
France United States France United States
Male Female Male Female Male Female Male Female
(A) Age <1 All Causes 379 295 680 564 -55% -53% -34% -31% Perinatal complications 177 135 334 273 -15% -17% -28% -26% Congenital anomalies 72.4 68.6 130 129 -56% -47% -39% -30%
Sudden infant death 40.1 23.2 0.44 0.59 -82% -83% -99% -99% Undetermined 30.6 29.8 88.1 62.7 -67% -63% -51% -48% (B) Age 1–24 All Causes 33.9 14.57 53 24.0 -53% -49% -36% -33% Accidents 15.2 4.25 21.2 8.81 -64% -64% -43% -37% Malignant neoplasms 3.2 1.9 3.3 2.4 -45% -30% -27% -29% Deaths of despair 5.3 1.7 15.9 4.8 -22% -30% 53% 130% Undetermined 2.9 0.95 0.64 0.43 -30% -19% -53% -37% (C) Age 25–44 All Causes 146 64.1 177 96.6 -35% -26% -30% -7% Deaths of despair 43.6 10.9 61.7 27.0 -17% -35% 42% 106% Accidents 30.0 5.94 50.6 20.2 -44% -54% -5% 35% Malignant neoplasms 21.2 23.5 16.9 20.7 -42% -15% -31% -29% Undetermined 13.0 4.25 2.35 1.40 21% 24% -60% -40% (D) Age 45–64 All Causes 732 326.8 758 461.6 -29% -19% -27% -22% Malignant neoplasms 318.4 172.93 216.1 176.84 -31% -11% -34% -31% Deaths of despair 97.4 32.6 126.5 55.3 -20% -26% 59% 96% Heart diseases 48.0 8.5 128.3 43.9 -51% -56% -46% -46% Undetermined 34.3 11.78 4.83 2.74 66% 81% -41% -27% (F) Age 65–84 All Causes 3,327 1,892 3,477 2,558.5 -29% -31% -29% -17% Malignant neoplasms 1242 606.8 1,044 724 -20% -10% -24% -10% Heart diseases 485.8 241.4 615.1 339.5 -47% -57% -52% -55% Cerebrovascular 175.6 134.8 163.5 156.0 -57% -61% -44% -39% Undetermined 87.13 50.06 9.57 6.49 67% 64% -60% -57% Note: This table shows the leading three causes of death by age groups in France and the United States. Mortality rates for individual “death of despair” causes as well as for homicides are reported in Appendix Table A4.
ONLINE APPENDIX (Not for Publication)
Figure A2: French male and female mortality rates by poverty percentile across age groups
Notes: One-year mortality rates across département groups ranked by their poverty level are plotted by age group and gender across 3 different years.
Figure A4: French male mortality rates by educational levels (population without a
baccalaureate degree) percentile across age groups.
Notes: Figure A2 (subpanel for males) is replicated, ranking départements by education instead of poverty. In the upper panel, départements are ranked by their education in 2012, while the ranking is reordered in each year in the lower panel.
Figure A5: French female mortality rates by educational levels (population without a
baccalaureate degree) percentile across age groups
Notes: Figure A2 (subpanel for females) is replicated, ranking départements by education instead of poverty. In the upper panel, départements are ranked by their education in 2012, while the ranking is reordered in each year in the lower panel.
Figure A6: U.S. mortality rates in 1990 and 2010, assuming the French 2010 mortality rate
for homicides
Note: The dashed blue lines show the mortality rates across poverty percentiles for the United States in 1990 and 2010. The solid red line shows mortality rates for France in 2010. The dotted green line shows hypothetical U.S. mortality rates using the French mortality rate for selected causes of death. Overall homicide rates are reported in Table A4.
Figure A7: French Poverty Rates by Share Without a Baccalaureate Degree
Notes: This figure shows that the fraction without a baccalaureate across départements is highly correlated with the fraction of poor.
Table A1: Characteristics of département groups by poverty rate in 2010
France United States
Poverty percentile Population (in millions) Poverty rate Median income (2010 EUR) Population (in millions) Poverty rate Median income (2010 EUR) 5 3.47 9.34 42,259 12.62 5.58 61,336 10 3.2 10.35 42,002 12.36 7.24 55,883 15 2.79 10.79 35,136 12.53 8.65 48,555 20 3.77 11.2 36,200 12.48 9.94 46,508 25 2.44 11.93 37,027 12.19 10.76 44,187 30 3.46 12.06 33,739 12.48 11.67 43,676 35 4.15 12.32 35,893 12.47 12.28 40,749 40 2.25 12.71 32,885 12.97 13.14 37,740 45 3.04 13.11 34,138 11.85 13.94 38,162 50 3.2 13.53 32,453 12.43 14.50 37,088 55 2.74 13.89 33,414 12.79 15.37 35,331 60 3.65 14.25 32,645 12.24 16.07 35,069 65 3.49 14.44 40,430 12.46 16.55 35,371 70 2.43 14.56 34,371 12.61 17.08 37,118 75 3.08 15.17 31,750 12.09 17.48 35,419 80 3.22 16.13 31,479 12.47 17.98 34,054 85 4.04 18.17 32,341 12.38 18.88 31,498 90 2.58 18.99 33,770 12.46 20.24 29,709 95 3.88 19.69 32,144 12.42 22.91 28,928 100 1.88 22.48 31 751 12.42 28.30 24,831
Table A2: Slopes of regression lines fitted through 3-year mortality rates across poverty
percentiles in France.
Mortality gradient across percentiles (using 3-year mortality rates)
1990 2010
Age group Slope p-value Slope p-value
p-value of difference Panel A. Females <1 0.004 0.135 0.002 0.522 0.296 1-4 0.000 0.061 0.001 0.078 0.602 5-14 0.000 0.655 0.000 0.637 0.043 15-24 0.000 0.788 0.000 0.363 0.999 25-34 0.003 0.007 0.001 0.000 0.962 35-44 0.006 0.006 0.003 0.001 0.357 45-54 0.018 0.013 0.007 0.012 0.710 55-64 0.033 0.026 0.012 0.008 0.933 65-74 0.050 0.043 0.023 0.022 0.995 75-84 0.085 0.053 0.053 0.035 0.968 Panel B. Males <1 0.008 0.018 0.004 0.135 0.624 1-4 0.001 0.061 0.000 0.061 0.129 5-14 0.000 0.007 0.000 0.655 0.304 15-24 0.000 0.896 0.000 0.788 0.604 25-34 0.003 0.244 0.003 0.007 0.139 35-44 0.009 0.009 0.006 0.006 0.628 45-54 0.023 0.056 0.018 0.013 0.723 55-64 0.035 0.101 0.033 0.026 0.822 65-74 0.050 0.055 0.050 0.043 0.997 75-84 0.088 0.145 0.085 0.053 0.942
Note: This table replicates the results reported in Table 2, using 3-year instead of 1-year mortality rates.
Table A3: ICD Codes for Causes of Death.
France United States
Cause ICD-9 codes ICD-10 Codes ICD-9 codes ICD-10 Codes
Congenital anomalies 740-7599 Q00-Q999 740-759 Q00-Q99
Perinatal complications
760-7799 P00-P969 760-779 P00-P96
Sudden infant death syndrome 7980 R95 798 GR130-135 Undetermined 7981-7999 R96-R99 797-799 R95-R99 Infectious and parasitic diseases 001-1399 A00-B999 001-139 A00-B99
Accidents 800-9289 V01-X599 E800-E978 V01-Y89
Accidental Drug Poisoning (ADP)
850-8699 X40-X499 E850-E858 X40-X44
Malignant Neoplasms 140-2089 C00-C97 140-208 C00-D48
Alcohol Addiction 291-2919,303 F10-F107 E860-E869 X45, X65, Y15
Chronic liver diseases 571 K70,K73-K74 571 K70,K73-K74
Suicides 950-9589 X60-X849 E950-E959 X60-X84
Homicides 960-9689 X85-Y099 E960-E969 X85-Y09
Diseases of the Heart (Ischemic)
410-414 I20-I259 410-414 I20-I25
Chronic Lower Respiratory
490-496 J40-J47 490-496 J40-J47
Cerebrovascular 430-438 I60-I698 430-438 I60-I69
Notes: ICD codes were used to classify causes of death (International Classification of Diseases): ICD-9 and ICD-10 codes. ICD-9 was used to encode deaths from 1979 to 1999. ICD-10 was used to encode deaths from 2000 to 2017. See Anderson et al. (2001) for comparability ratios.