HAL Id: hal-00492563
https://hal.archives-ouvertes.fr/hal-00492563
Submitted on 1 Jan 2016
HAL is a multi-disciplinary open access
archive for the deposit and dissemination of
sci-entific research documents, whether they are
pub-lished or not. The documents may come from
teaching and research institutions in France or
abroad, or from public or private research centers.
L’archive ouverte pluridisciplinaire HAL, est
destinée au dépôt et à la diffusion de documents
scientifiques de niveau recherche, publiés ou non,
émanant des établissements d’enseignement et de
recherche français ou étrangers, des laboratoires
publics ou privés.
GOMOS-ENVISAT experiment version 5: the noise
issue
Philippe Keckhut, Alain Hauchecorne, Laurent Blanot, K. Hocke, Sophie
Godin-Beekmann, Jean-Loup Bertaux, G. Barrot, E. Kyrölä, A. van Gijsel,
Andrea Pazmino
To cite this version:
Philippe Keckhut, Alain Hauchecorne, Laurent Blanot, K. Hocke, Sophie Godin-Beekmann, et al..
Mid-latitude ozone monitoring with the GOMOS-ENVISAT experiment version 5: the noise issue.
Atmospheric Chemistry and Physics, European Geosciences Union, 2010, 10 (23), pp.11839-11849.
�10.5194/acp-10-11839-2010�. �hal-00492563�
www.atmos-chem-phys.net/10/11839/2010/ doi:10.5194/acp-10-11839-2010
© Author(s) 2010. CC Attribution 3.0 License.
Chemistry
and Physics
Mid-latitude ozone monitoring with the GOMOS-ENVISAT
experiment version 5: the noise issue
P. Keckhut1, A. Hauchecorne1, L. Blanot2, K. Hocke3,4, S. Godin-Beekmann1, J.-L. Bertaux1, G. Barrot2, E. Kyr¨ol¨a5, J. A. E. van Gijsel6, and A. Pazmino1
1LATMOS-IPSL, CNRS/INSU, UMR 8190, UVSQ, UPMC, Guyancourt, France 2ACRI-ST, Sophia Antipolis, Sophia Antipolis, France
3Institute of Applied Physics, University of Bern, Bern, Switzerland
4Oeschger Centre for Climate Change Research, University of Bern, Bern, Switzerland 5FMI, Helsinki, Finland
6RIVM, Bilthoven, The Netherlands
Received: 28 January 2010 – Published in Atmos. Chem. Phys. Discuss.: 15 June 2010 Revised: 27 October 2010 – Accepted: 3 November 2010 – Published: 13 December 2010
Abstract. The GOMOS ozone profiles have been analysed to
evaluate the GOMOS ability to capture the long-term ozone evolution at mid-latitudes during the expected recovery phase of the ozone layer. Version 5 of the operational GOMOS ozone data has been compared with data from two of the longest ground-based instruments based on different tech-niques and already involved with many other previous space instrument validations. Comparisons between ground-based and GOMOS data confirm the occurrence of spurious re-trievals mainly occurring since 2006. Using a selected set of data it is shown that some bad retrievals are induced by the increasing dark charge of the detectors combined with an inadequate method for its correction. This effect does not only induce a continuous bias, but is rather exhibiting a bi-modal distribution including the correct profiles and the bad retrievals. For long-term analyses it is recommended filtering the data according to background light conditions and star temperature (spectrum shape). The new method of the dark charge estimate proposed to be implemented in the version 6 of the ESA algorithm seems to significantly reduce the oc-currence of such effects and should allow to monitor strato-spheric ozone using GOMOS data with greater confidence.
Correspondence to: P. Keckhut
1 Introduction
Since the discovery of the Antarctic ozone hole by Farman et al. (1985) using a ground-based UV spectrometer, there is a growing interest in instruments onboard satellites that can provide observations on a global scale. The early ozone mea-surements from space with the Total Ozone Mapping Spec-trometer (TOMS) confirmed the occurrence of seasonal polar ozone decreases and, in addition, provide the horizontal ex-tension of the ozone hole. While information on the total ozone column allows for monitoring of the potential increase of the solar UV irradiance on the ground, knowledge of the distribution of the changes as a function of altitude is crucial to better understand the processes involved and the climate impact of these changes (WMO, 2007) through the induced radiative and dynamic feedbacks. The two longest records of ozone profiles from space are available from two differ-ent types of instrumdiffer-ent: the Solar Backscatter Ultraviolet (SBUV) satellite instruments and the Stratospheric Aerosol and Gas Experiment (SAGE I + II).
The SBUV/2 instrument is a scanning double monochro-mator measuring backscattered solar radiation in 12 discrete wavelength bands ranging from 252.0 to 339.8 nm. The data are available as partial column ozone layers with vertical res-olution larger than 10 km with a vertical sampling of around 3 km. Furthermore, retrievals are very sensitive to the used a priori profile (Bhartia et al., 2004).
Successive spectrometers cross-adjustments require comparisons with other independent data sources (Petropavlovskikh et al., 2005; Nazaryan and McCormick,
2005; Fioletov et al., 2006; Terao and Logan, 2006) to provide a continuous ozone time series on a consistent scale. The adjustment of the full sequence of the successive NOAA satellites (Stolarski and Frith, 2006) that change every 1–3 years is a good example.
The SAGE measurement technique (McCormick et al., 1989) is based on solar occultation, with ozone profile mea-surements obtained at sunrise and sunset on each of the 14 or-bits per day. This technique provides a relatively high verti-cal resolution (∼1 km) and very small long-term drifts re-sulting from instrument self-calibration. Also measurements are not biased by the diurnal cycle, because they are always performed at the same time according to the solar zenith an-gle. However, horizontal spatial sampling is limited because it requires sunset or sunrise conditions. Continuous mea-surements are obtained within the latitude range of 60◦N
to 60◦S and it takes approximately one month to provide a
quasi-global coverage.
Biases between the SAGE II and some SBUV instruments are reported (Nazaryan and McCormick, 2005; Fioletov et al., 2006; Terao and Logan, 2006). These biases, on the order of several percent, are the largest in the upper strato-sphere and will contribute to differences in trends derived from SAGE II and SBUV data. After further adjustments, both series now converge better about long-term trend es-timates and show both significant declines of around 10– 15% (over the 17 years) since 1995 when averaged over 60◦N–60◦S in the altitudes domain of 35 to 50 km (WMO, 2007) and a decline of up to 10% between 20 and 25 km al-titude during the same period. These decreases did not con-tinue with the same amplitude during the last decade. Solar occultations only provide measurements at sunrise or sunset, which can introduce biases when comparing these data with other datasets due to the ozone photochemical diurnal cycle or indirectly because of temperature tides.
One alternative method, able to potentially provide data both with a good vertical resolution and sufficient hori-zontal sampling, is the stellar occultation technique. In March 2002, ESA has launched an environmental satellite called ENVISAT carrying the GOMOS (Global Ozone Mon-itoring by Occultation of Stars) spectrometer (Bertaux et al., 2004, 2010). One of the main advantages of any occultation method is the self-calibration process (Kyr¨ol¨a et al., 2004). Furthermore, the use of stars compared to the use of the sun as light sources allows the increasing of the suitable num-ber of occultations. The time of measurement, according to the solar diurnal cycle, over a given location, varies slightly more compared to sun occultations but, due to the orbit, re-mains restricted over a reduced range, avoiding aliasing ef-fects with the diurnal cycle. For all these reasons, GOMOS is a good candidate for long-term ozone 4-D distribution mon-itoring from space.
After a few years of operation, the long-term evolution of the ozone profiles provided by GOMOS (version 5) is investigated. The background noise level affects retrieval
analyses and this issue appears to be a critical one for trend estimates, while the noise detector is increasing with time. A new method to remove more noise is accurately de-scribed. Finally, comparisons with two ground-based ozone series at mid-latitude, do not contradict potential biases that exist on the actual retrieval version 5, mainly during the more recent periods as a consequence of the decrease of the detector capabilities.
2 GOMOS ozone retrieval 2.1 Method
The stellar occultation technique was developed several decades ago (Hays and Roble, 1968). It is based on a ref-erence stellar spectrum measured when the star can be seen above the atmosphere. When the line of sight crosses the at-mosphere, the light is observed through the atat-mosphere, and the spectrum is modified by absorption, scattering and refrac-tion. The observed spectra from 248 to 952 nm are spread over several charge coupled devices (CCD) to cover the full spectrum. The UV domain can be used to retrieve ozone. The detailed layout of the GOMOS instrument is described in Bertaux et al. (2001, 2010). The main derived quantity is the transmission along the line of sight that is calculated by dividing the star spectra measured outside and through the atmosphere. The main benefit of this method is based on its independence of the instrumental characteristics and the ratio provides a measurement self-calibrated and free of calibration coefficients. The challenge of the pointing sys-tem consists of keeping the star image in the centre of the slit with a good stability. One of the main characteristics of the star occultation technique concerns the conditions of the measurement that can differ from one occultation to the next. The overall quality of the measurements depends on the sig-nal level and also the contrast of the sigsig-nal compared to the background light. The quality of the measurements is, thus, dependent on different conditions defined by the amount of scattering solar light. Dark conditions provide the lowest noise level and the most accurate measurements. To min-imize noise, the CCD temperature has been reduced. For ozone retrieval, the UV and visible domains, that provide the largest absorption bands, are the most appropriate parts of the spectrum. To gain a good spatial coverage a wide va-riety of stars are used. The onboard calculator selects the “best” stars. Some of them provide a strong UV spectrum favourable for ozone absorption retrieval and some of them exhibit a smaller signal. For signal-to-noise ratio issues, investigations presented here only consider the 70 bright-est stars, as suggbright-ested by Hauchecorne et al. (2005). Dur-ing the ENVISAT commissionDur-ing phase, a large programme of coincident ground-based measurements using lidar, ozone sonde and microwave profilers has been put in place (Meijer et al., 2004) and which is still being continued within the
frame of the EQUAL (Envisat Quality Assessment with Li-dar) ESA project (van Gijsel et al., 2010). All these data permitted to validate the GOMOS previous operational pro-cessor v4.02 ozone profiles and evaluate biases for different conditions. The star temperature and magnitude determine the signal strength of the observed UV spectrum (Kyr¨ol¨a et al., 2006). The magnitude defines the brightness of the star while the temperature is associated with the shape of the spectrum. If the star emission spectrum can be assimilated to the thermal emission of a black body at a given tempera-ture, the wavelength of the maximum emission is linked with this temperature. A high temperature is related to shorter wavelengths and larger UV emission while colder stars emit more in the visible and near infrared regions. Because of the ozone absorption spectrum, the hot and bright stars provide the most favourable conditions for ozone retrieval (Kyr¨ol¨a et al., 2010). Because ozone in the lower stratosphere is very variable (several tenth of %) due to large latitudinal gradients and large-scale filamentary structures extended over conti-nental scales, the collocation is an important issue. Meijer et al. (2004) conducted an intensive programme of valida-tion using a very large number of coincident measurements mainly from NDACC (Network for the Detection of Atmo-spheric Composition Changes) and found that the best com-promise between spatiotemporal differences and the number of profiles is obtained for a matching radius of 800 km and 20 h. During star occultations, the background noises vary to a large extend according to the position of the sun and the limb illumination that is classified into 3 classes: dark, twi-light and daytwi-light. When data are partitioned according to the limb illumination conditions and compared with ground-based measurements, Meijer et al. (2004) found for bright limb conditions a large negative bias of 18–33%. The bias remains when hot stars are used even if it is reduced. Results improve for twilight and even more for dark conditions with biases smaller than 10% and down to 2.5% for some altitude levels. Star magnitude and temperature (related to spectrum shape) seem to be less critical conditions on the data quality of the retrieval given the applied filtering of the data on the reported error (maximum allowed error equal to 20%). This study highlighted the large influence of the limb background level on the retrieval.
2.2 Noise estimate and evolution
One important step in the GOMOS data processing is the re-moval of the background light, coming from the solar light scattered by the atmosphere, and the internal noise of the CCD (dark charge) to extract the star signal. In dark limb conditions, the background light is assumed to be negligible. In the GOmos PRototype code (GOPR) version 6.0, used in the present operational GOMOS-ESA version 5 processing, the CCD dark charge (DC) is estimated using a measurement performed by pointing the GOMOS telescope in a direction without any star in the field-of-view, called the “dark sky
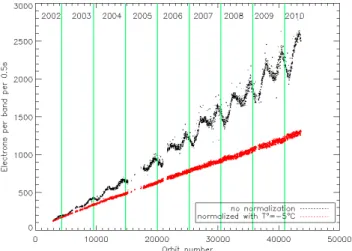
Fig. 1. Dark charge time evolution given by the CCD detector when the instrument is running on a calibration mode when the instrument is not pointing at any star called “dark sky area” measurement (dark dots). The oscillation is due to CCD temperature fluctuations. The normalized noise (red dots) is also indicated. This corresponds to the residual noise after the dark charge noise is corrected for tem-perature effects.
area” (DSA). On each orbit, a dark sky area measurement is planned around the equator and is used to correct all dark limb occultations performed during the same orbit. The noise of a CCD depends exponentially on the local temperature; it roughly doubles every 6–8◦C. In order to take this
tempera-ture effect into account, the temperatempera-ture of the CCD is mea-sured. On GOMOS this measurement is made with a digiti-zation step of 0.4◦C, corresponding to a change of about 4% in dark charge. This digitization effect limits the accuracy of the correction to be applied, especially for high CCD noise.
During the GOMOS life, the average normalized dark charge of the CCD presented a quasi-linear increase starting from very low values in 2002, as shown in Fig. 1. The main reason for this increase is the appearance of “hot pixels” on the CCD with a definitively increased noise after particle pre-cipitations occurring mainly in the South Atlantic Anomaly (Konradi et al., 1994). Another reason is the increase of the average CCD temperature from −6 to 0◦C between 2002 and 2009 induced by the degradation in space (UV exposure) of the CCD surrounding and induced-radiative effects. The evolution of the CCD dark charge and CCD temperature can be followed in the GOMOS Monthly Reports available on: http://earth.esa.int/pcs/envisat/gomos/reports/monthly/. The raw noise evolution indicates, in addition to a linear increase, an annual signal that is related to the position of the sun. The temperature correction removes this effect as well as a part of the linear increase, but the increase of the occurrence of “hot pixels” induces a residual noise increase.
The noise is corrected for the local detector temperature (Fig. 1). However, the digitization sampling (0.4◦C) is not sufficiently resolved to provide a satisfactory correction.
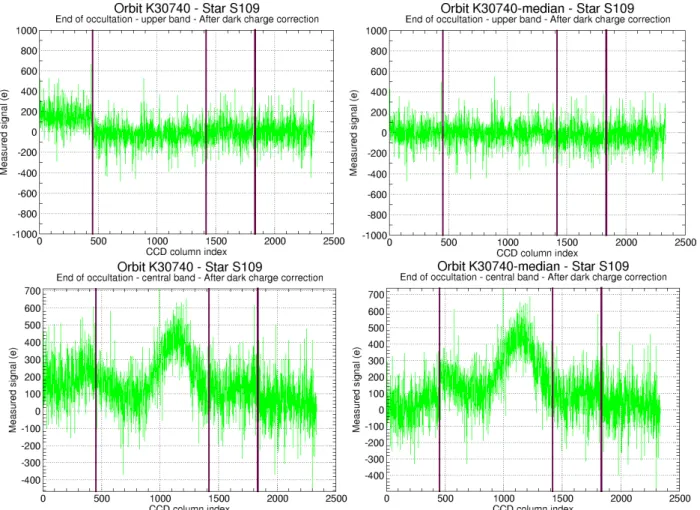
Fig. 2. Dark charge bias correction using two methods and the respective star spectra with noise extraction. Noise estimated for “Dark Sky Area” method GOPR v6.0cf (top left). Example of star spectrum with noise extraction in v6.0cf (bottom left). Noise estimated with side CCDs GOPR v7.0ab (top right). Example of star spectrum with noise extraction in GOPR v7.0ab (bottom right). Vertical black bars indicate the various CCDs. The x-axis indicates the CCD column index. 0 to 445 covers the UV part, 248 to 400 nm; 446 to 1415 covers 675 to
400 nm in reverse order); then from 1416 to 1838 there is the CCD devoted to the O2band around 760 nm, and the one devoted to H2O
around 936 nm, from 1839 up to pixel 2338.
Consequently, because of this stepwise uncertainty, the inac-curacy of the dark charge correction is also increasing pro-portionally to the dark charge increase and has an increasing effect on the evaluation of the star spectrum particularly in the UV for faint stars. In the example, shown in Fig. 2, the estimated background light after dark charge correction in the upper band of the CCD (top left of the figure) deviates from 0 in the UV (CCD columns 1-500), whereas a value near 0 is expected for dark limb measurements. Similarly, the star spectrum (Fig. 2 bottom left) also deviates from 0 in the UV while a value near 0 is expected at the end of the oc-cultation corresponding to a very low tangent altitude. This bad correction of the UV part of the star spectrum may have some effects on the star spectrum estimate and then in the ozone retrieval itself because it is interpreted by the spectral inversion routine as a lack of ozone.
In GOPR version 7.0ab an improved analysis is used to es-timate the dark charge in preparation for the next operational
processor (version 6). In addition to the preceding noise anal-ysis using DSA, another step was added to improve the noise residual using the two side CCDs. The UV flux is estimated to be 0 at lower altitude in upper and lower bands of the CCD and the CCD temperature is estimated assuming that the measured signal is equal to the dark charge. After this adjustment, the star spectrum is close to 0 in the UV (Fig. 2 bottom right part of the figure). The impact on the spectrum in the UV domain is very clear in this new version.
2.3 Impact of the noise on ozone retrieval
When data are processed with the DSA noise extraction method in the GOMOS v5 processor, the ozone density pro-files sometimes show a strong negative bias with the largest amplitude above 50 km (Fig. 3 left). These bad retrievals mainly occur when the noise is large (twilight and bright conditions) and the star signal is low. When the level of the
Fig. 3. O3 line density profiles obtained with a dim star S143
in 2006 using the GOPR v6.0cf processing (left panel) and the same set of profiles re-calculated removing a part of the spectrum (240–280 nm).
star signal is comparable to the noise, an error in the back-ground estimate has a strong impact on the retrieval. The estimated transmission can then be too large or too small. However, negative transmissions are not allowed for physi-cal reasons and so, for this reason, the distribution of bias is not symmetric. We suspect that these negative values are due to the incorrect dark charge correction at the shortest wave-lengths as explained in the previous section. In these cases when the 240–280 nm section of the spectrum is discarded in the retrieval (corresponding pixels are flagged), the retrieved vertical profiles appear to be less biased (Fig. 3 right) while the overall noise of the measurement increases mainly above 70 km because the accuracy of the O3retrieval, in that
alti-tude range, is mainly driven by the low UV part.
The method of improving the ozone retrieval, by reduc-ing the spectral window in the UV domain systematically, is a strong limitation because not all star-occultations were
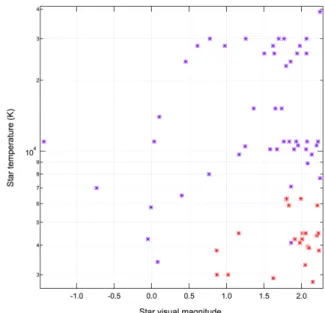
Fig. 4. Diagram of the star temperature (UV spectrum) as a function of star magnitude. Individual tests show that stars that are not both dim and cool, provide the best retrieval conditions. These good stars are indicated with purple asterisks, whereas the “worse retrieval” group is marked with red asterisks.
exhibiting biased ozone profiles. As confirmed in the next section, the bias is not distributed uniformly but rather large biases are reported for some conditions. Those bad retrievals can be visually identified as bad retrievals and removed man-ually from the data series for any inter-annual or climatologic studies. Kyr¨ol¨a et al. (2006) have identified a black list of some stars (18 out of 70) that appear to be suspicious because they provide some bad ozone retrieval, while others seem to be more reliable (Fig. 4). The effect of the background illu-mination condition on the ozone retrieval has been tested us-ing a wide range of ground-based instruments (van Gijsel et al., 2010) showing that the illumination condition is one of the largest source of uncertainties.
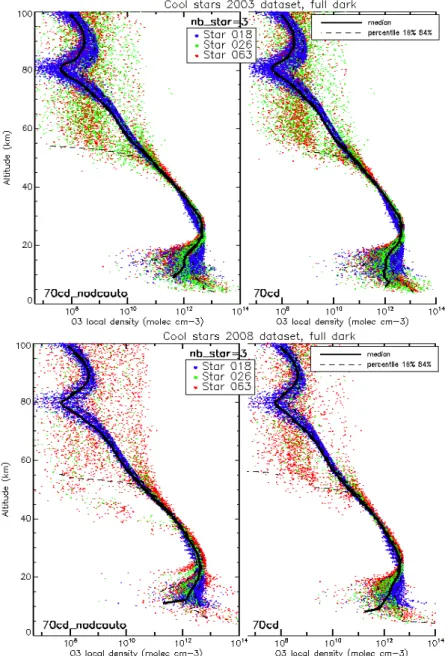
A new alternative GOPR v7.0ab processing including both the DSA background noise estimates and the new baseline noise correction, described in section 2.2, has been proposed for inclusion in the next operational GOMOS processor. As shown in section 2.2, the impact on the Dark Charge esti-mate in the UV range is quite important and improves the star spectrum. Ozone retrievals with this new software have been run for a limited number of stars and periods. For dark conditions, the retrievals with such a new correction show that strongly biased ozone profiles in the altitude range 35 to 55 km are eliminated (Fig. 5). The effect is more evident if cold stars are considered. The effect of the noise algorithm on the 2003 data retrieval for 3 selected cold stars is not obvi-ous, while the retrieval in 2008 with a larger noise shows that most of the spurious values in the range from 35 to 55 km are eliminated as well as in the 20–25 km range. Independently
Fig. 5. O3line density profiles retrieved from occultations of 3 cool stars (smaller luminosity in the UV domain) in 2003 (Top) for dark
background conditions processed with the GOPR v6.0cf algorithm including DSA dark charge estimate (left) and GOPR v7.0ab processing including background bands to better estimate the Dark Charge of the central band (right). Same analyses with the same stars are shown for the 2008 dataset (bottom).
to this miss-retrieval, it is important to evaluate the effect of the noise algorithm on the retrieval during “good” conditions (best star and dark background). If we consider a bright start with a favourable spectrum (star ID 29, β Carinae, magnitude 1.7), the noise algorithm induces some differences from 40 to 60 km smaller than 10% but randomly distributed, while around 15–25 km range, a positive bias is detected for the previous algorithm in comparison with the new one proposed here (Fig. 6). From this figure, we can conclude that the new algorithm should improve the retrieval for any star.
3 Data comparisons
Version 5 of the ESA-GOMOS ozone data has been com-pared with two long datasets that have been comcom-pared with numerous other datasets to estimate mean bias (Dumitru et al., 2006; van Gijsel et al., 2010). Two previously used instruments of the different techniques located at mid-latitude are used here: lidar at Observatory of haute-Provence and microwave spectrometer at Hohenpeissenberg. The two instruments provide different characteristics and altitude range. Microwave spectrometers do not exhibit fine vertical
Fig. 6. O3line density profiles retrieved from occultations of one
star with a favourable spectrum and luminosity conditions for dark background conditions processed with the GOPR v6.0cf algorithm including DSA dark charge estimate (red) and GOPR v7.0ab pro-cessing including background bands to better estimate the Dark Charge of the central band (blue).
resolution, but fit the GOMOS altitude range 20–80 km and of which especially the upper part presents the only avail-able validation source. Lidar has a better vertical resolution mainly in the lower stratosphere, but is limited to the lower part (15–45 km). This section does not intend to present a large scale validation of GOMOS using a larger set of instru-ments as this is covered by other publications (e.g., Meijer et al., 2004; Mze et al., 2010; van Gijsel et al., 2010). Here the main objective consists of assessing the long-term evolution and confirming the validity of the tests presented previously in Sect. 2.
In the framework of the Network of Detection of Atmo-spheric Composition Changes (Kurylo and Salomon, 1990), some instruments providing ozone profiles are and have been running systematically over the decades. Many satellite in-strument validations and long-term investigations were per-formed giving large confidences and those instruments have participated in regular cross-validation exercises (see, for in-stance, Keckhut et al., 2004) and continue to do so. The com-plementary lidar and microwave instruments from the Alpine stations used for comparisons with GOMOS profiles were selected here because of their high quality data and because the mid-latitude region offers a good coverage of GOMOS observations in dark limb.
The GOMOS data selection was performed in a space box of ±10◦ in latitude and ±20◦ longitude from the two
sta-tions. The brightest stars (stars ID from 1 to 70) have been selected because the retrieval is theoretically more accurate (Kyr¨ol¨a et al., 2006).
3.1 Comparison with the Bern Microwave
The ground-based microwave radiometer GROMOS is lo-cated at Bern (46◦570N, 7◦260E) in Switzerland and ob-serves the middle atmosphere at an elevation angle of 40◦in the north-east direction (Peter, 1997). GROMOS measures the vertical ozone distribution from 20 to 70 km altitude un-der almost all weather conditions during the day and night since 1994. The instrument is a triple switched 142.175 GHz total power radiometer. The continuous time series of ozone profiles from GROMOS are regularly used for satellite val-idations and ozone trend studies (Steinbrecht et al., 2009; Dumitru et al., 2006).
The intercomparison of ozone profiles from GOMOS and GROMOS is similarly performed as the intercomparison of ozone profiles from GOMOS and the ground-based mi-crowave radiometer SOMORA at Payerne as described by Hocke et al. (2007). The high-resolution ozone profiles of GOMOS are adjusted by averaging kernel smoothing to the vertical resolution (about 10 km) of GROMOS. The coinci-dent profile pairs of GOMOS and GROMOS exhibit a mean time difference 1t < 1 h and a mean horizontal distance of the sounding volumes d < 800 km. The relative difference in the profile of ozone concentration from GOMOS and GRO-MOS is given by:
1O3=[O3(GOMOS)−O3(GROMOS)]/O3(GROMOS). (1)
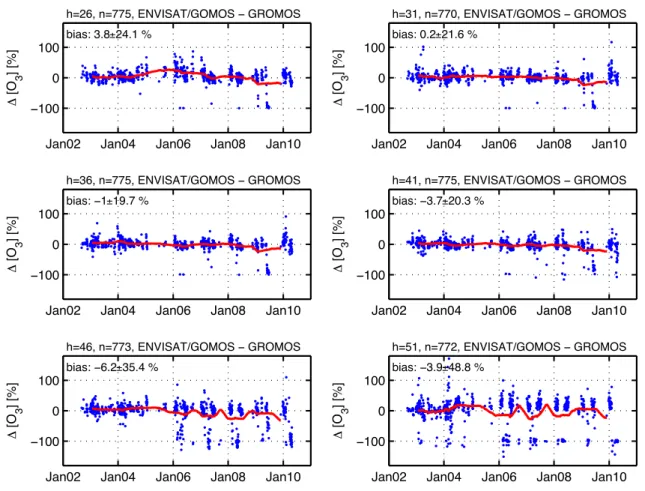
Figure 7 shows the time series of 1O3 at altitudes
h =26,31,36,41,46, and 51 km for the time interval 2002 to 2006. The number of coincident profile pairs (blue dots in Fig. 7) lies between 770 and 775. The mean biases are ranging between −6.2% and 3.8%. The best agreement is achieved at altitudes from 36 to 41 km. The running mean in-dicates a gradual increase of ozone differences with values of nearly −100% that occur more frequently in the stratopause region (lower panels of Fig. 7). These outliers are caused by unrealistic small values of ozone density as sometimes mea-sured by the CCD of ENVISAT/GOMOS. In 2005 to 2006, positive biases (20%) are reported at 26 km that do not exist after 2008. A smaller bias over the 31–41 km range and a larger negative bias over the 46–51 km range (20%) can be noted. The comparisons reveal that the biases are not sys-tematic but are partitioned in two classes of profiles with one fully unreliable. This conducts as a bimodal distribution of the differences with increasing occurrence of spurious pro-files. The class of GOMOS profiles presenting a large nega-tive difference with the GROMOS microwave data is clearly related with the class of profiles with a strong negative bias shown in Figs. 3 and 5.
3.2 Comparisons with the OHP Lidar
The ozone lidar measurements are performed using the DIAL method, which requires the emission of two laser wavelengths with different ozone absorption cross-sections.
Jan02 Jan04 Jan06 Jan08 Jan10 ï100 0 100 h=26, n=775, ENVISAT/GOMOS ï GROMOS 6 [O 3 ] [%] bias: 3.8±24.1 %
Jan02 Jan04 Jan06 Jan08 Jan10 ï100 0 100 h=31, n=770, ENVISAT/GOMOS ï GROMOS 6 [O 3 ] [%] bias: 0.2±21.6 %
Jan02 Jan04 Jan06 Jan08 Jan10 ï100 0 100 h=36, n=775, ENVISAT/GOMOS ï GROMOS 6 [O 3 ] [%] bias: ï1±19.7 %
Jan02 Jan04 Jan06 Jan08 Jan10 ï100 0 100 h=41, n=775, ENVISAT/GOMOS ï GROMOS 6 [O 3 ] [%] bias: ï3.7±20.3 %
Jan02 Jan04 Jan06 Jan08 Jan10 ï100 0 100 h=46, n=773, ENVISAT/GOMOS ï GROMOS 6 [O 3 ] [%] bias: ï6.2±35.4 %
Jan02 Jan04 Jan06 Jan08 Jan10 ï100 0 100 h=51, n=772, ENVISAT/GOMOS ï GROMOS 6 [O 3 ] [%] bias: ï3.9±48.8 %
Fig. 7. Time series of the relative difference 1O3of the ozone concentration profiles of GOMOS and the ground-based microwave radiometer
GROMOS at altitudes h = 26,31,36,41,46, and 51 km. The red line is a moving average over 80 blue dots. Sometimes GOMOS fails to
detect ozone at upper altitudes (more frequently at h = 46 and 51 km with 1O3values close to −100%). N corresponds to the number of
collocations.
Range resolved measurements are obtained with the use of pulsed lasers. The spectral range of the laser beams is cho-sen in the ultraviolet region where ozone absorption is the most efficient. In the case of the OHP lidar, the absorbed ra-diation is emitted by a XeCl excimer laser at 308 nm and the reference line is provided by the third harmonic of a Nd:Yag laser at 355 nm (Godin et al., 1989). The reception system includes 4 telescopes of 50 cm diameter with optical fibres mounted in the focal plane in order to collect the laser light and a spectrometer to separate the various detected wave-lengths. Photon-counting is used for the acquisition of the lidar signals. The large dynamic range of the signals is han-dled by separating each return signal into a low and a high-sensitivity channel for the measurement of ozone in the low and middle-high stratosphere, respectively. The ozone num-ber density is computed from the differentiation of the sig-nals. Two additional wavelengths corresponding to the first Stokes vibrational Raman scattering by atmospheric nitrogen of the laser beams are detected in order to retrieve ozone in case of (volcanic) aerosol loading, (McGee et al., 1993). The lidar measurements are performed during the night and
typi-cally last several hours, which results in a horizontal spatial resolution of about 100 km, depending on atmospheric con-ditions. The vertical resolution has to be reduced as a func-tion of altitude due to the decreasing signal-to-noise ratio. It ranges from several hundreds of metres in the lower altitude range to several kilometres above 40 km. The total accuracy ranges from about a few percent below 20 km to more than 10% above 45 km (Godin-Beekmann et al., 2003). Data ob-tained with the current lidar setup have been validated using the NASA mobile lidar (Braathen et al., 2004; Keckhut et al., 2004). The lidar in the present configuration has been operated routinely at OHP since 1994. First stratospheric ozone lidar measurements were performed with a simpler system at OHP in campaign mode in 1985 and 1986. Routine measurements were obtained with the simpler system from 1986 to 1993. The OHP ozone data have been compared to various satellite measurements such as SAGE II, MLS-UARS, GOME, GOMOS, MIPAS, SCIAMACHY (Meijer et al., 2004, 2006; Brinksma et al., 2006; Cortesi et al., 2007; Iapaolo et al., 2007; Jiang et al., 2007; Rozanov et al., 2007; van Gijsel et al., 2009).
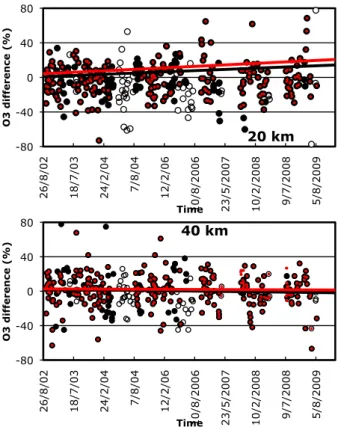
P. Keckhut et al.: Mid-latitude ozone monitoring with the GOMOS-ENVISAT experiment version 5 11847 -80 -40 0 40 80 26/8/02 18/7/03 24/2/04 7/8/04 12/2/06 10/8/2006 23/5/2007 10/2/2008 9/7/2008 5/8/2009 O 3 d if fe re n ce ( %) Time 20 km -80 -40 0 40 80 26/8/02 18/7/03 24/2/04 7/8/04 12/2/06 10/8/2006 23/5/2007 10/2/2008 9/7/2008 5/8/2009 O 3 d if fe re n ce ( %) Time 40 km -80 -40 0 40 26/8/02 18/7/03 24/2/04 7/8/04 12/2/06 10/8/2006 23/5/2007 10/2/2008 9/7/2008 5/8/2009 O 3 d if fe re n ce ( %) Time 20 km -80 -40 0 40 80 26/8/02 18/7/03 24/2/04 7/8/04 12/2/06 10/8/2006 23/5/2007 10/2/2008 9/7/2008 5/8/2009 O 3 d if fe re n ce ( %) Time 40 km
Fig. 8. Data comparison between GOMOS and the OHP DIAL lidar at 20 km (a) and 40 km (b). Open circles correspond to the bright and twilight illumination conditions while black dots correspond to dark conditions. The best stars (Fig. 6) are also highlighted with red dots in the centre. Lines correspond to root mean squared linear regressions for only dark sky observation conditions (black) and in addition for the selected stars (red).
Comparisons between lidar and GOMOS ozone profiles have been performed with the similar methodology described previously and exhibit a variability of nearly ±20%. Again, more negative biases due to “bad” GOMOS retrievals appear more frequently after 2006, mainly at 40 km and less pro-nounced at 20 km. Most of the bias profiles correspond to the noisier spectra obtained during twilight and bright con-ditions. When full dark conditions are selected no trends are reported at 40 km (Fig. 8) in agreement with simula-tions shown in Fig. 5. However, at 20 km a positive residual trends of more than 10%/decade is reported also in agree-ment with simulations using a star presenting an adapted spectrum (Fig. 6). When best stars are selected the trend amplitude decreases at 20 km while at 40 km it remains un-changed and the decrease of the variability expected from Fig. 6 is not significantly observed here.
4 Conclusions
Biases are detected in the operational GOMOS version 5 (corresponding to GOPR v6.0cf) ozone data when compared to data from the ground-based validated NDACC lidar at
OHP and the microwave profiles at the Alpine station near Bern, both sites in the northern mid-latitude. While the first years of GOMOS operation seem to reveal a good agree-ment between the ground-based and GOMOS measureagree-ments, some large biases are observed after 2006 when more fre-quent unrealistic GOMOS retrieval are observed. These dif-ferences are primarily due to bad retrieval cases correspond-ing to some star occultations exhibitcorrespond-ing weak UV signals and large background noise conditions. Analyses of a selected dataset show that some biases can be due to an imperfect dark charge correction of the CCD coupled with the regular dark charge increase. The distribution of the ozone profiles exhibits a clear bimodal structure in the 35–55 km and 15– 25 km altitude range that allows a straightforward detection of bad retrievals.
A new dark charge correction algorithm has been tested in the prototype processor GOPR v7.0ab. The preliminary com-parisons with a subset of data show that the retrieval greatly improves the quality of GOMOS ozone profiles mainly for cold stars. For the “best” stars the new noise algorithm is expected to decrease the noise in the range 35–55 km and to remove bias around 20 km. At that time, resulting bi-ases in the ozone series do not allow the deriving of long-term ozone change with the operational GOMOS version 5 dataset regarding the data quality. One possibility in dealing with this version of the data processing consists of removing measurements obtained from bright background conditions and eliminating some stars providing low signals mainly in the UV domain important for accurate ozone retrieval. How-ever, this will reduce the number of measurements. HowHow-ever, the reduction of data will be limited while the onboard algo-rithm that selects occultation cases use preferentially “best” star available. A full comparison of the next version of the ESA-processed GOMOS data with a larger set of NDACC validation instruments should be done after the reprocessing with the new operational algorithm (version 6), which should take place in 2010. This work also pointed out the impor-tance of long-term validation of satellite data with ground-based network as provide by NDACC.
Acknowledgements. This work was performed under the frame-work of the European Integrated Project Geomon selected by the 6th Framework Program (contract number FOP6-2005-Global-4-036677) and by the MeteoSwiss project MIMAH. The French team was supported for ENVISAT validation by the French Na-tional Space Agency CNES (Centre NaNa-tional d’Etudes Spatiales). Ground-based data used in this publication were obtained as part of the Network of the Detection of the Atmospheric Com-position Changes (NDACC) and are publicly available through the NDACC/NOAA web site (http://www.ndsc.ncep.noaa.gov) and through the French ETHER web site (http://ether.ipsl.jussieu.fr/). Lidar data were also supported by the European Space Agency (ESA) through the Envisat Quality Assessment with Lidar ESA project (EQUAL), dedicated to the long-term validation of ozone and temperature profile data from all three atmospheric-chemistry instruments (GOMOS, MIPAS and SCIAMACHY) carried on
Envisat and its follow-up to the “Validation with lidar” project (VALID) with a multi-mission focus and extension with the vali-dation of aerosol and cloud properties.
The authors would like to thank both reviewers for their useful comments.
Edited by: P. Bernath
The publication of this article is financed by CNRS-INSU.
References
Bertaux, J. L., Chipperfeld, M., Dalaudier, F., Fussen, D., Hauchecorne, A., Kyr¨ol¨a, E., Leppelmeier, G., and Roscoe, H. K.: Envisat GOMOS, An Instrument for Global Atmospheric Ozone Monitoring, ESA SP-1244 coordinated by: Readings, C. J. and Wehr, T., 2001.
Bertaux, J.-L., Hauchecorne, A., Dalaudier, F., Cot, C., Kyr¨ol¨a, E., Fussen, D., Tamminen, J., Leppelmeier, G.-W., Sofieva, V., Has-sinen, S., Fanton d’Andon, O., Barrot, G., Mangin, A., Th´eodore, B., Guirlet, M., Korablev, O., Snoeij, P. R., Koopman, R., and Fraisse, R.: First results on GOMOS/ENVISAT, Adv. Space Res., 33(7), 1029–1035, 2004.
Bertaux, J. L., Kyr¨ol¨a, E., Fussen, D., Hauchecorne, A., Dalaudier, F., Sofieva, V., Tamminen, J., Vanhellemont, F., Fanton d’Andon, O., Barrot, G., Mangin, A., Blanot, L., Lebrun, J. C., P´erot, K., Fehr, T., Saavedra, L., and Fraisse, R.: Global ozone monitoring by occultation of stars: an overview of GOMOS measurements on ENVISAT, Atmos. Chem. Phys. Discuss., 10, 9917–10076, doi:10.5194/acpd-10-9917-2010, 2010.
Bhartia, P., Wellemeyer, K., Taylor, C., Nath, S. L., and Gopalan, A.: Solar Backscatter Ultraviolet (SBUV) version 8 profile al-gorithm, in: Proceedings of the Quadrennial Ozone Symposium, 2004, edited by: Zerefos, C., Int. Ozone Comm., Athens, Greece, 295–296, 2004.
Braathen, G. O., Godin-Beekmann, S., Keckhut, P., McGee, T. J., Gross, M. R., Vialle, C., and Hauchecorne, A.: Intercompari-son of stratospheric ozone and temperature measurements at the Observatoire de Haute Provence during the OTOIC NDSC vali-dation campaign from 1-18 July 1997, Atmos. Chem. Phys. Dis-cuss., 4, 5303–5344, doi:10.5194/acpd-4-5303-2004, 2004. Brinksma, E. J., Bracher, A., Lolkema, D. E., Segers, A. J., Boyd, I.
S., Bramstedt, K., Claude, H., Godin-Beekmann, S., Hansen, G., Kopp, G., Leblanc, T., McDermid, I. S., Meijer, Y. J., Nakane, H., Parrish, A., von Savigny, C., Stebel, K., Swart, D. P. J., Taha, G., and Piters, A. J. M.: Geophysical validation of SCIA-MACHY Limb Ozone Profiles, Atmos. Chem. Phys., 6, 197– 209, doi:10.5194/acp-6-197-2006, 2006.
Cortesi, U., Lambert, J. C., De Clercq, C., Bianchini, G., Blumen-stock, T., Bracher, A., Castelli, E., Catoire, V., Chance, K. V., De Mazi´ere, M., Demoulin, P., Godin-Beekmann, S., Jones, N., Jucks, K., Keim, C., Kerzenmacher, T., Kuellmann, H.,
Kut-tippurath, J., Iarlori, M., Liu, G. Y., Liu, Y., McDermid, I. S., Meijer, Y. J., Mencaraglia, F., Mikuteit, S., Oelhaf, H., Pic-colo, C., Pirre, M., Raspollini, P., Ravegnani, F., Reburn, W. J., Redaelli, G., Remedios, J. J., Sembhi, H., Smale, D., Steck, T., Taddei, A., Varotsos, C., Vigouroux, C., Waterfall, A., Wetzel, G., and Wood, S.: Geophysical validation of MIPAS-ENVISAT operational ozone data, Atmos. Chem. Phys., 7, 4807–4867, doi:10.5194/acp-7-4807-2007, 2007.
Dumitru, D., Hocke, C. K., K¨ampfer, N., and Calisesi, Y.: Com-parison and validation studies related to ground-base microwave observations of ozone in the stratosphere and mesosphere, J. At-mos. Sol.-Terr. Phy., 68(7), 745–756, 2006.
Farman, J. C. and Shanklin, J. D.: Large losses of total ozone in
Antarctica reveal seasonal ClOx/NOx interaction, Nature, 315,
207–10, 1985.
Fioletov, V. E., Tarasick, D. W., and Petropavlovskikh, I.: Es-timating ozone variability and instrument uncertainties from SBUV(/2), ozonesonde, Umkehr, and SAGE II measure-ments: Shortterm variations, J. Geophys. Res., 111, D02305, doi:10.1029/2005JD006340, 2006.
Godin, S., M´egie, G., and Pelon, P.: Systematic Lidar Measure-ments of the Stratospheric Ozone vertical Distribution, Geophys. Res. Lett., 16(16), 547–550, 1989.
Godin-Beekmann, S., Porteneuve, J., and Garnier, A.: Systematic DIAL ozone measurements at Observatoire de Haute-Provence, J. Env. Monitoring, 5, 57–67, 2003.
Hauchecorne, A., Bertaux, L., Dalaudier, F., Cot, C., Lebrun J.-C., Bekki, S., Marchand, M., Kyr¨ol¨a, E., Tamminen, J., Sofieva, V., Fussen, D., Vanhellemont, F., Fanton d’Andon, O., Barrot, G., Mangin, A., Th´eodore, B., Guirlet, M., Snoeij, P., Koop-man, R., Saavedra de Miguel, L., Fraisse, R., and Renard,
J.-B.: GOMOS NO2 NO3: First simultaneous global
clima-tologies of night-time stratospheric NO2and NO3observed by
GOMOS/ENVISAT in 2003, J. Geophys. Res., 110, D18301, doi:10.1029/2004JD005711, 2005.
Hays, P. B. and R. G. Roble: Stellarspectra and atmospheric com-position, J. Atmos. Sci., 25, 1141–1153, 1968.
Hocke, K., K¨ampfer, N., Ruffieux, D., Froidevaux, L., Parrish, A., Boyd, I., von Clarmann, T., Steck, T., Timofeyev, Y. M., Polyakov, A. V., and Kyr¨ol¨a, E.: Comparison and synergy of stratospheric ozone measurements by satellite limb sounders and the ground-based microwave radiometer SOMORA, At-mos. Chem. Phys., 7, 4117–4131, doi:10.5194/acp-7-4117-2007, 2007.
Iapaolo M., Godin-Beekmann, S., Del Frate, S., Casadio, F., Mc-Dermid, S., M., Leblanc, T., Swart, D., Meijer, Y., Hansen,
G., and Stebel, K.: Gome Ozone Profiles Retrieved By
Neural Network Techniques: A Global Validation With Li-dar Measurements, J. Quant. Spectrosc. Ra., 107, 105–119, doi:10.1016/j.jqsrt.2007.02.015, 2007
Jiang, Y. B., Froidevaux, L., Lambert, A., Livesey, N. J., Al-laart, M., and Kelder, H.: Validation of Aura Microwave Limb Sounder Ozone by ozonesonde and lidar measurements, J. Geo-phys. Res.,112, D24S34, doi:10.1029/2007JD008776, 2007. Keckhut, P., McDermid, S., Swart, D., McGee, T.,
Godin-Beekmann, S., Adriani, A., Barnes, J., Baray, J.-L., Bencherif, H., Claude, H., Fiocco, G., Hansen, G., Hauchecorne, A., Leblanc, T., Lee, C. H., Pal, S., Megie, G., Nakane, H., Neu-ber, R., Steinbrecht, W., and Thayer, J.: Review of ozone and
temperature lidar validations performed within the framework of the network for the detection of stratospheric change, J. Environ. Monit., 6, 721–733, 2004.
Konradi, A., Badhwar, G. D., and Braby, L. A.: Recent space shuttle observations of the South Atlantic Anomaly and radiation belt models, Adv. Space Res., 14(10), 911–921, 1994.
Kurylo, M. J. and Solomon, S.: Network for the Detection of Strato-spheric Change, NASA Rep, Code EEU, 1990.
Kyr¨ol¨a, E., Tamminen, J., Leppelmeier, G. W., Sofieva, V., Has-sinen, S., Bertaux, J. L., Hauchecorne, A., Dalaudier, F., Cot, C., Korablev, O., FantonD’Andon, O., Barrot, G., Mangin, A., Th´eodore, B., Guirlet, M., Etanchaud, F., Snoeij, P., Koopman, R., Saavedra, L., Fraisse, R., Fussen, D., Vanhellemont, F.: GO-MOS on Envisat: An overview, Adv. Space Res., 33, 1020–1028, 2004.
Kyr¨ol¨a, E., Tamminen, J., Leppelmeier, G. W., Sofieva, V., Hassinen, S., Sepp”al”a, A., Verronen, P. T., Bertaux, J.-L., Hauchecorne, A., Dalaudier, F., Fussen, D., Vanhellemont, F. Fanton d’Andon, O., Barrot, G., Mangin, A., Theodore, B., Guir-let, M., Koopman, R., Saavedra, L., Snoeij, P., and Fehr, T.: Nighttime ozone profiles in the stratosphere and mesosphere by the Global Ozone Monitoring by Occultation of Stars on Envisat, J. Geophys. Res., 111, D24306, doi:10.1029/2006JD007193, 2006.
Kyr¨ol¨a, E., Tamminen, J., Sofieva, V., Bertaux, J. L., Hauchecorne, A., Dalaudier, F., Fussen, D., Vanhellemont, F., Fanton d’Andon, O., Barrot, G., Guirlet, M., Mangin, A., Blanot, L., Fehr, T., Saavedra de Miguel, L., and Fraisse, R.: Retrieval of atmospheric parameters from GOMOS data, Atmos. Chem. Phys. Discuss., 10, 10145–10217, doi:10.5194/acpd-10-10145-2010, 2010. McCormick, M. P., Zawodny, J. M., Veiga, R. E., Larsen, J. C., and
Wang, P.-H.: An Overview of SAGE I and II Ozone Measure-ments, Planet. Space Sci., 37(12), 1567–1586, 1989.
McGee, T. J., Gross, M., Ferrare, R., Heaps, W. S., and Singh, U. N.:Raman DIAL measurements of Stratospheric Ozone in the presence of volcanic aerosols, Geophys. Res. Lett., 20, 955–958, 1993.
Meijer, Y. J., Swart, D. P. J., Allaart, M., Andersen, S. B., Bodeker, G., Boyd, I., Braathen, G., Calisesi, Y., Claude, H., Dorokhov, V., von der Gathen, P., Gil, M., Godin-Beekmann, S., Goutail, F., Hansen, G., Karpetchko, A., Keckhut, P., Kelder, H. M., Koele-meijer, R., Kois, B., Koopman, R. M., Kopp, G., Lambert, J.-C., Leblanc, T., McDermid, I. S., Pal, S., Schets, H., Stubi, R., Suortti, T., Visconti, G., and Yela, M.: Pole-to-pole valida-tion of Envisat GOMOS ozone profiles using data from ground-based and balloon sonde measurements, J. Geophys. Res., 109, D23305, doi:10.1029/2004JD004834, 2004.
Meijer, Y. J., Swart, D. P. J., Baier, F., Bhartia, P. K., Bodeker, G. E., Casadio, S., Chance, K., Del Frate, F., Erbertseder, T., Flynn, L. E., Godin-Beekmann, S., Hansen, G., Hasekamp, O. P., Kaifel, A., Kelder, H. M., Kerridge, B. J., Lambert, J.-C., Landgraf, J., Latter , B., Liu, X., Mcdermid, I. S., M¨uller , M. D., Pachepsky, Y., Rozanov, V., Siddans, R., Tellmann, S., Van Der A , R. J., Van Oss, R. F., Weber, M., and Zehner, C.: Evaluation of GOME ozone profiles from nine different algorithms, J. Geophys. Res., 111, D21306, doi:10.1029/2005JD006778, 2006.
Mze, N., Hauchecorne, A., Bencherif, H., Dalaudier, F., and Bertaux, J.-L.: Climatology and comparison of ozone from ENVISAT/GOMOS and SHADOZ/balloon-sonde observations
in the southern tropics, Atmos. Chem. Phys., 10, 8025–8035, doi:10.5194/acp-10-8025-2010, 2010.
Nazaryan, H. and McCormick, M. P.: Comparisons of Strato-spheric Aerosol and Gas Experiment (SAGE II) and So-lar Backscatter Ultraviolet Instrument (SBUV/2) ozone pro-files and trend estimates, J. Geophys. Res., 110, D17302, doi:10.1029/2004JD005483, 2005.
Peter, R.: The Ground-based Millimeter-wave Ozone Spectrome-ter – GROMOS, IAP Research Report, No. 1997-13, Institut f¨ur angewandte Physik, Universit¨at Bern, 1997.
Petropavlovskikh, I., Bhartia, P. K., and DeLuisi J.: New
Umkehr ozone profile retrieval algorithm optimized for
cli-matological studies, Geophys. Res. Lett., 32, L16808,
doi:10.1029/2005GL023323, 2005.
Rozanov, A., Eichmann, K.-U. , von Savigny, C., Bovensmann, H., Burrows, J.P., von Bargen, A., Doicu, A., Hilgers, S,. Godin-Beekmann, S., Leblanc, T., and McDermid, I.S..: Comparison of the inversion algorithms applied to the ozone vertical profile retrieval from SCIAMACHY limb measurements, Atmos. Chem. Phys., 7, 4763–4779, 2007,
http://www.atmos-chem-phys.net/7/4763/2007/.
Steinbrecht, W., Claude, H., Sch¨onenborn, F., McDermid, I. S., Leblanc, T., Godin-Beekmann, S., Keckhut, P., Hauchecorne, A., van Gijsel, J. A. E., Swart, D. P. J., Bodeker, G. E., Par-rish, A. Boyd, I. S., K”ampfer, N., Hocke, K., Stolarski, R. S., Frith, S. M., Thomason, L. W., Remsberg, E. E., von Savigny, C., Rozanov, A., and Burrows, J. P.: Ozone and temperature trends in the upper stratosphere at five stations of the Network for the Detection of Atmospheric Composition Change, Int. J. Remote Sens., 30, 3875–3886, 2009.
Stolarski, R. S. and Frith, S. M.: Search for evidence of trend slow-down in the long-term TOMS/SBUV total ozone data record: the importance of instrument drift uncertainty, Atmos. Chem. Phys., 6, 4057–4065, doi:10.5194/acp-6-4057-2006, 2006.
Terao, Y. A. and Logan, J. A.: Effect of Lower Stratospheric Ozone on Trends and Interannual Variability in Tropospheric Ozone, AGU Fall Meeting, 11–15 December 2005 (San Fran-cisco, USA), 2006.
van Gijsel, J. A. E., Swart, D. P. J., Baray, J.-L., Claude, H., Fehr, T., Von Der Gathen, P., Godin-Beekmann, S., Hansen, G. H., Leblanc, T., McDermid, I. S., Meijer, Y. J., Nakane, H., Quel, E. J., Steinbrecht, W., Strawbridge, K. B., Tatarov, B., and Wol-fram, E. A.: Global validation of ENVISAT ozone profiles using lidar measurements, Int. J. Remote Sens., 30, 3987–3994, 2009, doi:10.1080/01431160902821825.
van Gijsel, J. A. E., Swart, D. P. J., Baray, J.-L., Bencherif, H., Claude, H., Fehr, T., Godin-Beekmann, S., Hansen, G. H., Keck-hut, P., Leblanc, T., McDermid, I. S., Meijer, Y. J., Nakane, H., Quel, E. J., Stebel, K., Steinbrecht, W., Strawbridge, K. B., Tatarov, B. I., and Wolfram, E. A.: GOMOS ozone pro-file validation using ground-based and balloon sonde measure-ments, Atmos. Chem. Phys., 10, 10473–10488, doi:10.5194/acp-10-10473-2010, 2010.
WMO (World Meteorological Organization), Scientific Assessment of Ozone Depletion: 2006, Global Ozone Research and Monitor-ing Project – Report No. 50, 572 pp., Geneva, 2007.