HAL Id: hal-00295456
https://hal.archives-ouvertes.fr/hal-00295456
Submitted on 28 Jun 2004
HAL is a multi-disciplinary open access
archive for the deposit and dissemination of
sci-entific research documents, whether they are
pub-lished or not. The documents may come from
teaching and research institutions in France or
abroad, or from public or private research centers.
L’archive ouverte pluridisciplinaire HAL, est
destinée au dépôt et à la diffusion de documents
scientifiques de niveau recherche, publiés ou non,
émanant des établissements d’enseignement et de
recherche français ou étrangers, des laboratoires
publics ou privés.
in Ny-Ålesund - Radiative transfer studies and their
application
F. Wittrock, H. Oetjen, A. Richter, S. Fietkau, T. Medeke, A. Rozanov, J. P.
Burrows
To cite this version:
F. Wittrock, H. Oetjen, A. Richter, S. Fietkau, T. Medeke, et al.. MAX-DOAS measurements of
atmospheric trace gases in Ny-Ålesund - Radiative transfer studies and their application. Atmospheric
Chemistry and Physics, European Geosciences Union, 2004, 4 (4), pp.955-966. �hal-00295456�
Atmos. Chem. Phys., 4, 955–966, 2004 www.atmos-chem-phys.org/acp/4/955/ SRef-ID: 1680-7324/acp/2004-4-955
Atmospheric
Chemistry
and Physics
MAX-DOAS measurements of atmospheric trace gases in
Ny- ˚
Alesund - Radiative transfer studies and their application
F. Wittrock, H. Oetjen, A. Richter, S. Fietkau, T. Medeke, A. Rozanov, and J. P. BurrowsInstitute of Environmental Physics, University of Bremen, Bremen, Germany
Received: 20 October 2003 – Published in Atmos. Chem. Phys. Discuss.: 5 December 2003 Revised: 22 June 2004 – Accepted: 23 June 2004 – Published: 28 June 2004
Abstract. A new approach to derive tropospheric
concen-trations of some atmospheric trace gases from ground-based UV/vis measurements is described. The instrument, referred to as the MAX-DOAS, is based on the well-known UV/vis instruments, which use the sunlight scattered in the zenith sky as the light source and the method of Differential Optical Absorption Spectroscopy (DOAS) to derive column amounts of absorbers like ozone and nitrogen dioxide. Substantial en-hancements have been applied to this standard setup to use different lines of sight near to the horizon as additional light sources (MAX – multi axis). Results from measurements at Ny- ˚Alesund (79◦N, 12◦E) are presented and interpreted with the full-spherical radiative transfer model SCIATRAN. In particular, measurements of the oxygen dimer O4 which
has a known column and vertical distribution in the atmo-sphere are used to evaluate the sensitivity of the retrieval to parameters such as multiple scattering, solar azimuth, surface albedo and refraction in the atmosphere and also to validate the radiative transfer model. As a first application, measure-ments of NO2 emissions from a ship lying in Ny- ˚Alesund
harbour are presented. The results of this study demonstrate the feasibility of long term UV/vis multi axis measurement that can be used to derive not only column amounts of dif-ferent trace gases but also some information on the vertical location of these absorbers.
1 Introduction
In recent years, ground-based UV/visible measurements of light scattered in the zenith sky have been used to derive at-mospheric columns for a number of important atat-mospheric trace species such as O3, NO2, BrO, OClO, and also O4
(e.g. Noxon, 1975; Noxon et al., 1978; Solomon et al., 1987; Correspondence to: F. Wittrock
(folkard@iup.physik.uni-bremen.de)
Johnston and McKenzie, 1989; van Roozendael et al., 1994; Richter et al., 1999; Wittrock et al., 2000; Frieß et al., 2001; Tørnkvist et al., 2002). Most of these measurements were focused on stratospheric ozone chemistry in middle and high latitudes, and the DOAS technique in the conventional setup is most sensitive to this altitude region, in particular at low sun. However, technical improvements described in this pa-per, now also allow monitoring of trace gases mainly located in the troposphere and the distinction of tropospheric and stratospheric column amounts. The main idea is that mea-surements taken with a telescope pointed towards different elevation angles close to the horizon provide information on the lowest atmospheric layers and in combination with the zenith sky measurement can be used to derive a coarse ver-tical profile of some absorbers. Observations of the bright horizon (“off-axis”) were originally proposed and performed to improve the signal to noise ratio of stratospheric measure-ments under very low daylight conditions, e.g. twilight ob-servations in polar regions (Sanders et al., 1993; Miller et al., 1997). In contrast to these studies and also related ones using a fixed viewing angle, the system used in this work has the capability to switch between several directions within a short time period to provide quasi simultaneous measurements in different lines of sight. Similar set-ups have also been devel-oped by other groups (H¨onninger and Platt, 2002; Bobrowski et al., 2003; Leser et al., 2003; van Roozendael et al., 2003). Here we report on long-term measurements from our instru-ment installed in Ny- ˚Alesund, which has been upgraded with a permanent horizon viewing mode in spring 1999.
The ability to properly interpret UV/visible absorption measurements of atmospheric constituents using scattered light depends crucially on how well the optical path of light collected by the system is understood. This knowledge is es-sential to convert the differential slant columns (DSC – the difference between the column amount of the absorber inte-grated along the light path through the atmosphere and the absorber amount in the background spectrum), which can
be derived from the absorption measurements, into a ver-tical column (V C – the trace gas concentration integrated along height) with the help of a so-called airmass factor (AMF ). This factor is defined as the ratio of the effective optical path through the atmosphere to the vertical optical path. In the case of light scattered in the zenith sky, calcula-tions of twilight airmass factors have been made using simple single scattering radiative transfer models (Solomon et al., 1987). Later, several studies have shown that at least for tro-pospheric absorbers and/or large solar zenith angles (SZAs) multiple scattering has to be taken into account (Perliski and Solomon, 1993). In addition, the full treatment of atmo-spheric atmo-sphericity in the radiative transfer including refrac-tion turned out to be necessary at low sun. As will be shown in this paper, for measurements with the telescope pointed towards the horizon the relative azimuth between observa-tion direcobserva-tion and the sun also plays a role. While sim-ple geometrical considerations or single scattering radiative transfer models as have been used in previous publications (e.g. H¨onninger and Platt, 2002) can give a rough estimate of the absorber’s concentration, more detailed radiative transfer calculations are needed for quantitative results, in particular for small elevation angles. When analysing horizon mea-surements of tropospheric species, validation of the results is usually difficult as independent measurements are scarce. Therefore, absorption by the oxygen dimer O4 is used as a
test case for sensitivity studies and validation of the mea-surement technique. The O4 concentration mainly depends
on the square of the O2concentration and thereby pressure
and the equilibrium constant which is well known and has only a small dependence on temperature (Perner and Platt, 1980; Greenblatt et al., 1990; Wagner et al., 2002). Thus, from the knowledge of the atmospheric pressure and temper-ature profile the vertical O4column can be determined. This
calculated column of O4can be used to determine the
cor-rect settings for aerosols and surface albedo in the radiative transfer model by varying these values until agreement with the measurements is found, because the diurnal variation of O4should be very small. As the O4absorption cross-section
has a number of bands in the UV and visible spectral re-gion, appropriate O4bands can be found close to most fitting
windows used in the DOAS analysis of atmospheric trace species. This is important as for scattered light measure-ments the effective light path depends on wavelength, and results obtained at long wavelengths (for example from the O2bands) can not simply be transferred to the UV spectral
region. Similar approaches to determining aerosol proper-ties have also been applied for zenith-sky measurements (e.g. Wagner et al., 2002), but as a result of the long tropospheric light path, the sensitivity is much larger when observing the horizon.
2 Experiment and data analysis
The MAX-DOAS instrument described in this paper is part of the primary NDSC-station in Ny- ˚Alesund (78◦550N, 11◦560E), Svalbard. Since 1995 ground-based zenith-sky measurements are continuously in operation at this loca-tion. After a successful test in April 1998 the first automated MAX-DOAS was set up in 1999. The instrument described below was installed in March 2002 and is typical for the in-struments used in the BREDOM network operated by the University of Bremen (BREDOM: Bremian DOAS network for atmospheric measurements).
At Ny- ˚Alesund ozone sondes are launched at least once a week and weather sondes daily. These provide profiles of temperature, pressure and ozone that can be used as input for the radiative transfer model (see Sect. 3) and for the calcula-tion of the vertical column of O4(see Sect. 5.1).
2.1 Experimental setup
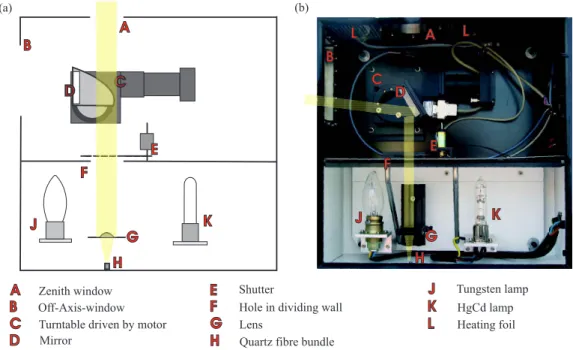
The basic principle of the instrument is that scattered solar light is collected by a telescope from different directions and then transmitted to a spectrograph using a quartz fibre bun-dle. The spectra are recorded by a detector and saved on a PC that also controls the whole setup. A schematic of the telescope is shown in Fig. 1. The telescope housing is based on a commercial watertight box, where two quartz windows A and B are fitted in for zenith sky measurements and for off-axis observations, respectively. The photo in Fig. 1 illustrates the situation for the off-axis mode: Light from all directions enters through window B. The mirror D only reflects light from a specific angle into the direction of the opening F in the dividing wall. In order to be able to examine light from different angles the mirror is mounted on a revolving table C driven by a computer controlled motor. For zenith sky mea-surements the mirror is moved to the left hand side into an upright position to block the light passing through window B while opening the view to the zenith sky port. This is shown in the sketch in Fig. 1. The lens G focuses the light onto the mounting H for the quartz fibre bundle. The lower part of the telescope housing is designed to perform calibration mea-surements with a mercury-cadmium lamp K and a tungsten lamp J, for wavelength calibration and to detect and compen-sate possible etalon effects, respectively. For that the cali-bration unit can be separated from the telescope by closing shutter E. The quartz fibre bundle consists of 38 cylindrical single fibres, each of which has a diameter of 150 µm (plus 15 µm coating). In the telescope, the fibres are positioned discoidal while at the end of the bundle where it is attached to the spectrometer the fibres are arranged in a row to form the slit. In addition to simplifying the set-up of the telescope apart from the spectrometer system, the quartz fibre bundle also has the important function of depolarising the light fed into the spectrometer, thereby minimizing possible artefacts from a polarisation dependency of the instrument. This is
F. Wittrock et al.: MAX-DOAS measurements in Ny- ˚Alesund 957
Fig. 1. Illustration of the MAX-DOAS entrance optic. The scheme on the left shows the position of the mirror for zenith sky observations,
whereas the photo on the right was taken in the horizon viewing mode.
of particular importance as the mirror used in the telescope introduces an additional polarisation. As a spectrometer, an Oriel MS 257 (Oriel, 2001) is used. This spectrometer is of the imaging asymmetric Czerny-Turner type and has an exit focal length of 257.36 mm. The entrance slit is enlarged by a factor of 1.6 in the vertical and 1.1 in the horizontal. The spectrometer is equipped with an automatic grating tur-ret having in our setup two gratings, one with 1200 lines/mm and another with 600 lines/mm. In order to obtain good spec-tral stability of the system, the spectrometer is insulated and thermally stabilized to within 0.1 K. The detector used is a CCD (Charge-Coupled Device) of the DV 440-BU type pro-vided by Andor Technology (Oriel, 2001). The chip has a resolution of 2048×512 pixels and is cooled to −40◦C, to reduce dark current and the impact of hot pixels. Each pixel has a size of 13.5×13.5 µm2. In order to have a better sen-sitivity in the ultraviolet spectrum the chip is thinned and back-illuminated. With this set-up, a spectral resolution of 0.5 nm and an oversampling of 11 is obtained for the grat-ing with 1200 l/mm. This is derived from the FWHM of a representative line in the spectrum of the Mercury-Cadmium lamp. Continuous measurements with this setup are per-formed since 1 March 2002 in the wavelength region from 325 nm to 413 nm. A PC sets the configuration of the sys-tem and controls the automatic measurements. One zenith sky and horizon measurements in four directions are usually executed in a row. In the years 1998 to 2001 a slightly modi-fied setup was used where a cooled Reticon photodiode array served as the detector. Furthermore there was only one off-axis direction possible which was chosen to be 4◦above the horizon.
2.2 Data analysis
The spectra measured with the above described setup are analysed using the well known DOAS method (Platt, 1994). In this technique, only the narrowband, i.e. the differential structures of the absorption cross-sections are used to iden-tify absorbers and quaniden-tify their integrated amount along the light path. Broadband absorption and extinction by Mie and Rayleigh scattering and broadband instrumental features are removed by a polynomial of low order. This polynomial as well as the differential absorption cross-sections of all rel-evant absorbers together with a reference spectrum usually taken at high sun are fitted to the logarithm of the measured spectra. To account for the effects of Raman scattering in the atmosphere, a pseudo cross-section was created with the SCIATRAN model (Vountas et al., 2001) which is treated as an additional absorber (Ring) in the analysis. The DOAS fit algorithm yields the so-called differential slant column (DSC) which represents the excess absorption – with respect to the absorption in the reference spectrum – along the light path. For the O2-O2 dimer a spectral fitting window from
354 to 387 nm was chosen which includes two of the three strong absorption lines in the wavelength region covered by the instrument. In this window ozone is a weak absorber. Only NO2, BrO and a synthetic Ring cross-section as well as
the noon spectrum of the respective day together with a poly-nomial of third order were fitted to the measured spectrum. An example of an O4fit is shown in Fig. 2.
Fig. 2. Example of an O4fit for an elevation angle of 3◦on 26 April 2003. The black solid line is the scaled laboratory refer-ence, the red line the fit result. This fit yields an O4 DSC of
5.16×1043molec2cm−5having a linear fit error of 0.5%. As back-ground for this fit a zenith sky noon spectrum was used. A poly-nomial of degree 3, NO2, BrO and a modeled Ring spectrum have been included.
2.3 MAX-DOAS and geometry
Among other things the slant column of an absorber depends on the position of the sun. Two angles describe the move-ment of the sun relative to the telescope during the day: the solar zenith angle (SZA) and the relative azimuth which is the azimuth angle between the direction of the telescope and the direction of the sun. For zenith sky measurements the rel-ative azimuth is irrelevant. However, for off-axis directions the relative azimuth has to be taken into consideration which will be shown below. The elevation angle indicates the point-ing of the telescope and is defined by the angle between the tangential plane of the earth’s surface and the direction of the telescope. Thus an elevation angle of 90◦denotes zenith sky. By means of the slant column’s diurnal cycle it can be de-termined if a gas mainly absorbs in the troposphere or in the stratosphere. For zenith sky measurements a simple model that only takes single scattering of the light into account is able to illustrate the basic mechanisms: For large SZA the photons cover a long and slant distance from the sun to the upper atmosphere before getting scattered in the zenith into the telescope. The most likely scattering height depends on the solar zenith angle and displaces rapidly upward with the sinking sun. For a stratospheric absorber the slant column in-creases with increasing SZA as long as the scattering height lies initially below and than within the absorbing layer. If at very low sun the most likely scattering height is situated above the absorbing layer the slant column decreases in turn. A tropospheric trace gas absorbs below the most likely scat-tering height along a relatively short light path which changes only slightly with the solar zenith angle. This model is a
Fig. 3. Illustration of the MAX-DOAS geometry. Horizon viewing
observations have a similar path through the stratosphere, whereas the light path in the troposphere is extended and increases with de-creasing elevation angle.
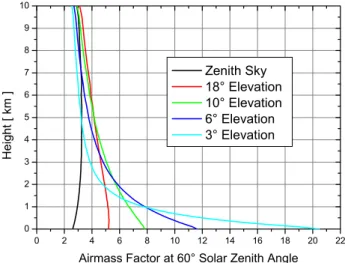
good approximation for stratospheric absorbers. In the tro-posphere multiple scattering gains in importance. Additional information on the vertical profile can be obtained by hori-zon viewing directions. The light path for this geometry is enhanced in the lower atmosphere compared to zenith sky measurements (see Fig. 3). In the measurements described here, the four off-axis directions are chosen to lay particular emphasis on absorption in the troposphere. They comprise the elevation angles 3◦, 6◦, 10◦ and 18◦. In this case the photon path is affected by multiple scattering effects which necessitate comparison of the measured slant columns with model calculations in order to gain vertical columns and pro-file information of the absorbers. An illustration of the sensi-tivity the different viewing modes have for absorbers located in different altitudes is given in Fig. 4. While the zenith sky direction has a low sensitivity to the lower atmosphere, the 18◦direction is already more sensitive to the troposphere in general and the lower viewing directions have increasing sen-sitivity to the boundary layer.
3 Radiative transfer modelling
The output of the DOAS analysis are usually differential slant columns (DSC). To convert these into vertical columns (V C) which are independent of the viewing geometry, air-mass factors (AMF s) have to be calculated with a radiative transfer model. The AMF describes the weighting of the absorption as a function of solar zenith angle and relative azimuth as well as the wavelength of the radiation and is de-fined by the ratio of the slant column (SC) to the vertical column (V C):
F. Wittrock et al.: MAX-DOAS measurements in Ny- ˚Alesund 959
Fig. 4. Height dependence of the sensitivity for the different
view-ing directions at 60◦SZA. The value on the x-axis is the airmass factor for a thin layer positioned in the height given on the y-axis. The large AMF for the 3◦elevation viewing direction in the lowest layers indicates a large sensitivity to absorbers located close to the ground.
where SC is the sum of the DSC and the SC0in the
back-ground spectrum. Thus the diurnal cycle of the AMF fol-lows that of the slant column unless the total amount or ver-tical profile of the absorber changes in the course of the day. 3.1 The model SCIATRAN
Within this work the radiative transfer model SCIA-TRAN (Rozanov et al., 2000) (CDIPI-version: combined differential-integral approach involving the Picard iterative approximation) was used to calculate the airmass factors. In this model the full spherical radiative transfer equation is converted into an integral form by using the characteristic method. This integral form is solved in an iteration scheme for the intensity. As initial estimate for the diffuse radiation field the output of a pseudo-spherical approach to the radia-tive transfer equation is used. The interested reader can find a detailed description of the model SCIATRAN together with all relevant equation elsewhere (Rozanov et al., 2000, 2001). In order to calculate airmass factors SCIATRAN is conduct-ing two runs for the radiance I : One with the selected ab-sorber (I+j) and one without (I−j). Then the AMF is
ob-tained by:
AMFj(λ) =
ln(I+j(λ)/I−j(λ))
V ODj(λ) (2)
where V ODjis the vertical optical depth of the whole
atmo-sphere for the absorber j and λ is the wavelength. This ap-proach was first published by (Perliski and Solomon, 1993) and assumes an optically thin atmosphere, a condition that usually is fulfilled in the measurements presented here.
Fig. 5. Effect of neglecting multiple scattering on the calculated
vertical column of O4. For an elevation angle of 6◦ the vertical column will be underestimated, if only single scattering is taken into account for the airmass factor.
4 Sensitivity studies for O4
When modelling the radiative transfer in the atmosphere, a number of parameters has to be set to realistic values. The most important ones are the viewing geometry, the position of the sun, wavelength, and the vertical profiles of absorbers, pressure and temperature. However, surface albedo and the atmospheric aerosol loading also have an impact on the re-sults. For simplicity, all calculations in this work were made without consideration of clouds.
In Ny- ˚Alesund at least weekly profiles for the absorber ozone and daily temperature and pressure profiles of the atmosphere are available through ozone soundings and ra-diosondes, respectively. Above the burst height of the bal-loon the profiles are completed with values from a model climatology provided by the MPI (Br¨uhl and Crutzen, per-sonal communication1). These profiles are used as realistic meteorological input for the model calculations.
In the following sections, the influence of multiple scat-tering, the relative azimuth, surface albedo, aerosols and the refraction on the O4AMF and consequently the calculated
vertical column are investigated with model data. Such sen-sitivity studies are necessary to determine which parameters need to be known to which accuracy to derive realistic ver-tical columns from the measurements. The results are pre-sented in the form of a ratio between a reference airmass fac-tor AMFRef of a standard scenario with the airmass factor
AMF ’ obtained with one of the above mentioned
parame-ters changed. This ratio indicates the error in the vertical col-umn that is introduced when setting the respective parameter to an inappropriate value (Figs. 5, 8, 9, 12, 13). Whenever
1Br¨uhl, C. and Crutzen, P.: Chemo-dynamical model of the stratosphere: profile data base, personal communication, 1993.
Fig. 6. Diurnal variation of the measured O4DSCs on 26 April 2003. As background the zenith sky noon spectrum from the same day was used. On this very clear day (only thin clouds in the late evening) the azimuthal dependency of the measured O4is clear.
more information is necessary to illustrate the influence of one parameter, additional figures are shown.
For the reference AMF , the atmospheric profile from 3 April 2002 was used and a Fraunhofer reference spectrum taken at 60◦SZA in the zenith direction was assumed. All calculations shown have been done for 370 nm (the center of the O4fitting window), an albedo of 0.5, a background arctic
aerosol (see Fig. 11; Herber, A., personal communication, 2000.) and full multiple scattering and refraction.
It is important to note, that the sensitivity studies are pre-sented in the form in which the AMF will be applied to the actual measurement. Therefore, not the absolute AMF but rather the difference in AMF between a horizon measure-ment and the background zenith measuremeasure-ment at 60◦SZA is used for the comparison with the reference scenario. This rel-ative quantity sometimes has a larger sensitivity to changes in model parameters than the absolute AMF s, but as it re-produces the real measurement situation, it seems the appro-priate choice.
4.1 Multiple scattering
For a qualitative interpretation of MAX-DOAS measure-ments, simple geometric considerations have sometimes been used to estimate the airmass factors (see Sect. 2.3). However, in the troposphere multiple scattering at least for the used wavelength region cannot be ignored, and using a single scattering approximation introduces large errors. This is illustrated in Fig. 5, where for an elevation angle of 6◦the underestimation of the vertical column increases from a few
Fig. 7. Absolute airmass factors for O4. Pointing the instrument towards the sun (0◦relative azimuth) leads to decreasing differences between horizon and zenith sky AMF .
percent at high sun to more than 50% at low sun depending on the relative azimuth. As is to be expected, the influence of multiple scattering increases with decreasing elevation an-gle (not shown). The reason for the large impact of multiple scattering is twofold: on one hand, the airmass factor for the zenith sky measurement increases with multiple scattering, thereby decreasing the difference between horizon and zenith measurement. On the other hand, the airmass factor for the horizon viewing mode is slightly increased by multiple scat-tering for high sun, but clearly decreased at low sun. The combination of both effects results in the behaviour shown in Fig. 5.
4.2 Relative azimuth
When analysing the O4columns measured under different
el-evation angles on a clear day, it is apparent that the values do not only depend on solar zenith angle as in the case of zenith sky measurements, but also vary with the relative azimuth an-gle. This becomes apparent from Fig. 6, which shows mea-surements of DSC from 26 April 2003. As the instrument is pointed towards the NNW, the relative azimuth varies over the day, and morning and afternoon measurements taken at the same SZA differ significantly.
In order to evaluate the impact of the relative azimuth be-tween measurement direction and the sun, airmass factors have been calculated for different elevation angles (3◦, 10◦
and 18◦) and then sorted according to the relative azimuth. The main effect is, that the AMF is significantly smaller when looking towards the sun, in particular for higher eleva-tion angles (see Fig. 7). This is a result of the strong forward peak in Mie scattering, that reduces the effective light path in this geometry (van de Hulst, 1981). The effect on the differ-ence between the horizon AMF and the zenith AMF can be
F. Wittrock et al.: MAX-DOAS measurements in Ny- ˚Alesund 961
Fig. 8. Effect of the relative azimuth angle on the calculated V C.
Shown is the error introduced in the vertical column of O4if an azimuth angle different from the 90◦of the reference case is used in the airmass factor calculation.
quite large as shown in Fig. 8. Here, the error of the vertical columns is shown that is introduced when using a deviating azimuth instead of the correct relative azimuth of 90◦in the
AMF calculations. The azimuth effect is relevant for all
ele-vation angles, and is largest for higher eleele-vations and a small relative azimuth. For all azimuth angles pointing away from the sun the error is smaller than 10% for SZAs less than 93◦. From the results of this test we conclude, that it is prefer-able to point a horizon viewing instrument away from the sun (This is not practicable at high latitudes!), and that the correct azimuth has to be taken into account in the AMF calculation.
4.3 Albedo
Surface albedo changes have a significant impact on the in-tensity of the diffuse radiation field close to the surface. In Ny- ˚Alesund, very different albedo values can be found de-pending on season and viewing direction, for example when comparing snow covered ground and open water. To study the impact of albedo on the AMF , calculations with the albedo of freshly fallen snow (0.9) and a very small albedo (0.01) are compared to a medium albedo of 0.5. For the low-est elevation angle (3◦) the vertical column will be
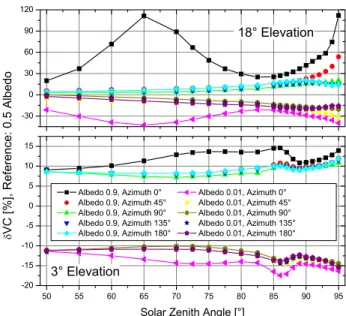
underesti-Fig. 9. Effect of the albedo on the calculated V C. Shown is the
de-viation introduced in the vertical column of O4if an albedo different from 0.5 of the reference is used in the airmass factor calculation.
mated when a too small albedo is assumed and overestimated when the albedo is too high (Fig. 9). At an elevation of 18◦
the same trend can be observed for the directions pointing away from the sun. However, for the direction towards the sun, i.e. 0◦azimuth, using a wrong albedo has a big impact on the vertical column (see the Sect. 4.2). For relative az-imuths larger than 45◦, the error introduced by using an in-appropriate albedo is generally less than 20%.
Figure 10 shows the relative AMF , i.e. the difference between the actual AMF and the AMF of midday at 60◦ SZA. As can be seen, the difference is decreasing with in-creasing albedo. This results in a higher relative sensitiv-ity of the off-axis measurements for a small albedo which at first glance is surprising. The reason for this unexpected be-haviour is not so much the effect of high albedo on the low elevation measurements but an increased sensitivity of the zenith-sky viewing direction. For high albedo the number of photons scattered close to the ground is larger, making the zenith-sky measurements more sensitive to absorption in the troposphere. This reduces the difference in AMF between horizon and zenith-sky viewing directions.
In summary, the impact of albedo changes on the AMF is significant, in particular when looking towards the sun. Good albedo estimates are needed for the analysis (or have to be derived from the measurements themselves) and again it is simplifying the analysis if the telescope is pointed away from the sun.
4.4 Aerosols
The optical properties of aerosols are determined by their composition, their shape and relative humidity. For the
Fig. 10. Differences of AMF for O4calculated with different albe-dos. All relative azimuth angles from previous figures are plotted but for clearness not with extra symbols indicated. All AMF are related to the zenith sky AMF calculated at 60◦solar zenith angle. Although absolute AMF are getting larger for increasing albedo, the inverse behaviour is true for AMF differences between off-axis and zenith sky.
impact on the AMF s, the vertical distribution of the aerosols also plays an important role. In general, increasing the aerosol extinction reduces the light path for the lower view-ing directions but has little impact on the zenith directions, thereby reducing the difference in tropospheric absorption path for the different viewing directions. For the sensitiv-ity studies, a simplified vertical extinction profile – based on measurements in Svalbard during the ASTAR-Campaign 2000 (Herber, A., personal communication, 2000) – was used. In the troposphere, a marine aerosol type was cho-sen, aged volcanic aerosol for the stratosphere and above that meteor dust. The standard extinction coefficient is shown in Fig. 11. The relative humidity was set to 50% in the lower-most 5 km of the atmosphere.
In this study, only the total extinction was changed: The background scenario is compared with very strong extinc-tion as would be observed in an arctic haze event (Herber, A., personal communication, 2000) and with no aerosols at all, i.e. zero extinction coefficient throughout the whole at-mosphere. The results are shown in Fig. 12 for three eleva-tion angles. For the lowest elevaeleva-tion, the light path increases with decreasing extinction, and using a high aerosol scenario instead of the standard scenario will lead to a 10% overesti-mation of O4. Similarly, using a Rayleigh atmosphere in the
airmass factor calculations will lead to a 10–20% underes-timation of the real column. For higher elevations, the sen-sitivity to aerosols decreases, but azimuth effects are more important. In particular, the 0◦ azimuth direction (pointed towards the sun) is very sensitive to changes in the aerosol extinction, mainly because the airmass factor for this direc-tion is very close to the one of the zenith sky background measurement (see Fig. 7).
Fig. 11. Profiles of the aerosol extinction coefficient at 550 nm used
for AMF calculations shown in Fig. 12.
4.5 Refraction
As a result of refraction in the atmosphere, the solar disc can be seen during dusk and dawn for some time even when it is geometrically below the horizon. In the SCIATRAN model, including refraction in the horizon viewing geometry is com-putationally expensive, and therefore the effect of neglecting refraction on the AMF was evaluated. As can be seen in Fig. 13, the error in the vertical would be well below 1% at SZAs smaller than 80◦depending on viewing geometry (el-evation and azimuth) and increases for larger SZA. Thus, in most cases refraction is of minor importance.
4.6 Summary of the model studies
The results of the model studies for O4show, that multiple
scattering can not be ignored, whereas refraction has only a minor impact on the results. The relative azimuth between sun and viewing direction has a significant effect and has al-ways to be taken into account, in particular when the instru-ment is not pointed away from the sun and/or for measure-ments at high latitudes. The effect is much more pronounced
F. Wittrock et al.: MAX-DOAS measurements in Ny- ˚Alesund 963
Fig. 12. Effect of the aerosol extinction profile on the calculated V C. Shown is the error introduced in the vertical column of O4 if aerosol scenarios different from the background aerosol of the reference are used in the airmass factor calculation.
when the realistic case of a zenith sky background spectrum with non negligible O4content is considered. Both, aerosol
extinction and surface albedo can have a large effect on the airmass factors, and determining these parameters is crucial for a quantitative retrieval. The albedo can be adequately de-termined through weather observation or Web Cam pictures whereas the aerosol scenario persists to be an element of un-certainty. However, the measurements from different lines of sight can be used to get aerosol information as is shown in (Heckel et. al., 2004). In all sensitivity studies, only one parameter was changed at a time to simplify interpretation. However, some of the parameters are clearly not indepen-dent from each other, and for example the effect of surface albedo might vary with aerosol extinction. Also, absorbers with a different vertical profile will not behave exactly as O4
does, in particular if they are confined to the boundary layer. However, the qualitative behaviour will be the same, and O4
has the advantage of providing the opportunity to validate the model results.
Fig. 13. Effect of neglecting refraction on the calculated V C. Only
for solar zenith angles larger than 85◦ the introduced errors are larger than 0.5%.
5 Measurement results
An important test of the quality of the radiative transfer model used is comparison of modeled and measured O4
ver-tical columns. In this section, verver-tical columns of O4on two
selected days in 2002 and 2003 are shown, when weather conditions were stable and few clouds occured. Actual mete-orological profiles and albedo settings have been used for the radiative transfer calculation. Starting with realistic aerosol scenarios (see Sect. 4.4) the extinction profile and the compo-sition of the different aerosol layers have been changed until closure of vertical columns of O4 for all lines of sight has
been reached. 5.1 O4
In Fig. 14, O4vertical columns are shown for 26 April 2003
and 13 July 2002. The first day was selected as it was ex-ceptionally clear at least before 20:00 UT, the second as the NO2columns measured on that day show an interesting
fea-ture discussed in the next section.
When judging the quality of the O4vertical columns, three
criteria have to be examined: a) how well the different view-ing directions agree in the vertical column, b) how constant the derived vertical column is over the day, and c) how well the measured vertical column agrees with the value derived from the independent sonde measurement.
Overall the agreement between the vertical columns ob-tained from the different viewing directions is excellent on both days. The small scatter in the data from 13 July 2002 is related to very thin clouds that were sometimes observed on that day. The good agreement indicates, that the SCI-ATRAN model is capable of simulating the different light paths through the atmosphere with high accuracy.
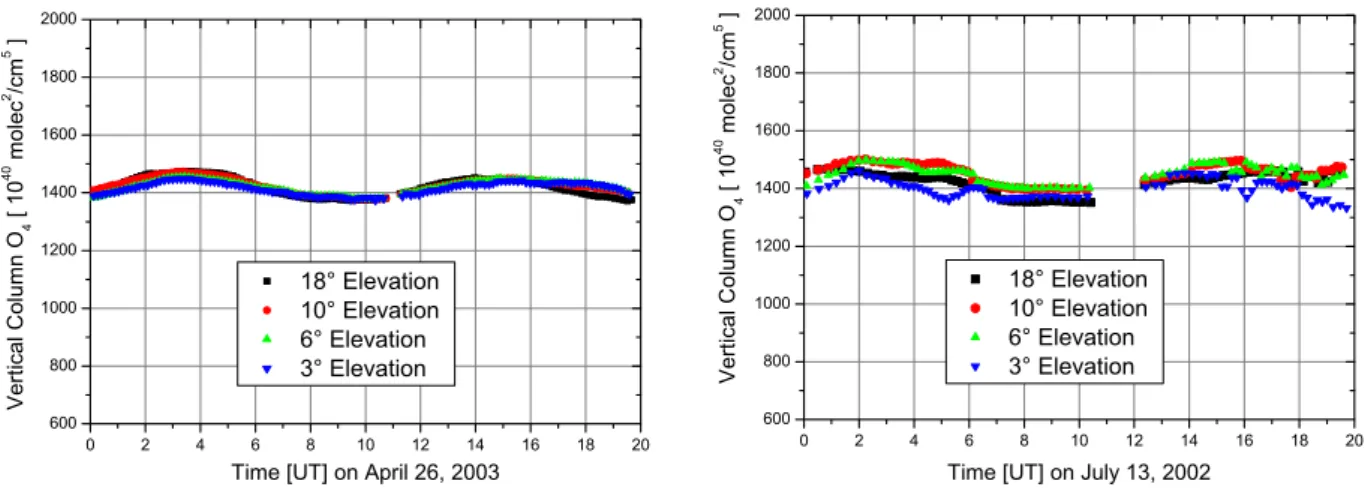
Fig. 14. Vertical columns of O4calculated for all off-axis directions from slant columns measured on two selected days. See text for a detailed description.
When looking at the variation of the retrieved O4
verti-cal column over the day, a systematic pattern is apparent in the April measurements. This pattern with an amplitude of roughly 1×1042molec2cm−5is observed on some but not all days. It is related to the relative azimuth and probably indi-cates a mismatch between the aerosol phase function used in the model and the real value. However, the absolute variation is small (7% peak to peak) and does not have a big impact on the accuracy of the analysis.
The derived O4 columns were also compared to
the columns derived from sonde measurements. The latter yield 1.50×1043molec2cm−5 on 23 April 2003, 1.44×1043molec2cm−5 on 30 April 2003 and 1.38×1043molec2cm−5 on 13 July 2002. As the tem-poral match is not perfect for April 2003, no direct comparison is possible. However, the derived value of 1.44×1043molec2cm−5 is close to the numbers measured before and after by the sonde. The same is true for the second measurement, that agrees with the sonde within 4%.
In summary, the results of the comparison between the re-trieved O4 vertical columns and the independent
measure-ments is very favourable, and lends confidence to the model performance and the retrieval approach.
5.2 NO2case study
To demonstrate the application of multi axis measurements to tropospheric pollution studies, measurements from 13 July 2002 were analysed for NO2. Usually, Ny- ˚Alesund is a clean
air site with little NO2in the boundary layer, and only
emis-sions by the local power generator can lead to occasional NO2peaks if the exhaust plume moves into the field of view
of the instrument. However, in summer cruising ships fre-quently visit the harbour of Ny- ˚Alesund, and their emissions can be observed in the measurements as the instrument is
pointed towards the fiord. This is of interest as model studies predict a significant impact of NOxemissions from ships on
the global tropospheric NOxbudget (Lawrence and Crutzen,
1999), but up to now there has been no experimental verifica-tion. In principle, automated MAX-DOAS observation could provide this type of missing evidence.
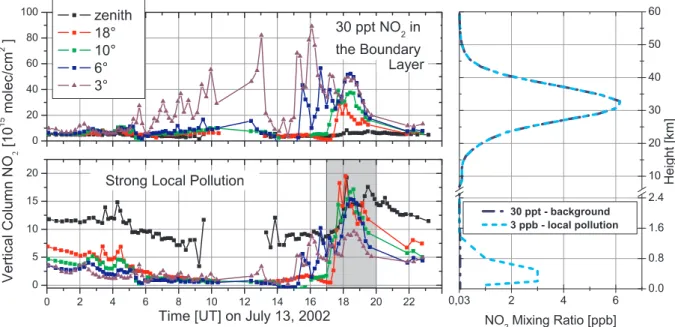
On 13 July (a reasonably clear day as can be seen from the O4measurements shown in Fig. 14) a cruising ship
en-tered the fiord in the afternoon and stayed in the harbour of Ny- ˚Alesund for a few hours from 18:00 LT on. The NO2
columns measured on that day are presented in Fig. 15 for two different scenarios: a clean air scenario with 30 ppt NO2
in the boundary layer and a polluted scenario with 3 ppb NO2. The clean air scenario leads to consistent results in
the morning hours, but later in the day the different viewing directions yield different vertical columns, indicating that the assumed vertical profile is not appropriate. The polluted sce-nario on the other hand fails to bring the morning measure-ments together but leads to good agreement during the pol-lution peak in the late afternoon, indicating that at that time roughly 3 ppb of NO2 were present in the boundary layer.
The lowest viewing direction (3◦) does not line up as nicely as the other directions. This might be due to some clouds very close to the horizon (see O4from 3◦elevation angle
be-tween 18:00 and 20:00 UT in Fig. 14). Another reasonable explanation is a horizontal inhomogeneity in the NO2field.
In the model calculations, the absorber concentrations can only vary with height, and any horizontal gradient will intro-duce differences between model and measurements. As the horizontal path through the boundary layer is of the order of 20 km for the lowest viewing direction, a change in NO2
con-centration along this light path is not unrealistic, in particular as the source is very localised.
F. Wittrock et al.: MAX-DOAS measurements in Ny- ˚Alesund 965
Fig. 15. NO2vertical columns on 13 July 2003 calculated for all off-axis directions with two different scenarios. Between 17:00 and 20:00 UT strong local pollution with 3 ppb in a layer close to the surface can be detected. Before 05:00 UT only 30 ppt in the boundary layer have been detected. This value is a typical background volume mixing ratio of NO2around Ny- ˚Alesund.
6 Conclusions
A novel multi-axis UV/visible instrument (MAX-DOAS) has been described, that measures not only in the zenith direc-tion, but also at several lines of sight close to the horizon. The instrument is operating in Ny- ˚Alesund in a 2 direction viewing mode since 1999 and with 5 viewing directions since March 2002.
Combination of the different viewing directions pro-vides information on both tropospheric and stratospheric ab-sorbers, and under clear sky conditions, some vertical profile information can be derived in the troposphere. To study the sensitivity of the measurements towards a number of parame-ters (multiple scattering, refraction, relative azimuth, surface albedo, and aerosols) model studies have been performed simulating the airmass factor for the oxygen dimer O4with
the radiative transfer model SCIATRAN. The main results are that multiple scattering has an important impact on the results whereas refraction is only of minor importance. The relative azimuth between viewing direction and solar posi-tion is a relevant parameter and has to be considered in any airmass factor calculation. In particular when the instrument is pointing towards the sun, the sensitivity of the measure-ments is decreased and large relative changes in AMF are observed. Therefore, instruments should be pointed away from the sun where possible. Surface albedo and aerosols both play an important role. Increasing albedo reduces the sensitivity for absorption in the lowest layers as does increas-ing aerosol extinction. For quantitative studies, both param-eters need to be well known from external information or by retrieving them from O4measurements.
The modeled AMF have been applied to measurements of O4, and good agreement could be achieved between the
results from different viewing directions. This is a crucial test of the ability to model the radiative transfer for this viewing geometry, and a prerequisite for application to other trace species.
As a sample application, one day of measurements in July 2002 have been analysed for NO2. In the morning of that
day, clean background conditions prevailed and the analysis assuming 30 ppt of NO2 in the boundary layer yields
con-sistent results for all viewing directions. In the afternoon, NO2columns observed with the lower viewing directions
in-creased very much, and mixing ratios of up to 3 ppb in the boundary layer were retrieved from the data. The high NO2
episode coincides with the visit of a cruise ship in the har-bour of Ny- ˚Alesund, and NOxemissions from this ship are
the most probable source of the observed plume.
In summary, Multi-Axis DOAS measurements are a promising tool for automated continuous measurements of several tropospheric species such as NO2, BrO, SO2, HCHO,
and O3(e.g. Heckel et. al., 2004; H¨onninger and Platt, 2002).
Quantitative analysis of the measurements depends on a number of parameters in the radiative transfer, and models such as SCIATRAN are now in a position to include all these factors with the necessary accuracy.
Acknowledgements. We wish to thank the Alfred-Wegener-Institute
for Polar Research in particular the NDSC station engineers, with-out whom this study would not have been possible. We kindly acknowledge A. Herber from the Alfred-Wegener-Institute for
providing aerosol data and P. von der Gathen for the sonde data. Parts of this work have been funded by the University of Bremen, the European Union under contract EVK2-CT2000-00059 (QUILT) and the German ministry for Science and Education (BMBF).
Edited by: A. Hofzumahaus
References
Bobrowski, N., H¨onninger, G., Galle, B., and Platt, U.: Detection of bromine monoxide in a volcanic plume, Nature, 423, 273–276, 2003.
Frieß, U., Wagner, T., Pundt, I., Pfeilsticker, K., and Platt, U.: Spec-troscopic measurements of tropospheric Iodine oxide at Neu-mayer station, Antarctica, Geophys. Res. Lett., 28, 1941–1944, 2001.
Greenblatt, G. D., Orlando, J. J., Burkholder, J. B., and Ravis-hankara, A. R.: Absorption measurements of oxygen between 330 and 1140 nm, J. Geophys. Res., D95, 18 577–18 582, 1990. Heckel, A., Richter, A., Tarsu, T., Wittrock, F., Hak, C., Pundt, I.,
Junkermann, W., and Burrows, J. P.: MAX-DOAS measurements of formaldehyde in the Po-Valley, Atmos. Chem. Phys. Discuss., 4, 1151–1180, 2004.
H¨onninger G. and Platt U.: The Role of BrO and its Vertical Dis-tribution during Surface Ozone Depletion at Alert, Atmos. Envi-ron., 36, 2481–2489, 2002.
Johnston, P. V., and McKenzie, R. L.: NO2observations at 45◦S during the decreasing phase of solar cycle 21, from 1980 to 1987, J. Geophys. Res., D94, 3473–348, 1989.
Lawrence, M. and Crutzen, P.: Influence of NOxemissions from ships on tropospheric photochemistry, Nature, 402, 167–170, 1999.
Leser, H., H¨onninger, G., and Platt, U.: MAX-DOAS measure-ments of BrO and NO2in the marine boundary layer, Geophys. Res. Lett., 30, 10, doi:10.1029/2002GL015811, 2003.
Miller, H. L., Weaver, A., Sanders, R. W., Arpag, K., and Solomon, S.: Measurements of Arctic sunrise surface ozone depletion events at Kangerlussuaq, Greenland (67◦N, 51◦W), Tellus, 49B, 496–509, 1997.
Noxon, J. F., Nitrogen dioxide in the stratosphere and troposphere measured by ground-based absorption spectroscopy, Science, 189, 547–549, 1975.
Noxon, J. F., Norton, R. B., and Henderson, W. R.: Observation of atmospheric NO3, Geophys. Res. Lett., 5, 675–678, 1978. Oriel: The Book of Photon Tools, distributed by Oriel Corporation,
available through the World Wide Web at http://www.oriel.com, 2001.
Perliski, L. M. and Solomon, S.: On the evaluation of air mass fac-tors for atmospheric near-ultraviolet and visible absorption spec-troscopy, J. Geophys. Res., 98, D6, 10 363–10 374, 1993. Perner, D., and Platt, U.: Absorption of light in the atmosphere by
collision pairs of oxygen (O2)2, Geophys. Res. Lett., 7, 1053– 105, 1980.
Platt, U.: Differential optical absorption spectroscopy (DOAS), in Air Monitoring by Spectroscopic Techniques, Chem. Anal. Ser., edited by Sigrist, M. W., 127, 27–84, John Wiley, New York, 1994.
Richter, A., Eisinger, M., Ladst¨atter-Weißenmayer, A., and Bur-rows, J. P.: DOAS zenith sky observations. 2. Seasonal variation of BrO over Bremen (53◦N) 1994–1995, J. Atm. Chem., 32, 83– 99, 1999.
Rozanov, A., Rozanov, V. V., and Burrows, J. P.: Combined differential-integral approach for the radiation field computation in a spherical shell atmosphere: Nonlimb geometry, J. Geophys. Res., 105, D18, 22,937, 2000.
Rozanov, A., Rozanov, V. V., and Burrows, J. P.: A numerical ra-diative transfer model for a spherical planetary atmosphere: com-bined differential-integral approach involving the Picard iterative approximation, Journal of Quantitative Spectroscopy and Radia-tive Transfer, 69, 491, 2001.
Sanders, R. W., Solomon, S., Caroll, M. A., Smith, J. P., Perliski, L., Miller, H. L., Mount, G. H., Keys, J. G., and Schmeltekopf, A. L.: Visible and near-ultraviolet spectroscopy at McMurdo Station, Antarctica, 9: Observation of OClO from April to October 1991, J. Geophys. Res., 98, D1, 7219–7228, 1993.
Solomon, S., Schmeltekopf, A. L., and Sanders, R. W.: On the in-terpretation of zenith sky measurements, J. Geophys. Res., 92, D7, 8311–8319, 1987.
Tørnkvist, K. K., Arlander, D. W., and Sinnhuber, B.-M.: Ground-Based UV Measurements of BrO and OClO over Ny- ˚Alesund during Winter 1996 and 1997 and Andøya during Winter 1998/1999, J. Atm. Chem., 43, 75–106, 2002.
Van de Hulst, H., Light Scattering by Small Particles, Dover Publi-cations Inc., 180 Varick Street, New York, N.Y. 10014, 1981. Van Roozendael, M., Hermans, C., DeMaziere, M., and Simon,
P. C.: Stratospheric NO2observations at the Jungfraujoch Sta-tion between June 1990 and May 1992, Geophys. Res. Lett., 21, 1383–1386, 1994.
Van Roozendael, M., Fayt, C., Post, P., Hermans, C., Lambert, J.-C.: Retrieval of BrO and NO2from UV-Visible Observations, in: Sounding the troposphere from space: a new era for atmo-spheric chemistry, Springer-Verlag, ISBN 3-540-40873-8, edited by Borell, P. et al., 2003.
Vountas, M., Rozanov, V. V., and Burrows, J. P.: Impact of Raman Scattering on Radiative Transfer in Earth’s atmosphere, J. Quant. Spectrosc. Radiat. Transfer, 60, 6, 943–961, 1998.
Wagner, T., von Friedeburg, C., Wenig, M., Otten, C., and Platt, U.: UV/vis observations of atmospheric O4absorptions using direct moon light and zenith scattered sunlight under clear and cloudy sky conditions, J. Geophys. Res., 107, D20, 4424, 2002. Wittrock, F., M¨uller, R., Richter, A., Bovensmann, H., and
Bur-rows, J. P.: Observations of Iodine monoxide above Spitsbergen, Geoph. Res. Let., 27, 10, 1471–1474, 2000.