HAL Id: inserm-00802686
https://www.hal.inserm.fr/inserm-00802686
Submitted on 20 Mar 2013
HAL is a multi-disciplinary open access
archive for the deposit and dissemination of
sci-entific research documents, whether they are
pub-lished or not. The documents may come from
teaching and research institutions in France or
abroad, or from public or private research centers.
L’archive ouverte pluridisciplinaire HAL, est
destinée au dépôt et à la diffusion de documents
scientifiques de niveau recherche, publiés ou non,
émanant des établissements d’enseignement et de
recherche français ou étrangers, des laboratoires
publics ou privés.
Identification of pluripotent and adult stem cell genes
unrelated to cell cycle and associated with poor
prognosis in multiple myeloma.
Alboukadel Kassambara, Dirk Hose, Jérôme Moreaux, Thierry Rème, Jennifer
Torrent, Jean François Rossi, Hartmut Goldschmidt, Bernard Klein
To cite this version:
Alboukadel Kassambara, Dirk Hose, Jérôme Moreaux, Thierry Rème, Jennifer Torrent, et al..
Iden-tification of pluripotent and adult stem cell genes unrelated to cell cycle and associated with poor
prognosis in multiple myeloma.. PLoS ONE, Public Library of Science, 2012, 7 (7), pp.e42161.
�10.1371/journal.pone.0042161�. �inserm-00802686�
Unrelated to Cell Cycle and Associated with Poor
Prognosis in Multiple Myeloma
Alboukadel Kassambara2, Dirk Hose4, Je´roˆme Moreaux1,2, Thierry Re`me1,2, Jennifer Torrent1, Jean Franc¸ois Rossi1, Hartmut Goldschmidt4, Bernard Klein1,2,3*
1 CHU Montpellier, Institute of Research in Biotherapy, Montpellier, France, 2 INSERM, U1040, Montpellier, France, 3 Universite´ MONTPELLIER1, UFR Me´decine, Montpellier, France,4 Medizinische Klinik V, Universita¨tsklinikum Heidelberg and Nationales Centrum fu¨r Tumorerkrankungen, Heidelberg, Germany
Abstract
Gene expression-based scores used to predict risk in cancer frequently include genes coding for DNA replication, repair or recombination. Using two independent cohorts of 206 and 345 previously-untreated patients with Multiple Myeloma (MM), we identified 50 cell cycle-unrelated genes overexpressed in multiple myeloma cells (MMCs) compared to normal human proliferating plasmablasts and non-proliferating bone marrow plasma cells and which have prognostic value for overall survival. Thirty-seven of these 50 myeloma genes (74%) were enriched in genes overexpressed in one of 3 normal human stem cell populations – pluripotent (18), hematopoietic (10) or mesenchymal stem cells (9) - and only three genes were enriched in one of 5 populations of differentiated cells (memory B lymphocytes, T lymphocytes, polymorphonuclear cells, monocytes, osteoclasts). These 37 genes shared by MMCs and adult or pluripotent stem cells were used to build a stem cell score (SCscore), which proved to be strongly prognostic in the 2 independent cohorts of patients compared to other gene expression-based risk scores or usual clinical scores using multivariate Cox analysis. This finding highlights cell cycle-unrelated prognostic genes shared by myeloma cells and normal stem cells, whose products might be important for normal and malignant stem cell biology.
Citation: Kassambara A, Hose D, Moreaux J, Re`me T, Torrent J, et al. (2012) Identification of Pluripotent and Adult Stem Cell Genes Unrelated to Cell Cycle and Associated with Poor Prognosis in Multiple Myeloma. PLoS ONE 7(7): e42161. doi:10.1371/journal.pone.0042161
Editor: Venugopalan Cheriyath, Texas A&M University, United States of America Received February 16, 2012; Accepted July 2, 2012; Published July 31, 2012
Copyright: ß 2012 Kassambara et al. This is an open-access article distributed under the terms of the Creative Commons Attribution License, which permits unrestricted use, distribution, and reproduction in any medium, provided the original author and source are credited.
Funding: This work was supported by grants from ARC ‘‘Association pour la Recherche sur le 355 Cancer’’ (SL220110603450, Paris, France), the European Community (FP7- OVERMYR), the Tumorzentrum Heidelberg/Mannheim, Germany, and the Deutsche Krebshilfe, Bonn, Germany, the Deutsche Forschungsgemeinschaft (Transregio TRR 79), Bonn, Germany. The funders had no role in study design, data collection and analysis, decision to publish, or preparation of the manuscript.
Competing Interests: The authors have declared that no competing interests exist. * E-mail: bernard.klein@inserm.fr
Introduction
Multiple Myeloma (MM) is a molecularly heterogeneous disease with recurrent gene translocations, deletions or gains and changes in gene expression in Multiple Myeloma Cells (MMCs) [1,2]. High throughput DNA microarrays made it possible to identify gene-expression in MMCs linked with event free and/or overall survival of previously-untreated patients. These includes the high risk score from the University for Medical Sciences of Arkansas (UAMS-HRS) [3], the intergroupe Francophone du Mye´lome (IFM) score [4], and surrogate markers of proliferation [5,6]. These scores mainly include genes coding for proteins involved in cell cycle, metabolism, and cell communication. We are interested in identifying genes whose gene products are unrelated to the machinery used for DNA replication and whose expression could predict for risk in patients with previously-untreated MM. In particular, it is of interest to investigate whether MMCs could aberrantly express genes shared by their bone environment, which could confer to them the ability to become less dependent on the environment and eventually to metastasize [7]. It is also of interest to investigate whether MMCs could express genes related to normal stem cell populations. Several studies have emphasized the existence of a Myeloma Stem cell, which lacked CD138, was able
to form colonies in semi-solid medium in vitro, and recapitulate the tumor growth in vivo [8]. These studies were not confirmed, weakening the stem cell hypothesis in Multiple Myeloma [9]. But in order to get a tumor growth, it is mandatory that some MMCs have the stem cell property of self-renewal in vivo, in particular to recapitulate the tumor occurring after drug exposure. Whether all MMCs have this stem cell potential, which could be waked up given appropriate environment conditions or whether there is a fixed differentiation hierarchy within the myeloma tumor in vivo is an open issue. The recent finding that a few genes could reprogram a human adult cell into pluripotent stem cells favors such plasticity to occur in vivo [10]. In particular, the four Yamanaka pluripotent genes – OCT4, SOX2, KLF4 and MYC – are expressed by human pancreatic cancer cells in vivo [11]. Of note, we and others have shown that 3 of 4 Yamanaka genes – KLF4, SOX2 and MYC - are expressed by MMCs [12], suggesting MMCs could dedifferentiation in vivo.
To delete cell cycle genes, we took advantage of the possibility to generate high numbers of highly cell cycling normal plasmablasts, starting from human peripheral blood memory B lymphocytes [13,14]. Fifty cell-cycle unrelated genes over- or under-expressed in MMCs were thus identified, whose expression is associated with
overall survival in 2 independent large cohorts of patients with previously untreated MM. Of major interest, 37 (74%) of these 50 cell-cycle unrelated prognostic myeloma genes are overexpressed in 3 normal stem cell populations - pluripotent, hematopoietic or mesenchymal stem cells - compared to normal differentiated cells. In addition, these 37 cell-cycle unrelated genes make it possible to build a powerful prognostic ‘‘stem cell’’ score.
Results
Cell Cycle Unrelated Genes Overexpressed in Primary Myeloma Cells and/or Myeloma Cell Lines Compared to Normal Plasmablasts or Plasma Cells and Predicting Patients’ Overall Survival
As shown in Figure 1, GEPs of primary MMCs or HMCLs were compared to those of their highly cycling normal counterparts – in vitro generated preplasmablasts and plasmablasts - as well as to those of non cell cycling normal counterparts - in vitro generated plasma cells and normal bone marrow plasma cells - using SAM supervised analysis (1000 permutations, FDR #5%, ratio $2). Preplasmablasts and plasmablasts were used to delete genes coding for cell cycle machinery. 885 unique probe sets, coding for 678 unique myeloma genes or ESTs were overexpressed in primary MMCs (281 probe sets) or in HMCLs (702 probe sets) compared to normal counterparts (Supplementary Table S2). Using the R MaxStat function, 332 of the 678 genes had prognostic value in the HM cohort. To correct for multiple testing, the independent patient cohort of 345 patients treated with TT2 protocol (UAMS-TT2 cohort) was used. Fifty (43 bad and 7 good prognostic genes) of these 332 prognostic genes kept prognostic value in this independent cohort using MaxStat parameters designed in HM cohort, yielding to a 3% false discovery rate (Supplementary Table S3). As expected, these 50 genes did not encode for cell cycle related proteins.
Cell-cycle Unrelated Prognostic Myeloma Genes are Highly Enriched in Pluripotent or Adult Stem Cell Genes
Since prognostic myeloma genes did not encode for cell-cycle related proteins, we investigated normal cell populations, which could express some of these myeloma genes specifically, using SAM multiclass analysis (1000 permutations, FDR ,5%). Three human stem cell populations were included – pluripotent stem cells, hematopoietic stem cells and mesenchymal stem cells – and 5 populations of differentiated cells: B lymphocytes, T lymphocytes, polymorphonuclear cells, monocytes and osteoclasts. Considering genes overexpressed in only one normal population compared to others, 74% (37/50) of these prognostic myeloma genes were expressed by one of the 3 stem cell populations specifically and 6% (3/50) by differentiated cells (Table 1 and Figure 1). Ten genes were not specifically overexpressed in one of these 8 normal cell populations. A heatmap representation of the expression profile of the 37 stem cell genes in the normal and malignant cell populations as well as in stem cell and differentiated cell populations is displayed in Figure 2. Out of the 37 genes shared by MMCs and adult or pluripotent stem cells, 18 are overexpressed by pluripotent stem cells, 10 by hematopoietic stem cells, and 9 by mesenchymal stem cells (Table 1). This observation emphasizes that the cell-cycle unrelated prognostic myeloma genes are enriched in normal stem cell genes and we will focus in the following on these 37 stem cell genes. These 37 genes were found to be significantly associated with 5 pathways using Ingenuity: ‘‘nervous system development and Function, cellular development, genetic disorder’’, ‘‘lipid and nucleic acid metabolism, molecular
transport’’, ‘‘tissue morphology, genetic disorder’’, ‘‘endocrine system disorders’’, and ‘‘hematological disease’’. The 37 genes shared by MMCs and adult or pluripotent stem cells are variably expressed in HMCLs (supplementary Figure S1).
Building a Stem Cell Score (SCscore) for Predicting Overall Survival
The prognostic information provided by the 37 genes shared by MMCs and adult or pluripotent stem cells was summed within a
SC
score as indicated in Materials and Methods. Based on this
SC
score, Maxstat statistic test cuts the HM-patient cohort within 2 groups: a high-risk SCscore comprising 10% of patients with a median OAS of 25.3 months and a low-riskSCscore with a median OAS not-reached (P = 10215, Figure 3A).SCscore was prognostic on HM cohort as a continuous variable. SCscore was also prognostic for the UAMS-TT2 cohort of 345 patients. Using the
SC
score cut-point of 22.7 defined on HM cohort, 12% of UAMS-TT2 cohort patients were identified as high-risk SCscore group with a median OS of 25.5 months and 88% of UAMS-TT2 cohort patients were in low-riskSCscore group with a median OS not-reached (P = 1E-22, Figure 3B). SCscore was prognostic on UAMS-TT2 cohort as a continuous variable.
Comparison of Various GEP-based Risk Scores
Three GEP-based risk scores were reported for MM disease using 70 genes for UAMS-HRS [3], 15 for IFM score [4] and 50 for a gene expression-based proliferation index (GPI) [5]. None of the 37SCscore genes was used by IFM score and GPI, and only one (ROBO1) by UAMS-HRS. Prognostic value for overall survival ofSCscore was compared with usual prognostic factors - ISS, spike MMSET, del17p - or the 3 GEP-based risk scores (UAMS-HRS, IFM score and GPI). Using univariate Cox analysis on HM cohort, all these factors had prognostic value andSCscore had the higher hazard ratio (Table 2A). Using multivariate Cox analysis,
SC
score and GPI, kept prognostic value (Table 2C). Univariate cox analysis on UAMS-TT2 cohort showed that SCscore had the higher hazard ratio, followed by UAMS-HRS, del17p, spike MMSET, GPI and IFM score, ISS, b2m and albumin (Table 2A). Using multivariate analysis, SCscore, UAMS-HRS, GPI, del17p, ISS, b2m and albumin kept prognostic value (Table 2B). Link ofSCscore with Patients’ Clinical and Genetic Parameters
The frequencies of patients with low albumin or low hemoglo-bin levels were significantly increased in patients with high risk
SC
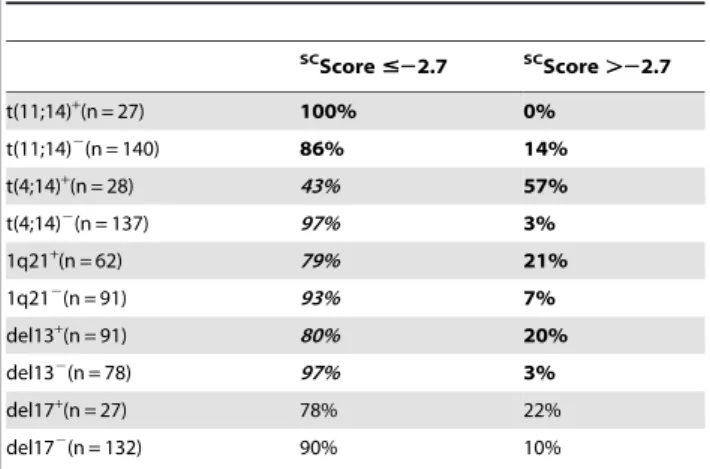
score (P#.05, Supplementary Table S5). Others clinical data – age, b2m, ISS staging, CRP, Durie Salmon staging, light or heavy chain isotype and occurrence of bone lesions - were not significantly different between the 2 SCscore groups. The frequency of patients with t(4;14)(p16.3;q32.3), 1q21 or del13 was significantly increased in the high riskSCscore group. Of note, the frequencies of patients with del17p were not significantly different between the high-risk or low-riskSCscore groups (Table 3). Discussion
The major message of the current study is that prognostic genes aberrantly expressed by MMCs compared to normal plasmablasts or plasma cells and unrelated to DNA replication, repair and recombination are highly enriched (74%) in genes overexpressed in human pluripotent or adult stem cells. These 37 ‘‘stem cell myeloma genes’’ comprise 32 bad and 5 good prognostic genes and were used to build a stem cell risk score. The strong prognostic value of this stem cell risk score in 2 independent patients cohorts,
compared to the two previously reported gene expression based risk score, emphasizes the biological relevance of the stem cell myeloma genes.
We can reasonably eliminate the possibility that the stem cell genes expressed by MMCs could be due to contaminating stem cells present in purified MMCs. Firstly, pluripotent stem cell genes are not known to be present in the bone marrow, at least at detectable levels, and mesenchymal stem cells or hematopoietic stem cells are rare in the bone marrow (,1%) making difficult such a contamination. Secondly, several hundred of genes are specifically overexpressed in pluripotent stem cells, in mesenchy-mal stem cell or in hematopoietic progenitors compared to the other populations used in this study (results not shown), and in case of a contamination of purified MMCs by these stem cells, these genes should be also detected, which is not the case. Thirdly, the stem cell genes are also expressed in human myeloma cell lines that have been cultured for years in vitro and could not be contaminated by normal stem cells (supplementary Figure S1 and supplementary Figure S2).
The high enrichment of prognostic myeloma genes in normal stem cell genes may suggest the frequency of myeloma stem cells is increased in patients with a highSCscore and that these myeloma stem cells share common pathways with normal stem cells. Vice versa, the fact that these stem cell genes are overexpressed in
malignant plasma cells in association with a poor survival could highlight an important role of the gene product in normal stem cell biology. The status of a myeloma stem cell is currently controversial. While some studies emphasized the myeloma stem cell could be a CD1382plasma cells [15], others failed to confirm these data [16,17]. A major difficulty to identify a myeloma stem cell, able to generate myeloma tumor, is the lack of animal models to efficiently engraft patients’ primary MMCs. The current study identifying prognostic genes shared by normal stem cells and MMCs from patients with poor survival may prompt investigating whether these ‘‘stem cell’’ myeloma genes encode for new markers of a putative MM stem cell.
This ‘‘stem cell’’ myeloma gene list comprises 37 genes, whose 18 are overexpressed in pluripotent stem cells, 10 in hematopoietic stem cells, and 9 in mesenchymal stem cells. Three of the 4 Yamanaka genes – SOX2, KLF4 and MYC - making it possible to reprogram adult cells into pluripotent stem cells have been shown to be expressed by MMCs [12]. These genes were not picked here because also they were expressed in differentiated cells (KLF4) or had no prognostic value for MM patient survival. Among the 37 stem cell genes, 8 encode for metabolic proteins (PLOD2, GAMT, TM7SF2, FBXL7, GOLM1, KCTD3, SLC27A5 and NUDT11), 6 for membrane proteins (IGF1R, BAMBI, BCHE, PKP2, ROBO1 and CNIH4), and 3 for transcription factors (POLR2F, PBX1 and NFIB)
Figure 1. identification of genes overexpressed in primary myeloma cells and/or myeloma cell lines compared to normal plasmablasts or plasma cells and associated with patients’ prognostic value. 281 and 702 probe sets were overexpressed in MMCs and HMCLs compared to normal counterparts, respectively. These probe sets correspond to 678 unique genes/ESTs among which 332 genes/ESTs were associated to bad or good prognostic using HM cohort of patients. The prognostic value of 50 out of the 332 genes/ESTs is validated using an independent UAMS-TT2 cohort. Among these 50 genes, 37 were stem cell genes, 3 were differentiated cell genes and 10 genes were unclassified. doi:10.1371/journal.pone.0042161.g001
as assayed using Gene Ontology (Supplementary Table S4). The prognostic value of IGF-1R gene expression has been already documented in MM [18] and the known biology of the most speaking genes is reviewed below.BAMBI (Bone morphogenetic protein and Activin Membrane-Bound Inhibitor) is a bad prognosis gene that encodes for a decoy receptor antagonizing the function of bone morphogenic protein (BMP) or Activin receptors. BAMBI is highly expressed in pluripotent stem cells (supplementary Figure S2). Several studies have shown that BMPs can yield to MMC cell cycle blockade and apoptosis [19,20], in particular though SMAD signaling activation and blockade of MYC pathway [19,20]. Thus a high expression of BAMBI on MMCs could antagonize an inhibitory effect of BMPs on MMC growth in vivo.ROBO1 gene is a poor prognostic gene in MM. It is the only gene shared between with the current 37 ‘‘stem cell’’ myeloma genes and UAMS-HRS 70 genes. ROBO1 is highly expressed by normal pluripotent stem cells and weakly by normal plasma cells (supplementary Figure S2). ROBO1 encodes for the Roundabout 1 membrane receptor, which belongs to immuno-globulin superfamily and whose ligands are the SLIT proteins [21]. SLIT proteins bind to heparan sulfate chain proteoglycans, which favor their interaction with ROBO1. The interaction between ROBO1 and SLIT proteins plays critical role in mediating axon guidance during neural development [22], recruitment of endothelial cells during angiogenesis [23], and cancer cell migration [24]. Of note, SLIT genes are highly expressed by bone marrow stromal cells of patients with MM, unlike monocytes or osteoclasts (data not shown). The interaction of SLIT proteins and ROBO1 on MMCs should be greatly facilitated by the high expression of heparan sulfate chain syndecan-1 on MMCs [25] and favor MMC dissemination. BCHE gene is a bad prognostic gene in MM and encodes for butyrylcholinesterase, a non-specific cholinesterase enzyme that
hydrolyses many different choline esters. Non-neuronal acetycho-line is synthesized by the majority of cells [26,27] and serves to regulate basic cellular functions, e.g. proliferation or differentia-tion. BCHE expression is high in pluripotent stem cells (supple-mentary Figure S2) and decreased upon their differentiation [28]. An inhibition of butyrylcholinesterase yields to inhibition of embryonic stem cell proliferation [29]. The involvement of cholinesterases in normal and malignant plasma cells is not known. BCHE gene is not expressed in normal plasmablasts or plasma cells and dichotomically expressed in MMCs (either highly expressed or not expressed) suggesting a strong regulation of BCHE gene expression (supplementary Figure S2). Butyrylcholi-nesterase inhibitors are being developed for neurodegenerative diseases [30] and their biological effects on MMC survival and proliferation should be investigated.GOLM1 is a poor prognostic gene, overexpressed in pluripotent stem cells (supplementary Figure S2). It encodes for Golgi Protein 73 (GP73), whose serum level is a powerful diagnosis factor for hepatocarcinoma, without elucidation of the biological function of GP73. Of note, both hepatocytes and plasma cells produce a lot of proteins requiring high Golgi activity and increased unfold protein response. GP73 could be a marker of MMC dedifferentiation since it is transiently expressed in plasmablasts, lacking on memory B cells and mature plasma cells (supplementary Figure S2). This raises interest to investigate the prognostic value of serum GP73 levels in patients with MM and to further investigate the role of the golgi apparatus in normal and malignant plasma cells. PBX1 gene is a bad prognostic factor in MM. PBX1 interacts with MEIS to bind to DNA element [31]. PBX1 gene is fused to the transcription factor E2A as a result of the t(1;19) translocation in pre-B cell leukemia [32]. This fusion prevents interaction with MEIS proteins and converts PBX1 to a transcriptional activator. The PBX1 gene is overexpressed in pluripotent stem cells (supplementary Figure S2) Table 1. Cell cycle unrelated prognostic myeloma genes are highly enriched in pluripotent or adult stem cell genes.
Pluripotent stem cells (n = 18) Hematopoietic stem cells (n = 10) Mesenchymal stem cells (n = 9) Osteoclasts (n = 1)
NUDT11 NAP1L3 EPDR1 CTSC
C1orf106 SPIN4 IGF1R PBX1 LOC100147773 MYLK
NANOS1 LAGE3 PLOD2 T lymphocytes (n = 1) ROBO1 SLC27A5 FBXL7 ACVR1C*
DPY30 LOC645676 FLJ22167 AGAP1 FAM133A NFIB*
POLR2F LOC646762 MFAP3L* B lymphocytes (n = 1) BAMBI C12orf24 KIAA1217* CIRBP*
GOLM1 GAMT* PKP2
C17orf81 Polymorphonuclear cells (n = 0) TDRKH KCTD3 LOC649305 Monocytes (n = 0) BCHE CNIH4 TM7SF2*
Out of the 50 prognostic MM genes, 37 are overexpressed in only one normal cell population compared to 7 others. These 8 normal cell populations include 3 stem cell populations– pluripotent stem cells, mesenchymal stem cells and hematopoietic stem cells – and 5 populations of differentiated cells: B lymphocytes, T lymphocytes, polymorphonuclear cells, monocytes and osteoclasts. Genes are ranked according to their prognostic value. (*) indicates good prognostic genes.
doi:10.1371/journal.pone.0042161.t001
and downregulated during their differentiation [33]. Actually, PBX1 cooperate with KLF4 to induce expression of NANOG gene and protein, which is critical to maintain stem cell pluripotency [33]. A role of PBX1 in MM has not been documented.NANOS1 is a bad prognostic gene overexpressed in pluripotent stem cells (supplementary Figure S2). NANOS1 protein bears a COOH-terminal (CCHC)(2) zinc finger domain and belongs to an evolutionarily conserved protein family sharing functions in germ cell development in both vertebrates and invertebrates [34]. NANOS1 is essential for both establishing and maintaining germline stem cells by preventing their precocious entry into oogenesis [35]. Thus NANOS1 expression in MM could be associated in MMC dedifferentiation.Plakophilin 2 (PKP2) is a bad prognostic gene in MM. It is not expressed in normal plasmablasts or plasma cells and is overexpressed in pluripotent
stem cells (supplementary Figure S2). PKP2 is involved in desmosome junction in association with members of cadherin family, desmoplakin, desmoglein and desmocollin. PKP2 could be associated with N-cadherin in adherens junctions in cancer cells and involved in immortalization of mesenchymal stem cells [36]. N-cadherin is expressed by MMCs and directly mediates the bone marrow localization and retention of MMCs in vivo, and facilitates a close interaction between N-cadherin positive MMCs and osteoblasts [37]. Given its association with N-cadherin in cancer cells, plakophilin could be one of the mediator favoring this N-cadherin mediated interaction of MMCs with the tumor niche. NUDT11 is a gene coding for a type 3 diphosphoinositol polyphosphate phosphohydrolase. It is overexpressed in pluripo-tent stem cells (supplementary Figure S2) and has a very powerful poor prognostic value when overexpressed in MMCs of 12% of
Figure 2. Expression profile of the 37 genes shared by multiple myeloma cells, adult or pluripotent stem cells. A heatmap of the expression of these genes is shown for normal bone marrow plasma cells, primary multiple myeloma cells from patients, myeloma cell lines, 5 populations of differentiated cells (B cells, T cells, neutrophils, monocytes and osteoclasts) and 3 human stem cell populations (pluripotent stem cells, hematopoietic stem cells and mesenchymal stem cells). Each value represents the difference from the gene median across normal and malignant samples and is depicted according to the color scale shown at the bottom (25.2 to 4.9 on a log base 2 scale).
the patients. The role of NUDT11 for conferring a stem cell property and increased risk in cancer should be investigated. POLR2F gene is a bad prognostic factor in MM and is overexpressed in normal pluripotent stem cells (supplementary Figure S2). It encodes for a subunit of RNA polymerase II complex that is critical to insure transcription of genes into RNA. Its high expression in MMCs of patients with poor survival could be the reflection of a high transcription activity in MMCs of these patients with risk. MFAP3L is a good prognosis gene in MM, which is overexpressed in mesenchymal stem cells. It encodes for a microfibrillar-associated protein 3-like, whose function is poorly known. It is highly expressed in plasma cells from patients with MGUS and 40% of patients with MM and decreased in HMCLs (supplementary Figure S2). MFAP3L is expressed in memory B cells and normal bone marrow plasma cells, unlike plasmablasts (supplementary Figure S2). Whether MFAP3L could be involved in differentiation of mature plasma cells and stop in the cell cycle or is a surrogate marker of mature plasma cells needs further investigation.
This brief review outlines that this study has identified novel ‘‘stem cell’ myeloma genes, which could encode for markers of putative myeloma stem cells or for proteins involved in MMC dedifferentiation, interaction with the tumor environment, or tumor spreading. The identification of primary MMCs, HMCLs and normal stem cells expressing these genes will greatly facilitate the study of the biological function of these stem cell myeloma gene products.
Materials and Methods
Patients’ and Healthy Donors’ Primary Cells, Stem Cell Lines and Myeloma Cell Lines
In accordance with the Declaration of Helsinki and institutional research board approval from Montpellier or Heidelberg Univer-sity hospitals, bone marrow Multiple Myeloma Cells (MMCs) from 206 patients with previously-untreated Multiple Myeloma were purified using anti-CD138 MACS microbeads (Miltenyi Biotec) achieving a purity $95%. Briefly, whole BM cells were collected after red blood cell lysis with NH4Cl, mononuclear cells recovered
Figure 3. Building a myeloma-stem cell score (SCscore) for predicting overall survival. A. The prognostic information provided by the 37
stem cell myeloma genes was summed within aSCscore as defined in the Materials and Methods. Patients of HM cohort were ranked according to increasedSCscore and a maximum difference in OS was obtained withSCscore = 22.7 splitting patients in a high risk (10%) and low risk (90%) groups.
B. Validation ofSCscore using UAMS-TT2 cohort.
doi:10.1371/journal.pone.0042161.g003
by Ficoll-density gradient centrifugation, MMCs labelled with anti-CD138 MACS microbeads (Miltenyi Biotec) and sorted with an automacs device. Bone marrow hematopoietic stem cells, T lymphocytes, monocytes or polymorphonuclear neutrophils were purified (purity $95%) from 5 newly-diagnosed patients by labelling bone marrow cells with an anti-CD34 mAb, anti-CD3 mAb, anti-CD14 mAb, or an anti-CD15 mAbs (all from BD Biosciences) and CD34+, CD3+, CD14+, and CD15+ cells were sorted with a FACSAria cell sorter (BD Biosciences) [38]. Osteoclasts were generated by in vitro differentiation of monocytes as previously described and contained $ 95% integrin avb3 positive cells [39]. Normal bone marrow plasma cells were purified from healthy donors (HDs, n = 5) using anti-CD138 microbeads. Bone marrow mesenchymal stem cells were obtained in our laboratory from 5 newly-diagnosed patients [40]. Preplasmablasts, plasmablasts or plasma cells were obtained using our 3-step in vitro model starting from purified memory B cells from 5 HDs [13,14]. Human myeloma cell lines (HMCLs, n = 25) were obtained in our laboratory (XG series) [41,42,43] or were commercially available - SKMM, OPM2, LP1 and RPMI8226– (ATTC, LGC Standards, France). They were maintained in RPMI1640 (Gibco Invitrogen, France), 10% fetal bovine serum (FBS, PAA laboratory GmbH, Austria) and for the IL-6-dependant cell lines, with 2 ng/ml of IL-6 (Abcys SA, Paris, France). Their extensive phenotypic and molecular characteristics have been reported [44].
Gene Expression Data
Gene expression profiling (GEP) of MMCs were from two independent large patients’ cohorts: the Heidelberg-Montpellier (HM) cohort and the University of Arkansas for Medical Sciences (UAMS, Little Rock, USA) cohort treated with total therapy 2) Table 2. Cox univariate and multivariate analysis of OS in HM
and UAMS-TT2 patients’ cohorts.
Univariate Cox analysis - Overall survival
A HM LR-TT2
HR P HR P
SC
Score 9 2.60E-11 6 3.50E-10 UAMS-HRS 2.4 1.40E-02 4.7 4.80E-13 IFM score 2.5 1.90E-02 1.8 4.00E-03 GPI 2.6 1.60E-04 1.8 2.20E-04 Spike MMSET 3.3 4.70E-04 2.2 3.20E-04 del17p 3.4 2.00E-02 2.5 3.70E-04 ISS 2 9.70E-04 1.6 0.000055 b2M 1.1 4.20E-05 1.1 0.000000049 Alb 0.47 1.40E-02 0.94 0.00012
Multivariate Cox analysis - Overall survival
B HM LR-TT2
HR P HR P
SC
Score 8.9 3.50E-09 4 2.60E-08 UAMS-HRS 1 NS 2.4 4.70E-04
SC
Score 8.3 3.10E-10 5.7 3.40E-15 IFM score 1.7 NS 1.2 NS
SC
Score 8.5 2.50E-10 5.4 7.90E-15 GPI 2.2 6.30E-04 1.4 3.60E-02
SC
Score 13 4.20E-08 7.2 1.00E-13 Spike MMSET 0.62 NS 0.74 NS
SC
Score 9.1 1.20E-10 5.9 0.00E+00 del17p 3.2 3.20E-02 2.3 1.30E-03
SC
Score 7.6 1.80E-09 5.4 2.10E-15 ISS 1.6 1.60E-02 1.4 0.0033
SC
Score 8 2.10E-09 5.1 2.20E-14 b2M 1 NS 1.1 0.0002
SC
Score 8 8.70E-10 5.3 8.70E-15 Alb 0.65 NS 0.96 0.021
Multivariate Cox analysis - Overall survival
C HM LR-TT2 HR P HR P SC Score 6.4 0.0012 3.4 0.00013 del17p 1.9 NS 2.4 0.00093 ISS 1.4 NS 1.3 0.013 UAMS-HRS 0.68 NS 2.3 0.0078 IFM score 0.63 NS 0.9 NS Spike MMSET 1.7 NS 1.1 NS GPI 2.3 0.01 1.1 NS
A) Cox univariate analysis of overall survival. The prognostic factors were tested as single variable.B) Cox multivariate analysis of overall survival. TheSCScore were tested together with each of the prognostic factors.C) Cox multivariate analysis of overall survival using all prognostic factors together. Hazard ratios (HR) and P-values are shown. NS, Not Significant at a 5% threshold; GPI, gene
expression based proliferation index; ISS, International Staging System; UAMS-HRS, high-risk score from UAMS; IFM, Intergroupe Francophone du Myelome. doi:10.1371/journal.pone.0042161.t002
Table 2. Cont.
Table 3. Link ofSCscore with patients’ Genetic abnormalities.
SC Score #22.7 SC Score .22.7 t(11;14)+(n = 27) 100% 0% t(11;14)2 (n = 140) 86% 14% t(4;14)+(n = 28) 43% 57% t(4;14)2 (n = 137) 97% 3% 1q21+(n = 62) 79% 21% 1q212 (n = 91) 93% 7% del13+(n = 91) 80% 20% del132 (n = 78) 97% 3% del17+(n = 27) 78% 22% del172 (n = 132) 90% 10%
Interphase-FISH-analysis was performed on CD138-purified plasma cells of 153 to 169 patients of the HM series, depending on the gene abnormality. Patients were separated in two groups according toSC
score (low-risk and high-risk groups). Data are the percentages of patients within these 2 groups with the biological parameters. When the percentages were different with a chisquare test (P#.05), data are shown in bold and italic.
[45]. GEP were obtained using Affymetrix U133 2.0 plus array (Affymetrix, Santa Clara, CA). The clinical characteristics of our patient HM cohort are provided in supplementary Table S1 and the .CEL files and MAS5 files deposited at the ArrayExpress public database under accession number E-MTAB-362. The structural chromosomal aberrations including t(4;14)(p16.3;q32.3) and t(11;14)(q13;q32.3), as well as numerical aberrations including 17p13 and 1q21 gain, were assayed by fluorescence in situ hybridization (iFISH) [46]. Patients with t(4;14)(p16.3;q32.3) were also detected using spike MMSET expression in MMCs as a surrogate marker [18]. The GEP of MMCs of the 345 patients of the UAMS TT2 cohort are publicly available at (GEO, http:// www.ncbi.nlm.nih.gov/geo/, accession number GSE2658) and were used as a validation set. As iFISH data were not available for UAMS-TT2 patients, t(4;14) translocation was evaluated using MMSET spike expression [18] and del17p13 surrogated by TP53 probe set signal [47]. GEP (.CEL files and MAS5 files) of HMCLs and of the various purified normal cells are deposited at ArrayExpress under accession numbers E-TABM-937, E-TABM-1088, E-MEXP-2360, E-MEXP-2360, E-MEXP-3034, E-TABM-937. Affymetrix U133 plus 2.0 gene expression profiling of human embryonic stem cells were available from GEO (http:// www.ncbi.nlm.nih.gov/geo/, GSE6561, GSE7234, GSE7896). Statistical Analysis
Affymetrix gene expression data were normalized using MAS5 Affymetrix algorithm with a scaling factor of 500. Two-class and multi-class SAM supervised analysis (1000 permutations, FDR # 5%, ratio $ 2) were used to compare data sets of each cell type (http://www-stat.stanford.edu/,tibs/SAM/). Gene Expression Profiles (GEPs) were also analyzed with our bioinformatics platform (RAGE, http://rage.montp.inserm.fr) [48] and with the Amazonia website (http://amazonia.montp.inserm.fr/) [49]. The statistical significance of differences in overall survival between groups of patients was calculated by the log-rank test. Multivariate analysis was performed using the Cox proportional hazards model. Survival curves were plotted using the Kaplan-Meier method. All these analyses have been done with R.2.10.1 (http://www.r-project.org/) and bioconductor version 2.5. [50,51]. Gene annotation and networks were generated through the use of Ingenuity Pathways Analysis (IngenuityH Systems, Redwood City, CA).
Building a Risk Score Using Stem Cell Genes
A ‘‘stem cell’’ risk score (termedSCscore) was built to group the prognostic information of the 37 stem cell myeloma genes within one parameter. For the 37 stem cell myeloma genes, the odd ratios of the Cox analysis on the HM cohort were determined with R MaxStat package, and for each patient, these odd ratios were weighted by +1 if the patient’s gene expression is above the Maxstat cutoff, and 21 if below or equal this cutoff. TheSCScore of a given patient was the sum of these weighted odd ratios for the 37 prognostic genes. Thus the higher theSCScore is, the worse the prognosis is. Patients from the same cohort were ranked according to increasedSCScores and for a given value S, the difference in overall survival of patients with a SCScore # S or . S was computed, making it possible to define theSCScore value with a
maximum difference in survival using maximally selected rank test from R package MaxStat.
Supporting Information
Figure S1 Expression of the 37 genes shared by multiple myeloma cells and adult or pluripotent stem cells in human myeloma cell lines. Data are the MAS5-normalized expression signal of each gene in myeloma cell lines.
(PDF)
Figure S2 Gene expression signal of BAMBI, ROBO1, BCHE, GOLM1, PBX1, NANOS1, PKP2, NUDT11, POL2RF and MFAP3L. Gene expression was assayed using Affymetrix microarray in pluripotent stem cells (n = 13), hemato-poietic stem cells (n = 5), mesenchymal stem cells (n = 5), memory b cells (n = 5), plasmablasts (n = 5), bone marrow plasma cells (n = 5), multiple myeloma cells (n = 206) and human myeloma cell lines (n = 25). Data are the log2 MAS5-normalized expression signal of each gene in the different cell populations.
(PDF)
Table S1 Clinical characteristics of patients of HM cohort. Data are median values and ranges for age, serum monoclonal protein, serum-b2-microglobulin and the Salmon-Durie and International Staging System (ISS) stages. NA, not available.
(PDF)
Table S2 The 885 unique probe sets overexpressed in MMCs or in HMCLs compared to normal counterparts.
(PDF)
Table S3 The 50 genes with pronostic value in HM and UAMS-TT2 cohorts.
(PDF)
Table S4 The 37 stem cell myeloma genes. (PDF)
Table S5 Clinical characteristics of patients in the 2 groups defined bySCscore. The 206 previously-untreated patients of the HM cohort were treated at the university hospitals of Heidelberg and Montpellier. Patients were separated in 2 groups: low-risk (SCscore # -2.7) and high-risk (SCscore . -2.7) SCscore
groups. Data are the percentages of patients within these 2 groups with the indicated clinical or biological parameters. When the percentages were different with a chisquare test (P # .05), data are shown in bold and italic.
(PDF)
Acknowledgments
We thank the Microarray Core Facility of IRB (http://irb.montp.inserm. fr/en/index.php?page = Plateau&IdEquipe = 6).
Author Contributions
Conceived and designed the experiments: AK BK. Performed the experiments: JT. Analyzed the data: AK. Contributed reagents/materi-als/analysis tools: DH JFR JM HG. Wrote the paper: AK DH JM TR BK.
References
1. Fonseca R, Bergsagel PL, Drach J, Shaughnessy J, Gutierrez N, et al. (2009) International Myeloma Working Group molecular classification of multiple myeloma: spotlight review. Leukemia 23: 2210–2221.
2. Walker BA, Leone PE, Chiecchio L, Dickens NJ, Jenner MW, et al. (2010) A compendium of myeloma-associated chromosomal copy number abnormalities and their prognostic value. Blood 116: e56–65.
3. Shaughnessy JD, Jr., Zhan F, Burington BE, Huang Y, Colla S, et al. (2007) A validated gene expression model of high-risk multiple myeloma is defined by
deregulated expression of genes mapping to chromosome 1. Blood 109: 2276– 2284.
4. Decaux O, Lode L, Magrangeas F, Charbonnel C, Gouraud W, et al. (2008) Prediction of survival in multiple myeloma based on gene expression profiles reveals cell cycle and chromosomal instability signatures in high-risk patients and hyperdiploid signatures in low-risk patients: a study of the Intergroupe Francophone du Myelome. J Clin Oncol 26: 4798–4805.
5. Hose D, Reme T, Hielscher T, Moreaux J, Meissner T, et al. (2011) Proliferation is a central independent prognostic factor and target for personalized and risk adapted treatment in multiple myeloma. Haematologica 96: 87–95.
6. Hose D, Reme T, Meissner T, Moreaux J, Seckinger A, et al. (2009) Inhibition of aurora kinases for tailored risk-adapted treatment of multiple myeloma. Blood 113: 4331–4340.
7. Ghobrial IM (2012) Myeloma as a model for the process of metastasis: implications for therapy. Blood 120: 20–30.
8. Matsui W, Huff CA, Wang Q, Malehorn MT, Barber J, et al. (2004) Characterization of clonogenic multiple myeloma cells. Blood 103: 2332–2336. 9. Chiron D, Surget S, Maiga S, Bataille R, Moreau P, et al. (2012) The peripheral CD138+ population but not the CD138- population contains myeloma clonogenic cells in plasma cell leukaemia patients. Br J Haematol 156: 679–683. 10. Takahashi K, Tanabe K, Ohnuki M, Narita M, Ichisaka T, et al. (2007) Induction of pluripotent stem cells from adult human fibroblasts by defined factors. Cell 131: 861–872.
11. Lonardo E, Hermann PC, Mueller MT, Huber S, Balic A, et al. (2011) Nodal/ Activin signaling drives self-renewal and tumorigenicity of pancreatic cancer stem cells and provides a target for combined drug therapy. Cell Stem Cell 9: 433–446.
12. Schoenhals M, Kassambara A, Vos JD, Hose D, Moreaux J, et al. (2009) Embryonic stem cell markers expression in cancers. Biochemical and Biophysical Research Communications 383: 157–162.
13. Jourdan M, Caraux A, De Vos J, Fiol G, Larroque M, et al. (2009) An in vitro model of differentiation of memory B cells into plasmablasts and plasma cells including detailed phenotypic and molecular characterization. Blood 114: 5173– 5181.
14. Jourdan M, Caraux A, Caron G, Robert N, Fiol G, et al. (2011) Characterization of a transitional preplasmablast population in the process of human B cell to plasma cell differentiation. J Immunol 187: 3931–3941. 15. Matsui W, Wang Q, Barber JP, Brennan S, Smith BD, et al. (2008) Clonogenic
multiple myeloma progenitors, stem cell properties, and drug resistance. Cancer Res 68: 190–197.
16. Chiron D, Surget S, Maiga S, Bataille R, Moreau P, et al. (2011) The peripheral CD138(+) population but not the CD138(2) population contains myeloma clonogenic cells in plasma cell leukaemia patients. Br J Haematol.
17. Jakubikova J, Adamia S, Kost-Alimova M, Klippel S, Cervi D, et al. (2011) Lenalidomide targets clonogenic side population in multiple myeloma: pathophysiologic and clinical implications. Blood 117: 4409–4419.
18. Sprynski AC, Hose D, Caillot L, Reme T, Shaughnessy JD, Jr., et al. (2009) The role of IGF-1 as a major growth factor for myeloma cell lines and the prognostic relevance of the expression of its receptor. Blood 113: 4614–4626.
19. Seckinger A, Meissner T, Moreaux J, Goldschmidt H, Fuhler GM, et al. (2009) Bone morphogenic protein 6: a member of a novel class of prognostic factors expressed by normal and malignant plasma cells inhibiting proliferation and angiogenesis. Oncogene 28: 3866–3879.
20. Holien T, Vatsveen TK, Hella H, Rampa C, Brede G, et al. (2011) Bone morphogenetic proteins induce apoptosis in multiple myeloma cells by Smad-dependent repression of MYC. Leukemia.
21. Legg JA, Herbert JM, Clissold P, Bicknell R (2008) Slits and Roundabouts in cancer, tumour angiogenesis and endothelial cell migration. Angiogenesis 11: 13–21.
22. Brose K, Bland KS, Wang KH, Arnott D, Henzel W, et al. (1999) Slit proteins bind Robo receptors and have an evolutionarily conserved role in repulsive axon guidance. Cell 96: 795–806.
23. Wang B, Xiao Y, Ding BB, Zhang N, Yuan X, et al. (2003) Induction of tumor angiogenesis by Slit-Robo signaling and inhibition of cancer growth by blocking Robo activity. Cancer Cell 4: 19–29.
24. Schmid BC, Rezniczek GA, Fabjani G, Yoneda T, Leodolter S, et al. (2007) The neuronal guidance cue Slit2 induces targeted migration and may play a role in brain metastasis of breast cancer cells. Breast Cancer Res Treat 106: 333–342. 25. Mahtouk K CF, Re`me T, Jourdan M, Baudard M, Moreaux J, et al. (2006) Heparan sulphate proteoglycans are essential for the myeloma cell growth activity of EGF-family ligands in multiple myeloma. Oncogene 25: 7180–7191. 26. Wessler I, Kirkpatrick CJ, Racke K (1999) The cholinergic ‘pitfall’: acetylcholine, a universal cell molecule in biological systems, including humans. Clin Exp Pharmacol Physiol 26: 198–205.
27. Wessler I, Kilbinger H, Bittinger F, Kirkpatrick CJ (2001) The biological role of non-neuronal acetylcholine in plants and humans. Jpn J Pharmacol 85: 2–10.
28. Sperling LE, Steinert G, Boutter J, Landgraf D, Hescheler J, et al. (2008) Characterisation of cholinesterase expression during murine embryonic stem cell differentiation. Chem Biol Interact 175: 156–160.
29. Paraoanu LE, Steinert G, Koehler A, Wessler I, Layer PG (2007) Expression and possible functions of the cholinergic system in a murine embryonic stem cell line. Life Sci 80: 2375–2379.
30. Szymanski P, Janik A, Zurek E, Mikiciuk-Olasik E (2011) Design, synthesis and biological evaluation of new 2-benzoxazolinone derivatives as potential cholinesterase inhibitors for therapy of alzheimer’s disease. Pharmazie 66: 399–403.
31. Bjerke GA, Hyman-Walsh C, Wotton D (2011) Cooperative transcriptional activation by Klf4, Meis2, and Pbx1. Mol Cell Biol 31: 3723–3733. 32. Barber KE, Harrison CJ, Broadfield ZJ, Stewart AR, Wright SL, et al. (2007)
Molecular cytogenetic characterization of TCF3 (E2A)/19p13.3 rearrangements in B-cell precursor acute lymphoblastic leukemia. Genes Chromosomes Cancer 46: 478–486.
33. Chan KK, Zhang J, Chia NY, Chan YS, Sim HS, et al. (2009) KLF4 and PBX1 directly regulate NANOG expression in human embryonic stem cells. Stem Cells 27: 2114–2125.
34. Jaruzelska J, Kotecki M, Kusz K, Spik A, Firpo M, et al. (2003) Conservation of a Pumilio-Nanos complex from Drosophila germ plasm to human germ cells. Dev Genes Evol 213: 120–126.
35. Wang Z, Lin H (2004) Nanos maintains germline stem cell self-renewal by preventing differentiation. Science 303: 2016–2019.
36. Rickelt S, Winter-Simanowski S, Noffz E, Kuhn C, Franke WW (2009) Upregulation of plakophilin-2 and its acquisition to adherens junctions identifies a novel molecular ensemble of cell-cell-attachment characteristic for transformed mesenchymal cells. Int J Cancer 125: 2036–2048.
37. Groen RW, de Rooij MF, Kocemba KA, Reijmers RM, de Haan-Kramer A, et al. (2011) N-cadherin-mediated adhesion of multiple myeloma cells inhibits osteoblast differentiation. Haematologica.
38. Moreaux J, Cremer FW, Reme T, Raab M, Mahtouk K, et al. (2005) The level of TACI gene expression in myeloma cells is associated with a signature of microenvironment dependence versus a plasmablastic signature. Blood 106: 1021–1030.
39. Moreaux J, Hose D, Kassambara A, Reme T, Moine P, et al. (2011) Osteoclast-gene expression profiling reveals osteoclast-derived CCR2 chemokines promot-ing myeloma cell migration. Blood 117: 1280–1290.
40. Corre J, Mahtouk K, Attal M, Gadelorge M, Huynh A, et al. (2007) Bone marrow mesenchymal stem cells are abnormal in multiple myeloma. Leukemia 21: 1079–1088.
41. Zhang XG, Gaillard JP, Robillard N, Lu ZY, Gu ZJ, et al. (1994) Reproducible obtaining of human myeloma cell lines as a model for tumor stem cell study in human multiple myeloma. Blood 83: 3654–3663.
42. Rebouissou C, Wijdenes J, Autissier P, Tarte K, Costes V, et al. (1998) A gp130 Interleukin-6 Transducer-Dependent SCID Model of Human Multiple Myeloma. Blood 91: 4727–4737.
43. Gu ZJ, Vos JD, Rebouissou C, Jourdan M, Zhang XG, et al. (2000) Agonist anti-gp130 transducer monoclonal antibodies are human myeloma cell survival and growth factors. Leukemia 14: 188–197.
44. Moreaux J, Klein B, Bataille R, Descamps G, Maiga S, et al. (2011) A high-risk signature for patients with multiple myeloma established from the molecular classification of human myeloma cell lines. Haematologica 96: 574–582. 45. Barlogie B, Tricot G, Rasmussen E, Anaissie E, van Rhee F, et al. (2006) Total
therapy 2 without thalidomide in comparison with total therapy 1: role of intensified induction and posttransplantation consolidation therapies. Blood 107: 2633–2638.
46. Cremer FW, Bila J, Buck I, Kartal M, Hose D, et al. (2005) Delineation of distinct subgroups of multiple myeloma and a model for clonal evolution based on interphase cytogenetics. Genes Chromosomes Cancer 44: 194–203. 47. Xiong W, Wu X, Starnes S, Johnson SK, Haessler J, et al. (2008) An analysis of
the clinical and biologic significance of TP53 loss and the identification of potential novel transcriptional targets of TP53 in multiple myeloma. Blood 112: 4235–4246.
48. Reme T, Hose D, De Vos J, Vassal A, Poulain PO, et al. (2008) A new method for class prediction based on signed-rank algorithms applied to Affymetrix microarray experiments. BMC Bioinformatics 9: 16.
49. Tanguy Le Carrour SA, Sylvie Tondeur, Ludovic Lhermitte, Ned Lamb, Thierry Reme, et al. (2010) Amazonia!: An Online Resource to Google and Visualize Public Human whole Genome Expression Data. The Open Bioinformatics Journal 4 5–10.
50. Team RDC (2008) R: A Language and Environment for Statistical Computing. Vienna, Austria: R Foundation for Statistical Computing; 2008.
51. Gentleman RC, Carey VJ, Bates DM, Bolstad B, Dettling M, et al. (2004) Bioconductor: open software development for computational biology and bioinformatics. Genome Biol 5: R80.