arXiv:hep-ex/0008016v1 9 Aug 2000
EUROPEAN ORGANIZATION FOR NUCLEAR RESEARCH
CERN-EP/2000-106 July 26, 2000
Measurement of the ¯
B
0
and
B
−
Meson Lifetimes
The ALEPH Collaboration
Abstract
The lifetimes of the ¯B0 and B−mesons are measured using a sample of about
four million hadronic Z decays collected from 1991 to 1995 with the Aleph detector at LEP. The data sample has been recently reprocessed, achieving a substantial improvement in the tracking performance. Semileptonic decays of
¯
B0 and B−mesons are partially reconstructed by identifying events containing
a lepton with an associated D⋆+ or D0 meson. The proper time of the B
meson is estimated from the measured decay length and the momentum of the D-lepton system. A fit to the proper time of 1880 D⋆+
ℓ− and 2856 D0ℓ−
candidates yields the following results:
τB¯0 = 1.518 ± 0.053 ± 0.034 ps,
τB− = 1.648 ± 0.049 ± 0.035 ps,
τB−/τB¯0 = 1.085 ± 0.059 ± 0.018.
The ALEPH Collaboration
R. Barate, D. Decamp, P. Ghez, C. Goy, J.-P. Lees, E. Merle, M.-N. Minard, B. Pietrzyk
Laboratoire de Physique des Particules (LAPP), IN2
P3
-CNRS, F-74019 Annecy-le-Vieux Cedex, France
S. Bravo, M.P. Casado, M. Chmeissani, J.M. Crespo, E. Fernandez, M. Fernandez-Bosman, Ll. Garrido,15
E. Graug´es, M. Martinez, G. Merino, R. Miquel, Ll.M. Mir, A. Pacheco, H. Ruiz
Institut de F´isica d’Altes Energies, Universitat Aut`onoma de Barcelona, E-08193 Bellaterra
(Barcelona), Spain7
A. Colaleo, D. Creanza, M. de Palma, G. Iaselli, G. Maggi, M. Maggi,1
S. Nuzzo, A. Ranieri, G. Raso,23
F. Ruggieri, G. Selvaggi, L. Silvestris, P. Tempesta, A. Tricomi,3
G. Zito Dipartimento di Fisica, INFN Sezione di Bari, I-70126 Bari, Italy
X. Huang, J. Lin, Q. Ouyang, T. Wang, Y. Xie, R. Xu, S. Xue, J. Zhang, L. Zhang, W. Zhao
Institute of High Energy Physics, Academia Sinica, Beijing, The People’s Republic of China8
D. Abbaneo, G. Boix,6
O. Buchm¨uller, M. Cattaneo, F. Cerutti, G. Dissertori, H. Drevermann,
R.W. Forty, M. Frank, T.C. Greening, J.B. Hansen, J. Harvey, P. Janot, B. Jost, I. Lehraus, P. Mato,
A. Minten, A. Moutoussi, F. Ranjard, L. Rolandi, D. Schlatter, M. Schmitt,20
O. Schneider,2
P. Spagnolo, W. Tejessy, F. Teubert, E. Tournefier, A.E. Wright
European Laboratory for Particle Physics (CERN), CH-1211 Geneva 23, Switzerland
Z. Ajaltouni, F. Badaud, G. Chazelle, O. Deschamps, A. Falvard, P. Gay, C. Guicheney, P. Henrard, J. Jousset, B. Michel, S. Monteil, J-C. Montret, D. Pallin, P. Perret, F. Podlyski
Laboratoire de Physique Corpusculaire, Universit´e Blaise Pascal, IN2
P3
-CNRS, Clermont-Ferrand, F-63177 Aubi`ere, France
J.D. Hansen, J.R. Hansen, P.H. Hansen,1
B.S. Nilsson, A. W¨a¨an¨anen
Niels Bohr Institute, DK-2100 Copenhagen, Denmark9
G. Daskalakis, A. Kyriakis, C. Markou, E. Simopoulou, A. Vayaki
Nuclear Research Center Demokritos (NRCD), GR-15310 Attiki, Greece
A. Blondel,12
G. Bonneaud, J.-C. Brient, A. Roug´e, M. Rumpf, M. Swynghedauw, M. Verderi, H. Videau
Laboratoire de Physique Nucl´eaire et des Hautes Energies, Ecole Polytechnique, IN2
P3
-CNRS, F-91128 Palaiseau Cedex, France
E. Focardi, G. Parrini, K. Zachariadou
Dipartimento di Fisica, Universit`a di Firenze, INFN Sezione di Firenze, I-50125 Firenze, Italy
A. Antonelli, M. Antonelli, G. Bencivenni, G. Bologna,4
F. Bossi, P. Campana, G. Capon, V. Chiarella,
P. Laurelli, G. Mannocchi,5
F. Murtas, G.P. Murtas, L. Passalacqua, M. Pepe-Altarelli Laboratori Nazionali dell’INFN (LNF-INFN), I-00044 Frascati, Italy
A.W. Halley, J.G. Lynch, P. Negus, V. O’Shea, C. Raine, P. Teixeira-Dias, A.S. Thompson
Department of Physics and Astronomy, University of Glasgow, Glasgow G12 8QQ,United Kingdom10
R. Cavanaugh, S. Dhamotharan, C. Geweniger,1
P. Hanke, G. Hansper, V. Hepp, E.E. Kluge, A. Putzer,
J. Sommer, K. Tittel, S. Werner,19
M. Wunsch19
Kirchhoff-Institut f¨r Physik, Universit¨at Heidelberg, D-69120 Heidelberg, Germany16
R. Beuselinck, D.M. Binnie, W. Cameron, P.J. Dornan, M. Girone, N. Marinelli, J.K. Sedgbeer,
J.C. Thompson,14
E. Thomson22
V.M. Ghete, P. Girtler, E. Kneringer, D. Kuhn, G. Rudolph
Institut f¨ur Experimentalphysik, Universit¨at Innsbruck, A-6020 Innsbruck, Austria18
C.K. Bowdery, P.G. Buck, A.J. Finch, F. Foster, G. Hughes, R.W.L. Jones, N.A. Robertson
Department of Physics, University of Lancaster, Lancaster LA1 4YB, United Kingdom10
I. Giehl, K. Jakobs, K. Kleinknecht, G. Quast,1
B. Renk, E. Rohne, H.-G. Sander, H. Wachsmuth, C. Zeitnitz
Institut f¨ur Physik, Universit¨at Mainz, D-55099 Mainz, Germany16
A. Bonissent, J. Carr, P. Coyle, O. Leroy, P. Payre, D. Rousseau, M. Talby
Centre de Physique des Particules, Universit´e de la M´editerran´ee, IN2
P3
-CNRS, F-13288 Marseille, France
M. Aleppo, F. Ragusa
Dipartimento di Fisica, Universit`a di Milano e INFN Sezione di Milano, I-20133 Milano, Italy
H. Dietl, G. Ganis, A. Heister, K. H¨uttmann, G. L¨utjens, C. Mannert, W. M¨anner, H.-G. Moser, S. Schael,
R. Settles,1
H. Stenzel, W. Wiedenmann, G. Wolf
Max-Planck-Institut f¨ur Physik, Werner-Heisenberg-Institut, D-80805 M¨unchen, Germany16
P. Azzurri, J. Boucrot,1
O. Callot, S. Chen, A. Cordier, M. Davier, L. Duflot, J.-F. Grivaz, Ph. Heusse,
A. Jacholkowska,1
F. Le Diberder, J. Lefran¸cois, A.-M. Lutz, M.-H. Schune, J.-J. Veillet, I. Videau,1
C. Yuan, D. Zerwas
Laboratoire de l’Acc´el´erateur Lin´eaire, Universit´e de Paris-Sud, IN2
P3
-CNRS, F-91898 Orsay Cedex, France
G. Bagliesi, T. Boccali, G. Calderini, V. Ciulli, L. Fo`a, A. Giassi, F. Ligabue, A. Messineo, F. Palla,1
G. Rizzo, G. Sanguinetti, A. Sciab`a, G. Sguazzoni, R. Tenchini,1
A. Venturi, P.G. Verdini
Dipartimento di Fisica dell’Universit`a, INFN Sezione di Pisa, e Scuola Normale Superiore, I-56010 Pisa, Italy
G.A. Blair, G. Cowan, M.G. Green, T. Medcalf, J.A. Strong, J.H. von Wimmersperg-Toeller
Department of Physics, Royal Holloway & Bedford New College, University of London, Surrey TW20
OEX, United Kingdom10
R.W. Clifft, T.R. Edgecock, P.R. Norton, I.R. Tomalin
Particle Physics Dept., Rutherford Appleton Laboratory, Chilton, Didcot, Oxon OX11 OQX, United
Kingdom10
B. Bloch-Devaux, P. Colas, S. Emery, W. Kozanecki, E. Lan¸con, M.-C. Lemaire, E. Locci, P. Perez,
J. Rander, J.-F. Renardy, A. Roussarie, J.-P. Schuller, J. Schwindling, A. Trabelsi,21
B. Vallage CEA, DAPNIA/Service de Physique des Particules, CE-Saclay, F-91191 Gif-sur-Yvette Cedex,
France17
S.N. Black, J.H. Dann, R.P. Johnson, H.Y. Kim, N. Konstantinidis, A.M. Litke, M.A. McNeil, G. Taylor
Institute for Particle Physics, University of California at Santa Cruz, Santa Cruz, CA 95064, USA13
C.N. Booth, S. Cartwright, F. Combley, M. Lehto, L.F. Thompson
Department of Physics, University of Sheffield, Sheffield S3 7RH, United Kingdom10
K. Affholderbach, A. B¨ohrer, S. Brandt, C. Grupen,1
A. Misiejuk, G. Prange, U. Sieler
Fachbereich Physik, Universit¨at Siegen, D-57068 Siegen, Germany16
G. Giannini, B. Gobbo
Dipartimento di Fisica, Universit`a di Trieste e INFN Sezione di Trieste, I-34127 Trieste, Italy J. Rothberg, S. Wasserbaech
Experimental Elementary Particle Physics, University of Washington, Seattle, WA 98195 U.S.A. S.R. Armstrong, K. Cranmer, P. Elmer, D.P.S. Ferguson, Y. Gao, S. Gonz´alez, O.J. Hayes, H. Hu,
S. Jin, J. Kile, P.A. McNamara III, J. Nielsen, W. Orejudos, Y.B. Pan, Y. Saadi, I.J. Scott, J. Walsh, Sau Lan Wu, X. Wu, G. Zobernig
Department of Physics, University of Wisconsin, Madison, WI 53706, USA11
1
Also at CERN, 1211 Geneva 23, Switzerland.
2
Now at Universit´e de Lausanne, 1015 Lausanne, Switzerland.
3
Also at Dipartimento di Fisica di Catania and INFN Sezione di Catania, 95129 Catania, Italy.
4
Also Istituto di Fisica Generale, Universit`a di Torino, 10125 Torino, Italy.
5
Also Istituto di Cosmo-Geofisica del C.N.R., Torino, Italy.
6
Supported by the Commission of the European Communities, contract ERBFMBICT982894.
7
Supported by CICYT, Spain.
8
Supported by the National Science Foundation of China.
9
Supported by the Danish Natural Science Research Council.
10
Supported by the UK Particle Physics and Astronomy Research Council.
11
Supported by the US Department of Energy, grant DE-FG0295-ER40896.
12
Now at Departement de Physique Corpusculaire, Universit´e de Gen`eve, 1211 Gen`eve 4, Switzerland.
13
Supported by the US Department of Energy, grant DE-FG03-92ER40689.
14
Also at Rutherford Appleton Laboratory, Chilton, Didcot, UK.
15
Permanent address: Universitat de Barcelona, 08208 Barcelona, Spain.
16
Supported by the Bundesministerium f¨ur Bildung, Wissenschaft, Forschung und Technologie,
Germany.
17
Supported by the Direction des Sciences de la Mati`ere, C.E.A.
18
Supported by the Austrian Ministry for Science and Transport.
19
Now at SAP AG, 69185 Walldorf, Germany.
20
Now at Harvard University, Cambridge, MA 02138, U.S.A.
21
Now at D´epartement de Physique, Facult´e des Sciences de Tunis, 1060 Le Belv´ed`ere, Tunisia.
22
Now at Department of Physics, Ohio State University, Columbus, OH 43210-1106, U.S.A.
23
1
Introduction
Measurements of the individual b hadron lifetimes represent an important test of the present knowledge of nonspectator effects in the b hadron decay dynamics, such as Pauli interference, W exchange and weak annihilation. Based on the heavy quark expansion formalism, the difference between the lifetimes of the b baryons and mesons is predicted to depend on 1/m2
b and higher order terms, whereas meson-meson differences depend only
on 1/m3
b and higher order terms [1]. The predicted hierarchy is τΛb < τB¯0 ∼ τBs < τB−.
Differences are expected to be at the level of a few percent, which sets the scale of the experimental precision required.
This paper reports an improved measurement of the ¯B0 and B− lifetimes with the
Aleph detector at LEP, using approximately four million hadronic decays of the Z, collected in the period 1991–1995. This data sample was recently reprocessed, achieving higher efficiency and better resolution in the track reconstruction, which is highly beneficial for this analysis.
Semileptonic decays of ¯B0 and B− mesons are partially reconstructed by identifying
events containing a lepton (electron or muon) with an associated D0 or D⋆+ meson. The
resulting D0-lepton (D0ℓ−) and D⋆+-lepton (D⋆+ℓ−) event samples consist mostly of B−
and ¯B0 decays, respectively (charge conjugate modes are implied throughout this paper).
Previous measurements of the ¯B0 and B− lifetimes are reported in [2, 3].
2
The ALEPH detector
A detailed description of the Aleph detector can be found elsewhere [4, 5]. A high resolution vertex detector (VDET) consisting of two layers of silicon with double-sided readout provides measurements in the rφ and z directions at average radii of 6.5 cm and 11.3 cm, with 12 µm precision at normal incidence. The VDET provides full azimuthal coverage, and polar angle coverage to |cos θ| < 0.85 for the inner layer only and |cos θ| < 0.69 for both layers. Outside the VDET, particles traverse the inner tracking chamber (ITC) and the time projection chamber (TPC). The ITC is a cylindrical drift chamber with eight axial wire layers at radii of 16 to 26 cm. The TPC measures up to 21 space points per track at radii between 40 and 171 cm, and also provides a measurement of the specific ionization energy loss (dE/dx) of each charged track. These three detectors form the tracking system, which is immersed in a 1.5 T axial magnetic field provided by a superconducting solenoid. The combined tracking system yields a momentum resolution transverse to the beam axis of σ(pT)/pT = 6 × 10⁻⁴ pT ⊕ 0.005 (pT in GeV/c). The
resolution of the three-dimensional impact parameter for tracks having two VDET hits can be parametrized as σ = 25 µm + 95 µm/p (p in GeV/c) [6].
The electromagnetic calorimeter (ECAL) is a lead/wire-chamber sandwich operated in proportional mode. The calorimeter is read out in projective towers that subtend typically 0.9◦× 0.9◦ in solid angle, segmented in three longitudinal sections. The hadron
calorimeter (HCAL) uses the iron return yoke as absorber. Hadronic showers are sampled by 23 planes of streamer tubes, with analogue projective tower and digital hit pattern readout. The HCAL is used in combination with two double layers of muon chambers outside the magnet for muon identification.
Recently the LEP1 data were reprocessed using improved reconstruction algorithms. The features that are particularly relevant for the enhancement of the charmed meson reconstruction efficiency are the following. A new VDET pattern recognition algorithm allows groups of several nearby tracks which may share common hits to be analysed together, to find the hit assignments that minimize the overall χ2 for the event. The
improvement in the hit association efficiency is more than 2% (from 89.2% to 91.0% in rφ and from 85.6% to 88.2% in z). Information on the drift time from the TPC wires is combined with that obtained from the pads to reduce the error in the z coordinate by a factor of two. A 30% improvement in the rφ coordinate resolution is achieved for low momentum tracks by correcting the pad coordinates for ionisation fluctuations along the tracks as measured by the wires. The particle identification (dE/dx) is improved by combining pulse height data from the TPC pads with that of the wires. The improvements in the charmed meson reconstruction efficiencies with respect to the previous analysis range from 10 to 30%, depending on the decay channel.
3
Event selection
The D⋆+
ℓ− and D0ℓ− event samples consist of an identified lepton (e or µ) associated
with a fully reconstructed D⋆+ or D0 candidate. The selection of muons and electrons
is described in detail in [7]. For this analysis, lepton candidates are required to have a momentum of at least 2.0 GeV/c for electrons and 2.5 GeV/c for muons.
The D⋆+ and D0 candidates are reconstructed from charged tracks and π0’s that
form an angle of less than 45◦ with the lepton candidate. These charged tracks are also
required to intersect a cylinder of radius 2 cm and half-length 4 cm centered on the nominal interaction point, to have at least 4 hits in the TPC, a polar angle θ such that |cos θ| < 0.95 and a transverse momentum greater than 200 MeV/c.
Photons and π0’s are identified in the ECAL. The four-momenta of π0 candidates are computed by adding the photon momenta when the γγ invariant mass is consistent with the π0 mass. The energy of the π0 is then recomputed using the kinematical constraint
of the π0 mass [6]. The energy resolution achieved is about 6.5%, almost independent of
the energy. For reconstructing the D0 candidates, only π0’s with momenta greater than
2 GeV/c are used.
For all charged kaons used to reconstruct the D0 it is required that the dE/dx be
within 3σ of that expected from a kaon, except for the D⋆+→ D0π+, D0 → K−π+decay
channel. The kaon has the same sign as the lepton coming from the B semileptonic decay, therefore this charge correlation is required.
K0
S candidates are reconstructed from pairs of oppositely charged tracks. The two
tracks are required to be inconsistent with originating from the interaction point and the KS0 candidate is rejected if the measured mass is more than 2σ (±10 MeV/c2) from the
nominal K0 S mass.
Tracks coming from the D0 decays are required to form a common vertex with a χ2
confidence level greater than 1%. In the D0 decay channels that do not contain a π0
in the final state, if more than one combination satisfies the selection criteria, the one with the smallest χ2 of the D vertex fit is selected. For the decay modes where the
multiple candidates originate from different π0 combinations, for a given detected lepton, the candidate with mD0π − mD0 closest to the nominal value is chosen in case of D⋆
selection, otherwise the highest momentum D0 candidate is chosen.
In order to reject the background from charm, to improve the signal to background ratio and to ensure well-measured decay lengths, additional selection criteria are applied to all the subsamples. The invariant mass of the D(⋆)ℓ system is required to be greater
than 3 GeV/c2, where D(⋆) can be D⋆+
or D0. This cut significantly reduces the charm
background while keeping ∼ 85% of the signal. To exploit the high precision of the silicon vertex detector, the lepton track and at least two tracks from the D0 decay are required
to have at least one VDET hit in both the rφ and z projections.
3.1
The D
⋆-lepton selection
D⋆+
candidates are identified via the decay D⋆+
→ D0π+, followed by D0 → K−π+,
D0 → K−π+π−π+, D0 → K−π+π0 or D0 → K0
Sπ+π−. The difference in mass between
the D⋆+ and D0 candidates must lie within 1.5 MeV/c2 (approximately two standard
deviations of the experimental resolution) of the nominal value of 145.4 MeV/c2.
In the D0 → K−π+ channel, the D0 momentum p
D0 is required to be greater than
5 GeV/c.
For the D0 → K−π+π−π+ channel p
D0 must be greater than 8 GeV/c, and at least
two of the D0 decay tracks must have p > 1 GeV/c.
In the case of the D0 → K−π+π0 channel, the momentum of the reconstructed D0 is
required to be greater than 10 GeV/c, and the two charged tracks in the decay are required to have p > 0.5 GeV/c. Futhermore the decay kinematics are required to be consistent with one of the three resonant decays: D0 → K−ρ+, D0 → K⋆−π+, D0 → ¯K⋆0π0. For
each decay hypothesis the mass of the resonant particle and the helicity angle θH are
calculated.1 If the mass is consistent with the nominal resonance mass value, within its
natural width, and if | cos θH| > 0.4, the candidate is considered to be consistent with the
resonant decay hypothesis. For these resonant decays a cos2θ
H distribution is expected.
Finally, in the D0 → K0
Sπ+π− channel, the momentum of the reconstructed D0 is
required to be greater than 4 GeV/c. The same technique as in the D0 → K−π+π0
channel is used to tag the K⋆− resonance. The sign of the resonance is used to distinguish
between D0 and ¯D0.
3.2
The D
0-lepton selection
The D0ℓ− sample consists of events with a lepton and a D0 candidate, where the D0 is
not the decay product of a reconstructed D⋆+. The D0 candidates are identified using
the same decay modes as for the D⋆+
ℓ−sample. For this sample, the background is larger
because the D⋆+
–D0 mass difference criterion is not applicable.
For all the decay modes selected in the D0ℓ−sample, a search for the additional pion
is performed to reject D0 candidates coming from D⋆+
→ D0π+. If a pion candidate is
1
The helicity angle θHis defined as the angle between the scalar particle and one of the decay products
found yielding a D⋆+–D0 mass difference within 6 MeV/c2 of the nominal value, the D0ℓ−
candidate is rejected. The efficiency for reconstructing the additional pion and rejecting D0’s coming from D⋆+
decays is found to be 86% from the Monte Carlo simulation. In the D0 → K−π+ channel, the reconstructed D0’s are required to have
pD0 > 8 GeV/c, pK > 2 GeV/c and pπ > 1.5 GeV/c. In the D0 → K−π+π−π+ channel
the D0 momentum is required to exceed 12 GeV/c while the kaon and the three pions
must have momenta greater than 2 and 1 GeV/c, respectively.
The cuts on the kaon and pion momenta are tightened for the D0 → K−π+π0
channel, to pK > 3 GeV/c and pπ > 2 GeV/c, while the reconstructed D0 must have
pD0 > 12 GeV/c. The same cuts on the three resonances are used as in the D
⋆+ℓ−event
sample.
Finally, for the D0 → K0
Sπ+π− channel a cut is applied of at least 1.5 GeV/c on
the kaon momentum and 1.0 GeV/c on the two pion momenta. The momentum of the reconstructed D0 candidates is required to be greater than 10 GeV/c. The same technique
is used to tag the K⋆− resonance as in the D⋆+
ℓ− event sample.
3.3
B meson reconstruction
The B decay vertex position is estimated by vertexing the reconstructed D0 track with
the lepton. Events are rejected if the B vertex fit gives a χ2 probability less than 1%.
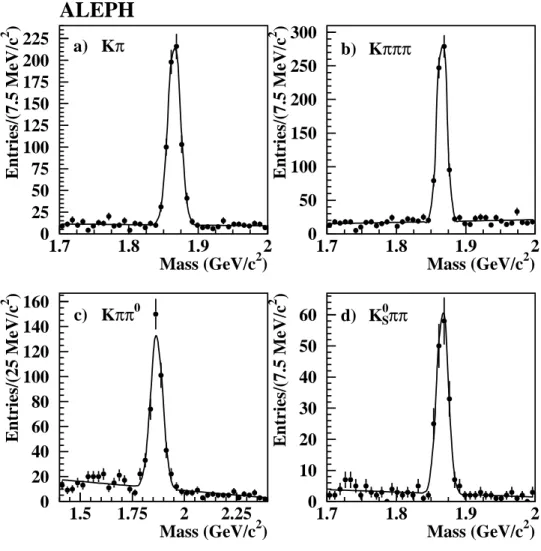
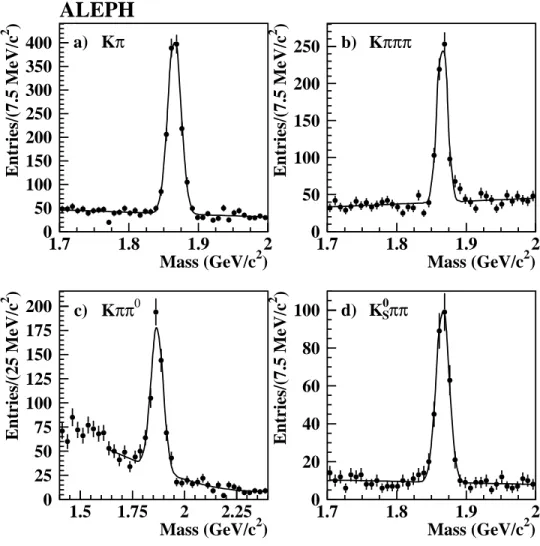
The D0 candidate mass spectra for the four subsamples in the D⋆+ℓ− event selection
are shown in Fig. 1, and in the D0ℓ− event selection in Fig. 2. The fitted curves consist
of a Gaussian function for the signal plus a linear background. For the D0 → K−π+π0
in the D0ℓ−sample a Gaussian tail is used to describe the background; masses below
1.65 GeV/c2 are excluded to avoid the broad enhancement due to the missing π0 in
the D0 → K−π+π0π0 decay. The fitted D0 width and the fitted number of signal and
background events within a window of ±2σ around the fitted mass are shown in Table 1 for the different samples.
Events reconstructed within two standard deviations of the fitted D0 mass are selected
for the lifetime analysis, resulting in 1880 D⋆+ℓ− and 2856 D0ℓ− candidates. The decay
length is calculated for these events by reconstructing the primary and B decay vertices in three dimensions. The primary vertex reconstruction algorithm [8] applied to simulated b¯b events yields an average resolution of 50 µm × 10 µm × 60 µm (horizontal × vertical × beam direction).
The distance between the primary and B decay vertices is projected onto the direction defined by the momentum of the D(⋆)ℓ system. The uncertainty on the flight direction
due to the missing neutrino induces a negligible error on the decay length. The resolution on the B decay length is on average 250 µm, compared with an average B decay length of about 2.5 mm.
For the D0 → K−π+π0 channel, the π0 momentum is included when extrapolating the
neutral D0 track backwards to form the B vertex. In the case of D⋆+
ℓ− events, the soft
pion from the D⋆+ decay does not improve the resolution on the B decay length and is
therefore not used in the reconstruction of the B vertex.
Because the selected decays contain an undetected neutrino, the B momentum is not 4
0 25 50 75 100 125 150 175 200 225 1.7 1.8 1.9 2 Mass (GeV/c2) Entries/(7.5 MeV/c 2 ) a) Kπ
ALEPH
0 50 100 150 200 250 300 1.7 1.8 1.9 2 Mass (GeV/c2) Entries/(7.5 MeV/c 2 ) b) Kπππ 0 20 40 60 80 100 120 140 160 1.5 1.75 2 2.25 Mass (GeV/c2) Entries/(25 MeV/c 2 ) c) Kππ0 0 10 20 30 40 50 60 1.7 1.8 1.9 2 Mass (GeV/c2) Entries/(7.5 MeV/c 2 ) d) K0SππFigure 1: The invariant mass of D0 candidates for the four subsamples in the D⋆+ℓ− event
selection: a) D0 → K−π+, b) D0 → K−π+π−π+, c) D0 → K−π+π0 (notice the different mass scale), d) D0 → KS0π−π+. The superimposed curves are the results of the fit described in the text.
known precisely and is reconstructed using an energy flow technique as described in [9]. A further correction is applied by evaluating for Monte Carlo events the κ distribution, defined as
κ = (βγ)reco (βγ)B
. (1)
Because this distribution depends on the selection criteria applied, separate κ distributions are calculated for each subsample. The momentum resolution obtained is between 8 and 10%, depending on the decay channel.
0 50 100 150 200 250 300 350 400 1.7 1.8 1.9 2 Mass (GeV/c2) Entries/(7.5 MeV/c 2 ) a) Kπ
ALEPH
0 50 100 150 200 250 1.7 1.8 1.9 2 Mass (GeV/c2) Entries/(7.5 MeV/c 2 ) b) Kπππ 0 25 50 75 100 125 150 175 200 1.5 1.75 2 2.25 Mass (GeV/c2) Entries/(25 MeV/c 2 ) c) Kππ0 0 20 40 60 80 100 1.7 1.8 1.9 2 Mass (GeV/c2) Entries/(7.5 MeV/c 2 ) d) K0SππFigure 2: The invariant mass of D0 candidates for the four subsamples in the D0ℓ− event
selection: a) D0 → K−π+, b) D0 → K−π+π−π+, c) D0 → K−π+π0 (notice the different mass scale), d) D0 → KS0π+π−. The superimposed curves are the results of the fit described in the
text.
4
Lifetime measurement
An unbinned likelihood fit for the lifetimes is performed. For each event the probability of observing a proper time t given the lifetime τ is calculated: the probability density function F (t, σt, τ ) is obtained by convoluting an exponential distribution with the
properly normalised κ distribution and with a Gaussian function which takes into account the resolution on the decay length.
Both the D⋆+ℓ− and D0ℓ− samples contain a mixture of ¯B0 and B− decays and the
B−/ ¯B0mixture in the samples depends on the ratio of the lifetimes, as discussed in Section
4.2. Therefore, to measure the ¯B0 and B− lifetimes a simultaneous maximum likelihood
fit is performed to all the events. The likelihood function contains three components for
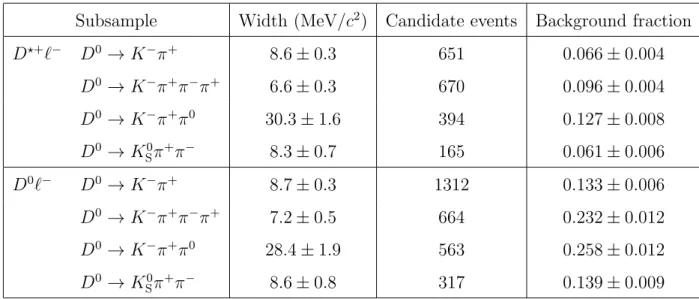
Table 1: Fitted D0 width (σ), number of D0 candidates and fraction of background events
falling within a mass window of ±2σ. The uncertainties are statistical only.
Subsample Width (MeV/c2) Candidate events Background fraction
D⋆+ ℓ− D0 → K−π+ 8.6 ± 0.3 651 0.066 ± 0.004 D0 → K−π+π−π+ 6.6 ± 0.3 670 0.096 ± 0.004 D0 → K−π+π0 30.3 ± 1.6 394 0.127 ± 0.008 D0 → K0 Sπ+π− 8.3 ± 0.7 165 0.061 ± 0.006 D0ℓ− D0 → K−π+ 8.7 ± 0.3 1312 0.133 ± 0.006 D0 → K−π+π−π+ 7.2 ± 0.5 664 0.232 ± 0.012 D0 → K−π+π0 28.4 ± 1.9 563 0.258 ± 0.012 D0 → K0 Sπ+π− 8.6 ± 0.8 317 0.139 ± 0.009
each sample and is written as L = ND⋆ℓ Y i=1 h f⋆ −(τB−/τB¯0)F (ti, σi, τB−) + f ⋆ 0(τB−/τB¯0)F (ti, σi, τB¯0) + f ⋆ bkgF ⋆ bkg(ti) i × ND0ℓ Y i=1 h f0 −(τB−/τB¯0)F (ti, σi, τB−) + f0 0(τB−/τB¯0)F (ti, σi, τB¯0) + f0 bkgFbkg0 (ti) i . (2) The coefficients f⋆ − and f ⋆
0 are the fractions of the D
⋆+ℓ− sample arising from B− and ¯B0
decays, respectively. Similarly, f0
− and f 0
0 are the fractions of B− and ¯B0 decays in the
D0ℓ− sample. The coefficients f⋆
bkg and fbkg0 are the background fractions of the samples,
while the functions F⋆
bkg(t) and Fbkg0 (t) are their normalised proper time distributions.
4.1
Backgrounds
Background contamination arises from the following sources: (1) combinatorial background, i.e. candidates with a fake D(⋆);
(2) the process ¯B → D−
sD(∗)X, followed by D−s → ℓ−X, giving rise to a real D(⋆) and
a real lepton;
(3) a real D(⋆) meson accompanied by a fake or nonprompt lepton, from Z → b¯b or
Z → c¯c events.
Source (1) is the dominant background. Its contribution is determined from a fit to the D0 mass distributions, and its magnitude is given in Table 1 for the various subsamples.
The proper time distribution for this source is determined from the data by selecting events from the high mass sideband of the D0 peak. The same selection criteria described
in Section 3 are applied to the background samples, except that the requirement on the D⋆+–D0 mass difference in the case of the D⋆+ℓ− events is removed to increase the
statistics. A function consisting of a Gaussian plus positive and negative exponential tails is used to describe these data.
The contribution from source (2) is calculated from the measured branching ratios for this process [10] and a Monte Carlo simulation to determine the detection efficiency; it accounts for a contamination which is about 2–3% of the sample, depending on the channel.
The background from source (3) is estimated from the measured hadron-lepton misidentification probabilities [7] and the measured inclusive D0 and D⋆+ rates. An
independent estimate is obtained using wrong-sign (D⋆+ℓ+ or D0ℓ+) events, and is
found to be consistent. This background source contributes between 2 and 5% of the sample, depending on the channel. To characterize the proper time distribution of this background, it is further subdivided into three distinct components: fake leptons coming from the primary vertex in c¯c and b¯b events, and fake leptons coming from a decaying b hadron.
The proper time distribution for sources (2) and (3) are determined from simulated events.
4.2
Sample compositions
Both the D⋆+ℓ− and D0ℓ− samples contain a mixture of ¯B0 and B− decays. In order
to estimate the cross contamination, the individual semileptonic branching ratios of the ¯
B0 and B− must be determined. The evaluation follows the same procedure as given
in the appendix of [2]. An important input in this evaluation is the knowledge of the branching ratios for the decay modes B → D⋆⋆
πℓν, where D⋆⋆
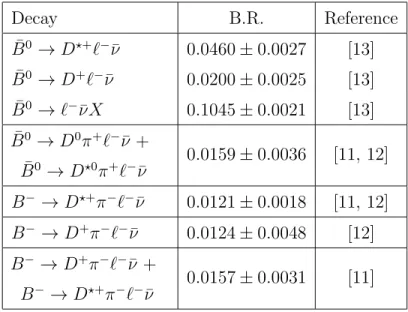
represents any of the p−wave resonances as well as the nonresonant D(⋆)π states. The most recent ALEPH and DELPHI results [11, 12] for both the resonant and the nonresonant components are used in the calculation, leading to a significant reduction in the resulting uncertainty compared to the previous analysis of [2]. The ¯B0 and B− content of the two samples are
calculated using as input the measured values of the branching ratios given in Table 2. The sample composition is then calculated by considering the ¯B0 and B− decay channels
that contribute to the D⋆+ℓ−and D0ℓ−samples [2, 14], taking into account the probability
of 0.147 ± 0.015 that a D⋆+ℓ− event is mistakenly reconstructed as a D0ℓ− event.
As a consequence of this procedure, the coefficients f⋆ −, f
⋆
0, f−0 and f 0
0 appearing in
the likelihood function (Eq. 2) depend on the lifetime ratio. For equal lifetimes, about 85% of the B decays in the D⋆+ℓ− sample are attributed to ¯B0, while about 80% of the
D0ℓ− sample B decays come from B−.
4.3
Fit results
The fit to the proper time distributions of the D⋆+ℓ− and D0ℓ− events is performed to
determine the two free parameters τB¯0 and τB−. The values obtained are
τB¯0 = 1.518 ± 0.053 ps,
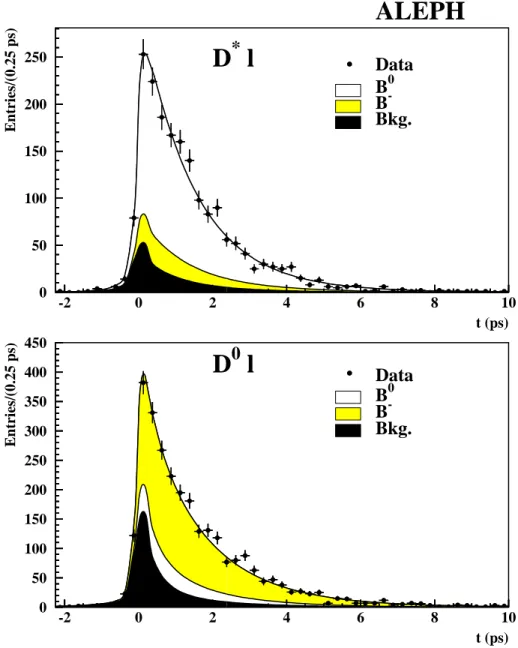
0 50 100 150 200 250 -2 0 2 4 6 8 10 B0 B -Bkg. Data t (ps) Entries/(0.25 ps)
ALEPH
D
*l
0 50 100 150 200 250 300 350 400 450 -2 0 2 4 6 8 10 B0 B -Bkg. Data t (ps) Entries/(0.25 ps)D
0l
Figure 3: Proper time distributions with the result of the fit overlaid for the two samples. The plots show the background contributions to the samples, together with the ¯B0 and B−
components.
τB− = 1.648 ± 0.049 ps,
where the errors are statistical only. The statistical correlation coefficient is −0.35. The ratio of the lifetimes is
τB−/τB¯0 = 1.085 ± 0.059,
taking into account the correlation.
The proper time distributions for the two samples are shown in Fig. 3, with the results of the fit overlaid.
4.4
Systematic uncertainties
The sources of systematic uncertainty are discussed in the following, and the estimated errors are summarized in Table 3.
The uncertainty in the B momentum reconstruction is dominated by the uncertainty in the κ distribution. The effects that can modify the κ function with a consequence on the extracted lifetimes are studied. The first is due to the D(⋆)π content of semileptonic B
decays, which affects the κ function due to the smaller phase space available and the softer momentum spectrum of the reconstructed D(⋆)ℓ system. The fractions of D(⋆)π decays
are varied in the simulation within experimental errors. Other effects studied are the dependence of the κ distribution on the analysis cuts and the b fragmentation function. These two effects combined give a relative uncertainty of about 2% in the B momentum determination. Uncertainties in the κ distribution propagate in the same way to τB− and
τB¯0, and therefore have a small effect in the ratio.
Uncertainties in the background fractions and proper time distributions are considered. The combinatorial background, estimated in the data from fits to the D0 mass spectra, is
reported in Table 1 for each individual channel. The systematic uncertainty due to this source is estimated by varying the combinatorial background in the fit for each channel within its statistical errors in turn and taking the sum in quadrature. The contamination from physics background is evaluated using the simulation, by varying the fraction within the estimated uncertainty and repeating the fits. The uncertainty on the total background level is calculated by combining the two above sources.
The parameters describing the background proper time distributions are varied within their uncertainties. Background proper time distributions are parametrized using different methods, to check for possible systematic bias. Different background samples are selected by varying the sideband regions, adding events from the lower sideband, which are excluded in the lifetime determination, or using events with wrong-sign correlations. Some cuts in the selection are varied to check the stability of the parametrizations. The shapes extracted from real data are compared with those extracted from Monte Carlo events. The resulting differences in the fitted lifetimes are used to estimate the systematic uncertainty. For the remaining systematic errors, which are small compared to the statistical ones, the correlation between the lifetimes is not propagated into the ratio.
The systematic uncertainty due to the sample compositions is determined by varying the branching fractions of Table 2 within ±1σ from the central values. In addition the uncertainty due to the assumption of isospin conservation has been estimated, allowing for a variation of 20% relative to the exact symmetry.
As explained in detail in [2], a small fraction of four-body decays where an extra pion is produced in the decay of the B meson contributes to the sample composition, and is characterized by a different selection efficiency with respect to the real signal. The relative efficiencies
ǫ(B → D(⋆)πℓν)
ǫ(B → D(⋆)ℓν) = 0.75 ± 0.10 (for ¯B
0) 0.64 ± 0.10 (for B−)
therefore enter into the calculation and this uncertainty (coming from the limited Monte Carlo statistics) is propagated to the measured lifetimes.
Table 2: Branching ratios used as input values in the calculation of the sample composition. Decay B.R. Reference ¯ B0 → D⋆+ℓ−ν¯ 0.0460 ± 0.0027 [13] ¯ B0 → D+ℓ−ν¯ 0.0200 ± 0.0025 [13] ¯ B0 → ℓ−νX¯ 0.1045 ± 0.0021 [13] ¯ B0 → D0π+ℓ−ν +¯ ¯ B0 → D⋆0π+ℓ−ν¯ 0.0159 ± 0.0036 [11, 12] B− → D⋆+π−ℓ−ν¯ 0.0121 ± 0.0018 [11, 12] B− → D+π−ℓ−ν¯ 0.0124 ± 0.0048 [12] B− → D+π−ℓ−ν +¯ B− → D⋆+π−ℓ−ν¯ 0.0157 ± 0.0031 [11]
Table 3: Sources of systematic error on the fitted lifetimes.
Source of error Contribution to systematic error τB¯0 (ps) τB− (ps) τB−/τB¯0
B momentum reconstruction ±0.025 ±0.026 ±0.009 Background treatment ±0.020 ±0.020 ±0.010
Sample compositions ±0.003 ±0.003 ±0.004
D(⋆)πℓ−ν relative efficiency ±0.006 ±0.006 ±0.006
Decay length resolution ±0.008 ±0.008 ±0.008
Total ±0.034 ±0.035 ±0.018
The parameters of the decay length resolution function are varied within their errors to estimate the resulting uncertainty [14].
5
Conclusions
The lifetimes of the charged and neutral B mesons have been measured with the full statistics collected by the Aleph detector at and around the Z peak energy. The data sample was recently reprocessed, achieving improved tracking performance. A maximum likelihood fit to the proper time distributions of 1880 D⋆+ℓ− and 2856 D0ℓ− candidates
yields the following results for the ¯B0 and B− lifetimes and their ratio:
τB¯0 = 1.518 ± 0.053 ± 0.034 ps,
τB−/τB¯0 = 1.085 ± 0.059 ± 0.018 ,
where the first error is statistical and the second is systematic.
These results supersede the corresponding ones of [2]. Averaging with the results of the other methods presented in [2] the combined values are:
τB¯0 = 1.496 ± 0.048 ± 0.033 ps,
τB− = 1.644 ± 0.048 ± 0.034 ps,
τB−/τB¯0 = 1.104 ± 0.057 ± 0.019.
Acknowledgments
We thank our colleagues in the accelerator divisions for the excellent performance of LEP. Thanks also to the many engineering and technical personnel at CERN and at the home institutes for their contributions to the performance of the Aleph detector. Those of us from non-member states thank CERN for its hospitality.
References
[1] I. Bigi, N. Uraltsev, Gluonic enhancements in non-spectator beauty decays: an inclusive mirage though an exclusive possibility, Phys. Lett. B280 (1992) 271; I. Bigi, M. Shifman and N. Uraltsev, Aspects of heavy quark theory, Ann. Rev. Nucl. Part. Sci. 47 (1997) 591, and references therein;
M. Neubert and C.T. Sachrajda, Spectator effects in inclusive decays of beauty hadrons, Nucl. Phys. B483 (1997) 339.
[2] ALEPH Collaboration, Improved measurement of the ¯B0 and B− meson lifetimes,
Z. Phys. C71 (1996) 31.
[3] CDF Collaboration, Measurement of the B− and ¯B0 meson lifetimes using
semileptonic decays, Phys. Rev. D58 (1998) 092002;
CDF Collaboration, Measurement of B hadron lifetimes using J/ψ final states at CDF, Phys. Rev. D57 (1998) 5382;
DELPHI Collaboration, A measurement of B+ and B0 lifetimes using ¯Dℓ+ events,
Z. Phys. C68 (1995) 13;
DELPHI Collaboration, Lifetimes of charged and neutral B hadrons using event topology, Z. Phys. C68 (1995) 363.
DELPHI Collaboration, A precise measurement of the B0
dmeson lifetime using a new
technique, Z. Phys. C74 (1997) 19;
L3 Collaboration, L3 Note 2142, June 30, 1998. Measurement of the B0
d meson lifetime
using the decay ¯B0 d → D
⋆+
Xlν, paper contributed to the XXIX Int. Conf. on High Energy Physics, July 13–29 1998, Vancouver, Canada;
OPAL Collaboration, Improved measurement of the B0 and B+ meson lifetimes, Z.
Phys. C67 (1995) 379;
OPAL Collaboration, Measurement of the B+ and B0 lifetimes and search for CP(T)
violation using reconstructed secondary vertices, CERN–EP/98–195. To be published in Eur. Phys. J. C;
SLD Collaboration, Measurement of the B+ and B0 lifetimes using topological
reconstruction of inclusive and semileptonic decays, Phys. Rev. Lett. 79 (1997) 590. SLD Collaboration Measurement of the B+ and B0 Lifetimes using Topological
Vertexing at SLD, SLAC-PUB-8206 (July 1999), paper contributed to the International Europhysics Conference on High Energy Physics, July 15–21 1999, Tampere, Finland.
[4] ALEPH Collaboration, ALEPH: a detector for electron-positron annihilations at LEP, Nucl. Instr. Meth. A 294 (1990) 121.
[5] B. Mours et al., The design, construction and performance of the ALEPH silicon vertex detector, Nucl. Instr. Meth. A 379 (1996) 101.
[6] ALEPH Collaboration, Performance of the ALEPH detector at LEP, Nucl. Instr. Meth. A 360 (1995) 481.
[7] ALEPH Collaboration, Heavy quark tagging with leptons in the ALEPH detector, Nucl. Instr. Meth. A 346 (1994) 461.
[8] ALEPH Collaboration, A precise measurement of Γ(Z → b¯b)/Γ(Z → hadrons), Phys. Lett. B313 (1993) 535.
[9] ALEPH Collaboration, Measurement of the effective b quark fragmentation function at the Z resonance, Phys. Lett. B357 (1995) 699.
[10] CLEO Collaboration, Exclusive and inclusive decays of b mesons into Ds mesons,
Phys. Rev. Lett. 64 (1990) 2117.
ARGUS Collaboration, Production of D+
s mesons in b decays and determination of
f (Ds), Z. Phys. C54 (1992) 1.
[11] ALEPH Collaboration, Production of orbitally excited charm mesons in semileptonic b decays, Z. Phys. C73 (1997) 601.
[12] DELPHI Collaboration, Measurement of the ¯B → D(⋆)πℓν
ℓ Branching Fraction,
CERN-EP/99-174.
[13] C. Caso et al., Particle Data Group, Eur. Phys. J. C3 (1998) 1.
[14] G. Calderini, Measurement of the B+ and B0 Meson Lifetimes at ALEPH, Ph.D.