Publisher’s version / Version de l'éditeur:
Vous avez des questions? Nous pouvons vous aider. Pour communiquer directement avec un auteur, consultez la première page de la revue dans laquelle son article a été publié afin de trouver ses coordonnées. Si vous n’arrivez pas à les repérer, communiquez avec nous à PublicationsArchive-ArchivesPublications@nrc-cnrc.gc.ca.
Questions? Contact the NRC Publications Archive team at
PublicationsArchive-ArchivesPublications@nrc-cnrc.gc.ca. If you wish to email the authors directly, please see the first page of the publication for their contact information.
https://publications-cnrc.canada.ca/fra/droits
L’accès à ce site Web et l’utilisation de son contenu sont assujettis aux conditions présentées dans le site LISEZ CES CONDITIONS ATTENTIVEMENT AVANT D’UTILISER CE SITE WEB.
IBPSA-Canada eSim Conference [Proceedings], pp. 1-8, 2008-05-20
READ THESE TERMS AND CONDITIONS CAREFULLY BEFORE USING THIS WEBSITE.
https://nrc-publications.canada.ca/eng/copyright
NRC Publications Archive Record / Notice des Archives des publications du CNRC :
https://nrc-publications.canada.ca/eng/view/object/?id=bc38374c-562d-4f19-ba10-2f13113a84a1 https://publications-cnrc.canada.ca/fra/voir/objet/?id=bc38374c-562d-4f19-ba10-2f13113a84a1
NRC Publications Archive
Archives des publications du CNRC
This publication could be one of several versions: author’s original, accepted manuscript or the publisher’s version. / La version de cette publication peut être l’une des suivantes : la version prépublication de l’auteur, la version acceptée du manuscrit ou la version de l’éditeur.
Access and use of this website and the material on it are subject to the Terms and Conditions set forth at
Field performance of exterior solar shadings for residential windows:
winter results
Laouadi, A.; Galasiu, A. D.; Swinton, M. C.; Manning, M. M.; Marchand, R.
G.; Arsenault, C. D.; Szadkowski, F.
http://irc.nrc-cnrc.gc.ca
F i e l d p e r f o r m a n c e o f e x t e r i o r s o l a r s h a d i n g s
f o r r e s i d e n t i a l w i n d o w s : w i n t e r r e s u l t s
N R C C - 5 0 4 6 7
L a o u a d i , A . ; G a l a s i u , A . D . ; S w i n t o n , M . C . ;
M a n n i n g , M . M . ; M a r c h a n d , R . G . ; A r s e n a u l t ,
C . D . ; S z a d k o w s k i , F .
A version of this document is published in / Une version de ce document se trouve dans: IBPSA-Canada eSim Conference, Quebec City, May 20-22, 2008, pp. 1-8
The material in this document is covered by the provisions of the Copyright Act, by Canadian laws, policies, regulations and international agreements. Such provisions serve to identify the information source and, in specific instances, to prohibit reproduction of materials without written permission. For more information visit http://laws.justice.gc.ca/en/showtdm/cs/C-42
Les renseignements dans ce document sont protégés par la Loi sur le droit d'auteur, par les lois, les politiques et les règlements du Canada et des accords internationaux. Ces dispositions permettent d'identifier la source de l'information et, dans certains cas, d'interdire la copie de documents sans permission écrite. Pour obtenir de plus amples renseignements : http://lois.justice.gc.ca/fr/showtdm/cs/C-42
FIELD PERFORMANCE OF EXTERIOR SOLAR SHADINGS
FOR RESIDENTIAL WINDOWS: WINTER RESULTS
A. Laouadi, A.D. Galasiu, M.C. Swinton, M.M. Manning, R.G. Marchand,
C.D. Arsenault, F. Szadkowski
Institute for Research in Construction, National Research Council Canada, 1200 Montreal
Road, Ottawa, Ontario, Canada, K1A 0R6
Fax: +1 613 954 3733
Tel: +1 613 990 6868 Email: aziz.laouadi@nrc-cnrc.gc.ca
ABSTRACT
Recent statistics published by Natural Resources Canada estimated that the energy demand for heating and cooling accounts for about 63% of the total energy use of an average Canadian home. Although the overall demand for cooling energy is much lower than the demand for heating, many populated areas experience a peak demand for electricity on summer afternoons. Exterior window shading devices have the potential to reduce solar overheating in summer and heat losses in winter, and to improve the thermal comfort of the house occupants when seated near windows, compared to interior shadings. This work is part of a project which aims to develop guidelines for effective exterior, mid-pane (inside the window) and interior shading devices in Canadian residences. This paper reports on the first winter field measurements of exterior rollshutters at the Canadian Centre for Housing Technology. Exterior insulating rollshutters were installed on the windows of a typical, four-bedroom, two-storey detached house and were compared to interior blinds installed in an identical neighbouring house. In both houses, the shading devices were open during daytime hours to let solar heat in and were closed during night-time to reduce window heat loss. The results from two weeks of measurements showed that the rollshutters reduced the window heat loss by 19% compared to interior blinds. This heat loss reduction was translated into savings of about 4±2% in furnace gas use. The window internal surface temperature was about 3oC to 5oC higher when covered by rollshutters than when covered by interior blinds. This indicates a significant reduction in the risk of moisture condensation on the window interior surface.
INTRODUCTION
In Canada, the energy demand for heating and cooling accounts for 63% of the total energy use of the average home. Although the overall demand for cooling energy is much lower than that for heating, many populated areas experience a peak demand for electricity on summer afternoons. Exterior movable solar shading devices installed on windows, such as insulating rollshutters, may reduce the energy use and peak demand for heating and cooling. They may also improve thermal comfort conditions near windows and reduce the risk of moisture condensation on the interior surfaces of windows. Exterior shading devices are common in Europe, where some countries even offer tax incentives for their installation in dwellings (e.g., France, MINEFI 2005). However, in cold climates such as Canada’s, the use of exterior shading devices is very limited compared to the ubiquitous interior shadings. The effect of window exterior shadings compared to window interior shadings on the overall energy use of Canadian houses is not known. Determining this shading effect is important for both the design of new houses, where high performance windows are becoming the standard, as well as for the retrofitting of old houses, which employ conventional windows.
A previous field study conducted at the twin-houses of the Canadian Centre for Housing Technology (CCHT) showed that the daytime cooling energy used by the house with interior Venetian blinds covering its south-facing windows was 10-12% lower than that used by the reference house with uncovered windows (Galasiu et al., 2005). When opaque exterior shadings consisting of white plastic panels were used instead of Venetian blinds, the daytime cooling energy was 70% lower compared
to uncovered windows. These experiments also showed that the exterior shades saved about 25% of cooling energy compared to interior Venetian blinds when both were closed during a 24-hour period.
Subsequent summer experiments showed daily cooling energy savings of up to 27% when reflective interior shades made of aluminium foil bubble wrap were used, and the seasonal cooling energy savings were estimated to be 10% when compared with windows covered by interior Venetian blinds with slats horizontal (Manning et al., 2006). These experiments also showed that the reflective internal shades substantially increased the glass internal surface temperature (by more than 25oC) when used with high performance windows with low-e coating and argon gas fill. Large temperature differences (~30oC) were also observed between the glass centre and its edge. Excessive glass temperatures and thermal stresses due to temperature differences between the centre and the edge of the glass are not desirable as the durability of the window components may be jeopardized (glass breakage, spacer seal, gas ex-filtration, etc.) if these components are not designed to withstand high temperatures.
This work is part of a project aiming to develop guidelines for effective window solar shadings of Canadian houses when using: (a) movable exterior shading devices, (b) mid-pane blinds (blinds in-between the glass layers), and (c) various interior reflective solar shading devices. The project will address the following issues: (1) thermal peak loads and energy use for heating and cooling of new and retrofitted Canadian houses; (2) energy costs and paybacks; (3) occupant thermal and visual comfort; and (4) potential risk of condensation and thermal stresses on conventional and high performance windows. In addition, the project will gather information on how homeowners use shading devices, the types of controls involved, and how these factors affect the energy demand. This paper presents the winter energy performance and thermal comfort of exterior operable insulating rollshutters installed at the Canadian Centre for Housing Technology. The main goal of the field measurements was to compare the house energy use and the occupant thermal comfort in the house equipped with exterior rollshutters versus similar performance metrics measured in the reference house equipped with interior Venetian blinds.
DESCRIPTION OF CCHT TWIN
HOUSES
The CCHT facility is located in Ottawa, Ontario, at the Montreal Road campus of the National Research Council Canada. The facility is jointly operated by the National Research Council Canada, Natural Resources Canada, and Canada Mortgage and Housing Corporation. It consists of two side-by-side twin-houses as shown in Figure 1. The house on the right is used as a baseline (Reference House), while the house on the left is used for testing of advanced technologies (Test House). Both houses are two-storey high, have a total area of 210 m2 (2260 ft2), and were built according to the R-2000 standard. Each house includes a total of 26 high performance double-glass windows (with low-e coating on surface #3, insulated spacer, and 95% argon gas concentration) and a north-facing glazed patio door with a total glass area of 24.14 m2. The windows are distributed as follows: 11 south-facing windows (10.22 m2); 12 north-facing windows (10.97 m2); one west-facing window (1.3 m2) and 2 east-facing windows (1.65 m2). The houses include a simulated occupancy system that reproduces the daily water draws and electrical loads of a family of four. The internal heat gains from the occupants are also simulated. Both houses employ high efficiency gas furnaces for heating and continuous flow heat recovery ventilators. The houses feature a programmable thermostat, located in the central hallway on the main floor. The set point temperature for heating is fixed at 21°C (70 °F). More details about the CCHT research center can be found at
http://www.ccht-cctr.gc.ca/main_e.html.
Figure 1 The Twin-House Facility of the Canadian Center for Housing Technology (CCHT)
DESCRIPTION OF THE SHADING
DEVICES
For this project all windows of the Reference House were fitted with a mix of common interior horizontal Venetian blinds (on most windows) and vertical blinds (on patio glass door, dining room window and stairwell window). The slats of the Venetian blinds were slightly curved and made of aluminium with the following characteristics: slat spacing = 0.02 m, slat width = 0.025 m, slat visible reflectance = 63%. The vertical blinds were made of fabric with the following characteristics: slat spacing = 0.075 m, slat width = 0.090 m, slat visible reflectance = 71%. All interior blinds were mounted outside the window frames, leaving an open air space between the blinds and the wall incorporating the window frames.
All windows of the Test House, except the east facing windows (which were kept identical to those in the Reference House) were fitted with movable rollshutters. The rollshutters were made of fixed and articulated painted aluminium slats (beige color) with a sandwiched polyurethane insulation and had the following characteristics: slat thickness = 0.006 m (with 0.004 m thick insulation), slat spacing = slat width = 0.038 m, and slat visible reflectance = 56%. The rollshutters were not designed to allow slat positioning and could only be adjusted up and down in the vertical plane of the window using side railings installed on the outside brick walls. A rubber gasket installed between the side railings and the walls sealed the air space between the shutters and windows. The bottom of the shutters was not, however, completely sealed to the window sill, and had a few holes to allow for water drainage. Figure 2 shows a rollshutter installed on the south-facing 2nd floor window in a closed position.
Figure 2 Rollshutter on a south-facing Test House window
MEASUREMENT SETUP
Before the window shading experiments, the similarity between the two houses was verified through benchmarking tests conducted over a total of 20 discontinuous days between October 28, 2007 and January 30, 2008 with the houses in the same configuration. During the benchmarking tests, the windows in both houses were equipped with interior Venetian blinds with slats in an open horizontal position.
The window shading measurements covered a two-week period, from February 1 to 14, 2008. During the testing period, the shading devices in both houses were opened daily from 9 AM to 5 PM to allow solar heat in during daytime, and were closed during the remaining hours to reduce the heat loss to the outside during night-time. Note that in the Test House, open blinds meant that blinds still covered the window area but had their slats positioned horizontally (or vertically for the vertical blinds) to admit light into the rooms, whereas in the Reference House the rollshutters were drawn up all the way to the top, leaving the glazing area completely unobstructed. The following performance indicators were measured in both houses:
AIR TEMPERATURE AND RELATIVE HUMIDITY
As part of the regular instrumentation each house had a thermocouple and a relative humidity sensor located on the ground floor. An exterior thermocouple and a relative humidity sensor were also located on the north side of the Reference House to measure the outdoor conditions.
ELECTRICAL ENERGY AND GAS USE
The electrical energy use of the furnace circulation fan and the furnace gas use were measured in each house on a 5-minute basis by individual electric meters with pulse output at a resolution of 0.6 Wh/pulse (2.0 Btu/pulse) and 1.4 L/pulse (0.05 ft3/pulse). Additional electric meters measured the energy use of the other electric end-users, including lights and appliances.
SOLAR RADIATION
Horizontal and south-facing vertical pyranometers were used to measure the horizontal and vertical global solar radiation (W/m2).
THERMAL AND AIR MEASUREMENTS NEAR WINDOWS
Conditions important for thermal comfort (air temperature and velocity, globe temperature and relative humidity) were measured at a distance of 1.2 meters from the south-facing living room window and were used to calculate the predicted percentage of dissatisfied (PPD) index. This model is widely used and accepted in the design and field assessment of thermal comfort conditions and predicts the mean value of the thermal votes of a large group of people exposed to the same environment (ISO 7730, 1984; ANSI/ASHRAE 55-1992).
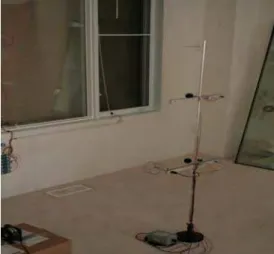
Globe temperature probes (for operative temperature measurements), thermocouples (for air temperature measurements) and hot wire anemometers (for air velocity measurements) were installed on a tripod at two occupant positions: seated, 0.6 meters from floor, and standing, 1.1 meters from floor (Figure 3). A horizontal illuminance meter was also used to measure daylight availability at a height of 0.6 meters from the floor. The globe temperature measurements, which incorporated the effect of the transmitted solar radiation, were used to estimate the mean radiant temperature necessary in the calculation of the PPD index. An equivalent mean radiant temperature was defined to take into account this solar effect.
Figure 3 Probes for thermal and air measurements (air temperature and velocity, globe temperature and illuminance) near the south-facing window
WINDOW AND SHADING TEMPERATURES
The south, west and north-facing windows in each house were equipped with thermocouples, which measured the surface temperature at one exterior location (center of glass), and four interior locations (center of glass, bottom/top edge of glass and sill). The thermocouples were secured to the windows and sill surfaces with conductive epoxy. Additional thermocouples were used for the south-facing windows on the ground floor, which measured the temperature of the interior blind slats, as well as the temperature on the inside and outside surfaces of the exterior rollshutters.
ANALYSIS
Figure 4 shows the daily gas and electrical energy use of the furnace and the circulation fan for both houses. The data was analyzed using a side-by-side method, as described in Swinton et al. (2001). The method consists of plotting the daily energy use of the Test House against the daily energy use of the Reference House. During the 20–day benchmarking period (also shown in Figure 4), the houses were operated in an identical configuration. Should the houses have been completely identical, the benchmark trendline would have had a slope of 1 and an intercept of 0. However, in reality, the benchmark trendline can never be perfect, due to small relative differences between the two houses (e.g., resulting from the relative position of the houses to one another and the ensuing shading and solar effects; the heating systems not being perfectly synchronized, etc.).
Similarly, data collected during the window shading tests shows the daily energy use of the Test House equipped with exterior rollshutters versus that of the Reference house equipped with interior blinds. The savings in energy use were calculated to reflect for any given day the difference between the measured and the expected energy use of the Test House relative to the energy use of the Reference House.
FURNACE GAS AND HEATING ENERGY USE
As shown in Figures 4 and 5, the rollshutters decreased the heating energy use and the gas use of the Test House on average by 4±2% compared to the Reference House. The testing period comprised mostly of days with overcast skies (11 days out of 14) and temperatures ranging from a minimum of –
19°C during night-time to a maximum +4°C during daytime.
WINDOW TEMPERATURE AND HEAT LOSS
Figures 6 and 7 show the temperatures of the outdoor and indoor surfaces of the living-room and dining room windows measured on February 11, 2008, along with the calculated corresponding heat loss differences (plotted on the second axis). The data shown was recorded on one of the only 3 days in the testing period with a clear sky. This day was also one of the coldest days with daytime high of – 11.6 °C and a night-time low of –16.2 °C.
As shown, during night-time, when all shading devices were closed, the window heat loss in the test house was on average 17% to 22% lower than that in the reference house. However, during daytime when the shading devices were open in both houses, the solar radiation absorbed by the windows offset the heat loss to the outside, particularly for the south-facing windows. For the north-facing windows of the dining room, the heat loss difference was about 4%, indicating that the interior open blinds did not contribute significantly to diminishing the heat loss to the outside compared to the fully uncovered windows of the Test House. At night, the exterior rollshutters increased the temperature of the outdoor glass surface by about 10°C, which translated into a temperature of the indoor glass surface about 4°C higher in the Test House compared to the Reference House. The risk of moisture condensation on interior window surfaces was thus significantly reduced with exterior rollshutters.
THERMAL AND AIR MEASUREMENTS NEAR
WINDOWS
Figure 8 shows the operative temperatures as measured by the globe thermometers, and the calculated PPD index for February 11, 2008. The comfort limits of the operative temperature as specified in the ISO 7730 (1984) standard (Top_lower_limit and Top_upper limit) are also plotted. The PPD index was calculated for a sedentary person (household activity level = 1.2 met) wearing typical winter household clothing (clo=1). PPD values lower than 10% with a corresponding operative temperature range of 20oC to 24oC are considered acceptable thermal environments (ISO 7730, 1984). At night, both shading devices resulted in similar thermal comfort conditions (PPD<10%, and operative temperatures within the comfort limit). The colder window
internal surface of the Reference House was shielded by the interior blinds, the temperature of which was close to the room temperature (20oC). Around noon-time, the operative temperature in the Test House reached a maximum of 33°C, which was 5°C higher than that in the Reference House. This was due to the interior blinds of the Reference House, which reduced the amount of solar radiation reaching the point of measurement compared to the uncovered window of the Test House. The maximum PPD index in the Test House reached almost 90%. However, a householder, unlike a worker, is free to take actions to alleviate such discomfort when it occurs. They may alter the thermostat, move to another location, or draw the blinds, for example, all actions that were not simulated in these studies. Research has shown that the presence of dynamic solar radiation or of an interesting outdoor view are likely to affect people’s judgment relative to their thermal and visual comfort (Tuaycharoen and Tregenza, 2007).
CONCLUSION
This paper presents the results of the winter field measurements conducted at the Canadian Centre for Housing Technology to assess the relative heating energy performance of exterior movable shading devices for residential windows versus typical interior shading. Two types of shading devices (exterior insulating rollshutters and Venetian blinds) were installed on the windows of two side-by-side typical Canadian houses and measurements of furnace gas use, heating energy use, window surface temperature, and conditions important for thermal comfort near windows were collected for two consecutive weeks. The results showed that insulating rollshutters reduced the house heating energy use and the furnace gas use by 4 ± 2% compared to interior blinds. During night-time when the rollshutters covered the windows, the heat loss was reduced by about 19% compared to interior blinds. Due to the lower temperature differential through the window layers, the interior window surface temperature was about 3oC to 5oC higher with rollshutters than with interior blinds. The risk of moisture condensation on windows was thus much improved with rollshutters. During night-time, both types of shading devices resulted in similar thermal and air conditions near windows.
Note, however, that in spite of the benefits resulting from the use of rollshutters versus interior blinds, caution should be applied in using exterior shading
devices in winter conditions where there is a risk of ice build up that may lead to operating problems. Such concerns were not addressed in this study. There are no such risks in the summer, when energy and comfort benefits are expected to be considerably higher. Summer performance measurements are scheduled for July and August, 2008.
ACKNOWLEDGMENT
This work was financially supported by the Institute for Research in Construction of the National Research Council Canada; CETC Buildings Group of Natural Resources Canada; Canada Mortgage and Housing Corporation, Pilkington USA; Hydro Quebec; Prelco Inc.; and Talius. The authors are very grateful for all these contributions and support. Thanks are also due to Mr. Dominic Robillard for his assistance in the field implementation of the project.
REFERENCES
ANSI/ASHRAE Standard 55-1992, Thermal
Environmental Conditions for Human Occupancy,
Atlanta: American Society of Heating, Refrigeration and Air-Conditioning Engineers, 1992.
Galasiu, A.D.; Reinhart, C.F.; Swinton, M.C.; Manning, M.M. Assessment of Energy Performance
of Window Shading Systems at the Canadian Centre for Housing Technology, Research Report,
Institute for Research in Construction, National
Research Council Canada, RR-196, 2005,
http://irc.nrc-cnrc.gc.ca/pubs/rr/rr196/
ISO Standard 7730-1984, Moderate Thermal
Environments – Determination of the PMV and PPD Indices and Specification of the Conditions for Thermal Comfort, International Organization
for Standardization.
Manning, M.M.; Swinton, M.C.; Ruet, K.
Assessment of Reflective Interior Shades at the Canadian Centre for Housing Technology, B-6020,
2007, http://irc.nrc-cnrc.gc.ca/pubs/fulltext/b-6020/.
MINEFI, Document pour remplir la déclaration
des revenus de 2005, Ministére de l’économie des
Finances et de l’emploi, France,
http://www2.finances.gouv.fr/calcul_impot/2006/p df/form-2041-GR.pdf
Swinton, M.C.; Moussa, H.; Marchand, R.G.
Commissioning twin houses for assessing the performance of energy conserving technologies, Performance of Exterior Envelopes of Whole Buildings VIII Integration of Building Envelopes,
2001,
http://irc.nrc-cnrc.gc.ca/pubs/fulltext/nrcc44995.
Tuaycharoen, N., Tregenza, P.R., View and
discomfort glare from windows, Lighting Research
y = 1.0161x R2 = 0.9993 y = 0.9793x R2 = 0.9924 0 100 200 300 400 500 0 100 200 300 400 500
Reference House Furnace Gas & Electrical Use (MJ)
T est Ho u se F u rn ace G as & El ectri cal Use (MJ) Benchmark 2007-2008 Blinds Project Linear (Benchmark 2007-2008) Linear (Blinds Project)
Benchmark
Blinds Project
Figure 4 Daily furnace heating energy use of the CCHT houses
y = 1.0182x R2 = 0.9993 y = 0.9778x R2 = 0.9924 0 50 100 150 200 250 300 350 400 450 500 0 100 200 300 400 500
Reference House Furnace Gas Energy Use (MJ)
T est Ho u se F u rn ace Gas En erg y Use (MJ) Benchmark 2007-2008 Blinds Project Linear (Benchmark 2007-2008) Linear (Blinds Project)
Benchmark
Blinds Project
-40 -30 -20 -10 0 10 20 30 40 0:00 2:00 4:00 6:00 8:00 10:00 12:00 14:00 16:00 18:00 20:00 22:00 0:00 Time of day (hr.) Tem p er atur e (° C) -40 -20 0 20 40 60 80 100
Heat loss differ
e
nce (%
)
Ref.: centre ext. Test: centre ext. Ref.: centre int. Test: centre int. Difference: south
11-Feb-08
Figure 6 Temperature and heat loss difference of the living-room south-facing window.
-40 -30 -20 -10 0 10 20 30 40 0:00 2:00 4:00 6:00 8:00 10:00 12:00 14:00 16:00 18:00 20:00 22:00 0:00 Time of day (hr.) T em p eratu re (°C) -40 -20 0 20 40 60 80 100 Heat lo ss d ifferen ce (% )
Ref.: centre ext. Test: centre ext. Ref.: centre int. Test: centre int. Difference: north
11-Feb-08
Figure 7 Temperature and heat loss difference of the dining room north-facing window
0 10 20 30 40 50 60 70 80 90 100 0:00 2:00 4:00 6:00 8:00 10:00 12:00 14:00 16:00 18:00 20:00 22:00 Time of Day (hr.) PPD ( % ) 0 5 10 15 20 25 30 35 Tem p er atur e (° C) PPD: Reference House PPD: Test House Toperative: Reference House Toperative: Test House Top_lower_limit Top_upper_limit
11-Feb-08 (clear sky)
Figure 8 PPD index, operative temperature comfort limits and space operative temperatures at a height of 0.6m from the floor surface and at a distance of 1.2m from the living-room south-facing window on February 11, 2008