Publisher’s version / Version de l'éditeur:
Journal of Applied Polymer Science, 57, 12, pp. 1473-1481, 1995-09-19
READ THESE TERMS AND CONDITIONS CAREFULLY BEFORE USING THIS WEBSITE. https://nrc-publications.canada.ca/eng/copyright
Vous avez des questions? Nous pouvons vous aider. Pour communiquer directement avec un auteur, consultez la
première page de la revue dans laquelle son article a été publié afin de trouver ses coordonnées. Si vous n’arrivez pas à les repérer, communiquez avec nous à PublicationsArchive-ArchivesPublications@nrc-cnrc.gc.ca.
Questions? Contact the NRC Publications Archive team at
PublicationsArchive-ArchivesPublications@nrc-cnrc.gc.ca. If you wish to email the authors directly, please see the first page of the publication for their contact information.
NRC Publications Archive
Archives des publications du CNRC
This publication could be one of several versions: author’s original, accepted manuscript or the publisher’s version. / La version de cette publication peut être l’une des suivantes : la version prépublication de l’auteur, la version acceptée du manuscrit ou la version de l’éditeur.
For the publisher’s version, please access the DOI link below./ Pour consulter la version de l’éditeur, utilisez le lien DOI ci-dessous.
https://doi.org/10.1002/app.1995.070571207
Access and use of this website and the material on it are subject to the Terms and Conditions set forth at
Effect of evaporation time on the pervaporation characteristics through
homogeneous aromatic polyamide membranes. I. Pure water
permeation and membrane characterization by sorption measurements
Yamasaki, Akihiro; Tyagi, R. K.; Fouda, A.; Matsuura, T .
https://publications-cnrc.canada.ca/fra/droits
L’accès à ce site Web et l’utilisation de son contenu sont assujettis aux conditions présentées dans le site LISEZ CES CONDITIONS ATTENTIVEMENT AVANT D’UTILISER CE SITE WEB.
NRC Publications Record / Notice d'Archives des publications de CNRC:
https://nrc-publications.canada.ca/eng/view/object/?id=5de59388-3cfd-4734-ab33-53daee666ad3 https://publications-cnrc.canada.ca/fra/voir/objet/?id=5de59388-3cfd-4734-ab33-53daee666ad3Effect of Evaporation Time
on
the Pervaporation
Characteristics Through Homogeneous Aromatic Polyamide
Membranes.
zyxwvutsrqponmlkjihgfedcbaZYXWVUTSRQPONMLKJIHGFEDCBA
I.
Pure Water Permeation and Membrane
Characterization
by
Sorption Measurements*
A K l H l R O YAMASAKI, R. K. TYACI, A. FOUDA,' and T. MATSUURA*
zyxwvutsrqponmlkjihgfedcbaZYXWVUTSRQPONMLKJIHGFEDCBA
Institute for Environmental Research and Technology, National Research Council of Canada, Ottawa, Ontario K1 A O R 6 Canada
SYNOPSIS
zyxwvutsrqponmlkjihgfedcbaZYXWVUTSRQPONMLKJIHGFEDCBA
The pervaporation of pure water through homogeneous aromatic polyamide membranes was investigated. The structure of the prepared membranes was controlled by varying the
solvent evaporation times before the gelation step from
zyxwvutsrqponmlkjihgfedcbaZYXWVUTSRQPONMLKJIHGFEDCBA
5 min to 240 min. The permeationflux of pure water decreased rapidly when the solvent evaporation time increased from 5 min to 30 min, and the decrease was rather moderate a t higher evaporation times. Vapor and liquid sorption measurements were used to characterize the membranes. The amount of vapor sorption at a given relative pressure increased with an increase in the solvent evaporation time. The specific surface area of the membranes, calculated from the vapor sorption isotherm, increased with evaporation time up to 30 min, and remained constant thereafter. Liquid sorption volume, on the other hand, decreased monotonically with an increase in evaporation time. The formation of channels in the membrane is used to explain the morphology change during the solvent evaporation. The increase in the solvent evap- oration time gradually increases the number of the channels in the membrane and decreases their average size. Good correlation was observed between the average size of the channels (represented by the ratio of specific volume to the specific surface area) and the parameters
associated with pervaporation transport.
zyxwvutsrqponmlkjihgfedcbaZYXWVUTSRQPONMLKJIHGFEDCBA
0 1995 John Wiley & Sons, Inc.I
NTRODU
zyxwvutsrqponmlkjihgfedcbaZYXWVUTSRQPONMLKJIHGFEDCBA
CTlO NPervaporation has been recognized nowadays as one of the most versatile membrane separation pro- cesses.' In particular, pervaporation is used for the dehydration of organic solvents and the removal of a small quantity of organic compounds from water. A potentially useful application of pervaporation is separation of azeotropic mixtures.
Because the fabrication of the membrane is the key to the success of this process, a number of new
* NRCC No. 37592
To whom correspondence should be addressed.
Industrial Membrane Research Institute, the University of
Ottawa, Ottawa, Ontario, K1N 6N5 Canada.
Journal of Applied Polymer Science, Vol. 57, 1473-1481 (1995)
zyxwvutsrqponmlkjihgfedcbaZYXWVUTSRQPONMLKJIHGFEDCBA
0 1995 John Wiley & Sons, Inc. CCC 0021-8995/95/121473-09
polymeric materials have been synthesized and tested for pervaporation performance. Interest- ingly, however, the study of the effects of variables involved in the membrane preparation procedure was almost completely neglected. This is in con- trast to reverse osmosis, ultrafiltration, and gas separation
membrane^.^-^
One of the reasons may be that commercially available pervaporation membranes are composite membranes like GFTmembrane, l o where a thin dense film is coated on a porous substrate membrane. The thin dense layer is considered to be homogeneous, and the intrinsic permeation property of the polymer that constitutes the dense layer is thought to gov- ern the selectivity of the composite membrane. Then, the method to prepare the thin dense layer is not considered to affect the membrane performance.
1474
zyxwvutsrqponmlkjihgfedcbaZYXWVUTSRQPONMLKJIHGFEDCBA
YAMASAKIzyxwvutsrqponmlkjihgfedcbaZYXWVUTSRQPONMLKJIHGFEDCBA
ET AL.The thin dense layer looks, indeed, homogeneous and structureless when observed under an electron microscope. However, the above observation does not necessarily preclude the possibility of the pres- ence of the polymeric structure in a scale smaller than the resolution of scanning electron microscopy
(SEM) ,
zyxwvutsrqponmlkjihgfedcbaZYXWVUTSRQPONMLKJIHGFEDCBA
and different structures may exist, depend- ing on the variables involved in the preparation pro-cedure of the homogeneous membranes. Examples of such variables are solvent used to make polymer solutions, polymer concentration in the solution, nature and amount of the additive in the polymer solution, solvent evaporation time, evaporation temperature, and amount of the residual solvent.
The objective of this work is to investigate the effect of the evaporation time on the structure of pervaporation membranes and on their pervapora- tion performance. The pervaporation performance of pure water was strongly affected by the evapo- ration time of the solvent, and a trend was observed between the pervaporation permeability and the evaporation time. These results suggest the changes of the membrane structure due to the difference in the solvent evaporation time. Because all the mem- branes studied look homogeneous, SEM technique can no longer serve as a tool to observe the difference in the membrane structure. Instead, adsorption data of water both in liquid and vapor phase were used to investigate the membrane structure. The pervap- oration data of water were further correlated to the parameters that represent the membrane structure.
EXPERIMENT
Materials and Membrane Preparation
The polymer used in this study was poly-m-phen- ylene-iso ( 7 0 ) -co-tere (30) -phtalamide, which was synthesized in our laboratory according to the method reported elsewhere.'* Membranes were pre- pared as follows: casting the solution on a glass plate, evaporation of the solvent, and gelation in cold wa- ter. The casting solution consists of 10.3 wt % poly- mer, 3.8 wt % LiCl, and 85.9 wt % dimethylacet- amide ( DMAc ) . LiCl was used to enhance the dis- solution of polymer in the solvent. Casting thickness was 2 mils (50.4 pm)
.
The evaporation of the solvent was carried out at 95°C in an air atmosphere. The evaporation time was changed from 5 min to 240 min. After gelation, membranes were kept in pure water for several days to leach out LiC1. It was con- firmed from atomic analysis that LiCl in the mem-brane was perfectly taken away into water in several days. The membranes were homogeneous and no visible pores were observed under SEM. The thick- ness of dry membranes was measured through the
SEM image, and it was in the range of 5
zyxwvutsrqponmlkjihgfedcbaZYXWVUTSRQPONMLKJIHGFEDCBA
k 0.5 pm for all membranes studied.Pervaporation
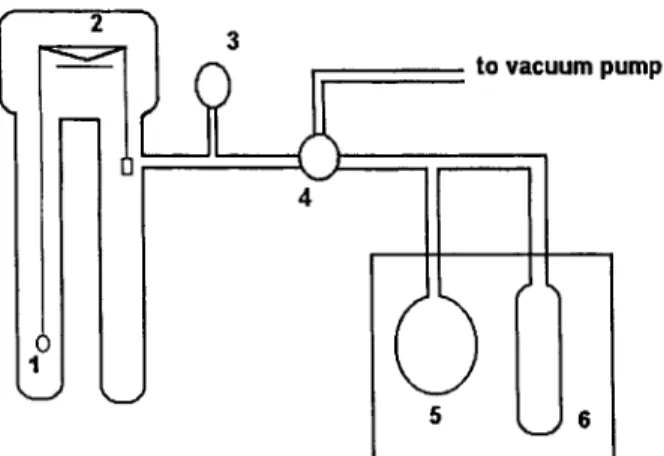
A schematic diagram for the pervaporation experi- ment apparatus is shown in Figure 1. The membrane (effective permeation area is 9.4
x
1 0 - ~ m2) was placed in the stainless steel cell of which the tem- perature was kept 25°C by a constant temperature bath. The vacuum of the downstream side was con- trolled by a needle valve. The permeate was collected in a trap cooled by liquid nitrogen. The permeation rate was calculated by the weight measurement. Each run was carried out for a t least 4 h after the attainment of the steady-state permeation.liquid Sorption
The water-wet membrane was dried in a vacuum oven for 24 h at 60°C before weighing. Then, the membrane was placed in a vacuum oven again, dried for another 24 h, and weighed. There was no change between these two weight measurements. For the liquid sorption experiments, the membrane was im- mersed in pure water, the temperature of which was maintained at 25°C in a constant temperature bath. After 24 and 48 h of immersion, the membrane was taken out of water, blotted quickly, and weighed. There was no weight change between 24 and 48 h. It was, therefore, confirmed that sorption equilib- rium had been established within 24 h.
Pressure Gauge
Pressure Controlling Valve
zyxwvutsrqponmlkjihgfedcbaZYXWVUTSRQPONMLKJIHGFEDCBA
To Vacuum Pump
Cold Trap Constant Temperature Bath
Figure 1
perimental apparatus.
EFFECT OF EVAPORATION T I M E
zyxwvutsrqponmlkjihgfedcbaZYXWVUTSRQPONMLKJIHGFEDCBA
I
IzyxwvutsrqponmlkjihgfedcbaZYXWVUTSRQPONMLKJIHGFEDCBA
zyxwvutsrqponmlkjihgfedcbaZYXWVUTSRQPONMLKJIHGFEDCBA
U61
IFigure 2
measurement apparatus.
Schematic diagram for the vapor sorption
Vapor Sorption
Vapor sorption equilibrium was established by using an apparatus that included Cahn micro balance (Fig. 2 )
.
A membrane of known dry weight (typically 100mg) was loaded. After evacuation of the chamber, water vapor was introduced to the latter chamber from the vapor feeding unit that consisted of a liquid chamber and a vapor chamber. The attainment of sorption equilibrium was confirmed by monitoring the weight change of the membrane. In all cases, no further weight changes were observed after 2 h. The temperature of the system was kept a t 25°C by a water circulated jacket.
RESULTS AND DISCUSSION
Pervaporation
In Figure 3, water flux was plotted against the downstream pressure for membranes prepared with a different evaporation time. Although the flux de- creased with an increase in the evaporation time, the shape of each curve was exactly the same; i.e., it consists of a parabolic part a t the downstream pressure below 3 kPa and a linear part at the down-
stream pressure above 3 kPa. It should be noted that
zyxwvutsrqponmlkjihgfedcbaZYXWVUTSRQPONMLKJIHGFEDCBA
the vapor pressure of water at 25°C is approximately
3 kPa.
It is known that the above functional form can be represented by the equations,12
0.11 *
,
.
,
-
,
* EzyxwvutsrqponmlkjihgfedcbaZYXWVUTSRQPONMLKJIHGFEDCBA
0 v)zyxwvutsrqponmlkjihgfedcbaZYXWVUTSRQPONMLKJIHGFEDCBA
1 0zyxwvutsrqponmlkjihgfedcbaZYXWVUTSRQPONMLKJIHGFEDCBA
0 15min A 30min 6Omin A 120min 0 00t
0 X 3ii
4
1475 0 Downstream Pressure [Pa]Figure 3 Effect of evaporation time on water flux.
where
zyxwvutsrqponmlkjihgfedcbaZYXWVUTSRQPONMLKJIHGFEDCBA
J , p 2 , p * , and p 3 are the water flux [mol/m2/s], upstream pressure [Pa], saturation vapor pres- sure of water [Pa], and downstream pressure [Pa], respectively. A/1 and B/1 are the parameters con- cerning liquid transport [mol/m2/s/Pa] and vapor transport [mol/m2/s/Pa2], respectively. The nu- merical values of A/1 and BIZ were, therefore, ob- tained by the fitting of experimental data, and the results are summarized in Table I. Both parameters decreased rapidly until the evaporation time reached 30 min. Above 30 min, the change was more mod- erate.
The above fitting enables the normalization of the permeation flux. Each curve was extrapolated to p 3 = 0, and J corresponding to p 3 = 0 was set equal to Jo. According to Eq. (I),
J o = ( A / 0 ( ~ 2 - P*)
+
(B/OP*~ (3) Then, the normalized flux, J / J o , in the range of p 3 < p* was plotted vs. relative pressure x3Table I Pervaporation Transport Parameters
Evaporation All B/1
Time (min) (mol/s/m2/Pa) ( mol/s/m2/Pa2) 5 17.6 x 10⁻⁹ 57.8 x 10⁻¹⁰ 15 8.04 30.6 30 4.91 9.28 60 3.32 4.63 120 2.30 3.79 240 1.07 2.78
1476
zyxwvutsrqponmlkjihgfedcbaZYXWVUTSRQPONMLKJIHGFEDCBA
YAMASAKI ET AL.zyxwvutsrqponmlkjihgfedcbaZYXWVUTSRQPONMLKJIHGFEDCBA
Evaporation
Time
zyxwvutsrqponmlkjihgfedcbaZYXWVUTSRQPONMLKJIHGFEDCBA
rninzyxwvutsrqponmlkjihgfedcbaZYXWVUTSRQPONMLKJIHGFEDCBA
0
A 120 240
o h 1
I I 0.5 I ' I I I 1 'Relative Pressure of Downstream Side xg
zyxwvutsrqponmlkjihgfedcbaZYXWVUTSRQPONMLKJIHGFEDCBA
[-I
Figure 4 Normalized water flux vs. relative pressure.
(= p&*)
zyxwvutsrqponmlkjihgfedcbaZYXWVUTSRQPONMLKJIHGFEDCBA
of the downstream side in Figure 4. Figure4 shows that the normalized flux below the satura- tion pressure (xg < 1) can be represented by a single correlation line, regardless of the evaporation time.
Sorption Experiments
Figure 5 shows the vapor sorption isotherms for the membranes with 5, 30, and 240 min evaporation times. The amount of water vapor adsorbed a t a given relative vapor pressure ( p / p * ) increased with
a n increase in the evaporation time.
In Figure 6, data from Figure
zyxwvutsrqponmlkjihgfedcbaZYXWVUTSRQPONMLKJIHGFEDCBA
5 were replottedaccording to the B E T e q ~ a t i o n , ' ~
where p , p*, q,
zyxwvutsrqponmlkjihgfedcbaZYXWVUTSRQPONMLKJIHGFEDCBA
and qm are vapor pressure of water[Pa], saturation vapor pressure of water [Pa], amount of water adsorbed to unit weight of the membrane sample [ mol/kg], and monolayer capacity [mol/kg], respectively. The quantity c can be ex- pressed as,13
c = exp { ( E l - EL)/RT) ( 5 ) where El is the heat of sorption of the first adsorp-
tion layer [Jlmol], and EL is the heat of evaporation
of water [Jlmol], R is the gas constant [J/mol/Kj,
and T is the absolute temperature [K]. T h e straight line relationship obtained in Figure 6 indicates that Eq. (4) is valid in a range of the relative pressure,
p / p * , lower than 0.35. The parameters qm and c were
Relative Pressure
[-I
Figure 5 Water vapor sorption isotherm.
obtained from the intercept and the slope of the B E T plot.
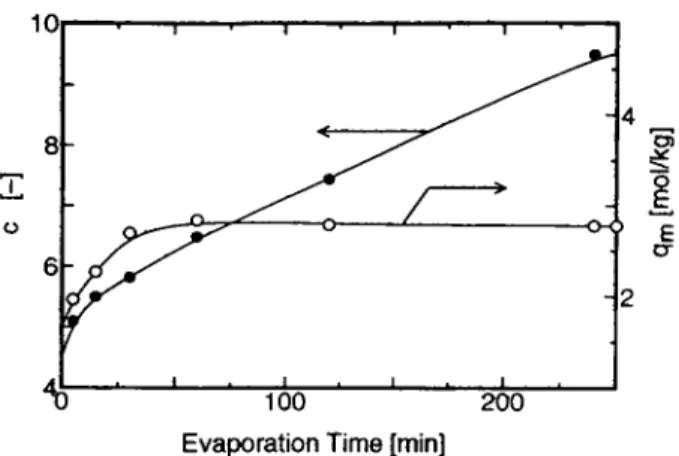
The parameters qm and c obtained were plotted
vs. evaporation time in Figure 7. Note that Figure 7 includes data for evaporation times other than 5, 30, and 240 min. Whereas qm increased until evap- oration time reached 30 min and leveled off there-
Relative Pressure [-]
EFFECT OF EVAPORATION
zyxwvutsrqponmlkjihgfedcbaZYXWVUTSRQPONMLKJIHGFEDCBA
TIMEzyxwvutsrqponmlkjihgfedcbaZYXWVUTSRQPONMLKJIHGFEDCBA
1477zyxwvutsrqponmlkjihgfedcbaZYXWVUTSRQPONMLKJIHGFEDCBA
I-
4 . 1 ' g ' 1 . 1 "
100zyxwvutsrqponmlkjihgfedcbaZYXWVUTSRQPONMLKJIHGFEDCBA
200Evaporation Time [rnin] Figure 7
rameters.
Effect of evaporation time on the BET pa-
after, c
zyxwvutsrqponmlkjihgfedcbaZYXWVUTSRQPONMLKJIHGFEDCBA
kept increasing with a n increase in evapo-ration time. The constant monolayer capacity, 9,,,, after 30 min evaporation time means that the area utilized for the adsorption of water vapor was also constant for the evaporation time greater than 30 min.
Equation
zyxwvutsrqponmlkjihgfedcbaZYXWVUTSRQPONMLKJIHGFEDCBA
(4) was further rearranged to,and q
zyxwvutsrqponmlkjihgfedcbaZYXWVUTSRQPONMLKJIHGFEDCBA
was calculated a s a function of ( p / p * ) usingthe parameters 9m and c obtained above. T h e results are given in Figure 5 for evaporation times 5, 30, and 2 4 0 min as solid lines. Note that 9,,, and c were obtained from the B E T plot corresponding t o p / p * < 0.35. T h e calculated isotherms showed positive deviations a t p / p * values higher than 0.35, because a n infinite number of adsorption layers was allowed in the derivation of Eq. ( 4 ) . In reality, only a limited space should be available for adsorption in the poly- mer, which restricts the number of adsorption layers. T h e upward deviation became greater a s the evap- oration time increased, which means that the volume of the space available for the multilayer adsorption became less as the evaporation time increased.
T h e continuous decrease in the adsorption vol- ume is supported by Figure 8, where the effect of the evaporation time on the liquid water sorption is illustrated. The amount of liquid water sorption kept decreasing even when the evaporation time was more than 30 min, although the decrease became more moderate after 60 min. This is in contrast to the conclusion from Figure 7 that the specific surface area for vapor adsorption increased with an increase in the evaporation time up to 30 min and did not
change after 30 min of evaporation time. These ,re-
sults can be explained based on the morphology change of the membrane represented by the change in the number a n d the size (radius) of cylindrical channels in homogeneous membranes. O b v i ~ d y , the mass transport takes place through s0zct.1 chan- nels in pervaporation, whatever t h e origin of them are. T h e specific surface area for vapor sorption (calculated from monolayer capacity, 9,J can be re-
lated to the surface area of the channels, and the liquid sorption amount can be related t o the volume of the channels. Set symbols n [l/kg], rlm], and L[m] for the number in a unit weight membrane, radius, and the length of the cylindrical channel, respectively. Let us also use S[m2/kg] and V[m3/
kg] for the specific area and the specific volume of the membrane, respectively. Let subscript 30 and t (> 0) denote 30 min and evaporation time, respec-
tively. Then, the specific surface area at evaporaation time 30 min and t min can be expressed as,
T h e specific volume can be expressed as,
T h e length of the channel, L can be assumed to be constant, regardless of the evaporation time, because the membrane thickness was in the range of 6 k 0.9
pm. When t < 30, from the results in Figures 7 and 8,
2
t .
,
.
,
, I' 0 0
100 200E
Evaporation Time [rnin]
a
Figure 8
sorption.
1478
zyxwvutsrqponmlkjihgfedcbaZYXWVUTSRQPONMLKJIHGFEDCBA
YAMASAKIzyxwvutsrqponmlkjihgfedcbaZYXWVUTSRQPONMLKJIHGFEDCBA
ET AL.(A) Large Channel (d>>D)
(B)
Small Channels (d"
D)
Interaction only from
the wall below the molecule Overlap of potential fields from both sides of the polymer wall Figure 9
channel wall.
Effect of channel size on the interaction of adsorbed water molecules and the Substitution of Eqs. (7) and (8) into Eq. (11)
yields,
Substitution of Eqs. (9) and (10) into (12) yields,
Division of Eq. (14) by Eq. (13) yields,
r30
zyxwvutsrqponmlkjihgfedcbaZYXWVUTSRQPONMLKJIHGFEDCBA
< rtzyxwvutsrqponmlkjihgfedcbaZYXWVUTSRQPONMLKJIHGFEDCBA
(15)Also from Eqs. (13) and (15), we obtain,
Therefore, the increase in the surface area (monolayer capacity) and the decrease in the liquid sorption amount below 30 min can be explained in terms of the decrease in the size and the increase in the number of the channels.
When
zyxwvutsrqponmlkjihgfedcbaZYXWVUTSRQPONMLKJIHGFEDCBA
t > 30, the following can be drawn fromthe sorption experiments,
Division of Eq. (18) by Eq. (17) yields,
Then, using Eqs. (7), ( 8 ) ,
zyxwvutsrqponmlkjihgfedcbaZYXWVUTSRQPONMLKJIHGFEDCBA
(9), (lo), and (19), we ob-tain,
and from Eqs. (7), (8), (17), and (20),
The morphology change above 30 min should also be represented by a decrease in the average size of the cavity and an increase in the number of the channels. The decrease in the size of the channels can be also
supported by the results shown in Figure 7, where
zyxwvutsrqponmlkjihgfedcbaZYXWVUTSRQPONMLKJIHGFEDCBA
cincreases with an increase in the evaporation time. Ac- cording t~ Eq. (5), the increase in c indicates the increase in the heat of sorption of the first layer, E l . As shown in Figure 9 schematically, the molecules in the first adsorbed layer in a smaller channel feel the interaction forces not only from the lower parts of the channel wall but also from the upper parts. Thus, the interaction force should increase as the channel size decreases, re- sulting in an increase in the heat of adsorption.
Let us now discuss the mechanism of the mor- phology change of the membrane. Figure 10 shows the change of the weight of the cast film with solvent evaporation time. The figure indicates that solvent evaporation takes place rapidly up to 30 min of
EFFECT OF EVAPORATION TIME
zyxwvutsrqponmlkjihgfedcbaZYXWVUTSRQPONMLKJIHGFEDCBA
1479 3020
zyxwvutsrqponmlkjihgfedcbaZYXWVUTSRQPONMLKJIHGFEDCBA
10-
I
zyxwvutsrqponmlkjihgfedcbaZYXWVUTSRQPONMLKJIHGFEDCBA
I ' I I from the polymer-poor phase should be dominantbecause the solvent-polymer interaction is stronger than solvent-solvent interaction. Evaporation from the polymer-poor phase results in the formation of a small number of large cavities (or channels), which are surrounded by the droplets of polymer-rich phase [Fig. 11(B)]. With an increase in the evaporation time, the distance between the droplets become smaller and large cavities split into smaller cavities. This process results in the decrease in the channel
I . 1
zyxwvutsrqponmlkjihgfedcbaZYXWVUTSRQPONMLKJIHGFEDCBA
. 1 1 size and the increase in the number of channels.C
-
-
-
" A " v-
. .
Figure 10 Weight change of the casting solution.
evaporation time, and the evaporation becomes slow thereafter. These two distinct evaporation stage should corresponds to the different manners of the membrane morphology change.
In the process of membrane formation, we start from a mixture in which the mol fraction of polymer is so low that polymer and solvent are completely miscible. As the solvent evaporates, the polymer mol fraction increases and the composition of the binary system moves into the immiscible region and the phase separation starts to occur. Because we have started from a dilute polymer solution, it is likely that the polymer-rich phase is dispersed in a con- tinuous polymer-poor phase and, thus, forms drop- lets of the polymer-rich phase [Fig. 11(A)]. A t the earlier stage of solvent evaporation, fast evaporation
same time, the solvent evaporation takes place from the droplets, rendering its size smaller. However, the evaporation rate is much smaller because of the stronger interaction between the polymer and the solvent.
The droplets are considered to be a spherical net- work of polymer segments swollen by solvent and hereafter called polymer aggregates. As the solvent evaporation further proceeds, the solvent continues to leave the droplet of the polymer-rich phase re- ducing the droplet size, until the droplet become completely solvent free. As the aggregate size de- creases, the vacant void space can no longer be maintained, and restructuring of the aggregates should take place, which results in the disappearance of large void spaces and in the formation of many smaller internodular void spaces [Fig. ll(C)]. This process should correspond to the slower evaporation process below 30 min of evaporation time, which
Small Cavity
+
--
A) Phase Separation. B) Formation of C) Rearrangment of D) Shrinkage of Large Void Polymer Aggregates Polymer Aggregates
(t < 30 ) (t > 30)
D
1480 YAMASAKI ET AL.
zyxwvutsrqponmlkjihgfedcbaZYXWVUTSRQPONMLKJIHGFEDCBA
also resulted in the decrease in the channel size and the increase in the number of the channels. When the evaporation procedure is completed, the mem- brane structure, therefore, consists of closely packed polymer aggregates with internodular void spaces
[Fig. 11(D)].
zyxwvutsrqponmlkjihgfedcbaZYXWVUTSRQPONMLKJIHGFEDCBA
Correlation between Pervaporation Performance and Membrane Morphology
Equations (8) and (10) imply that the quantity
zyxwvutsrqponmlkjihgfedcbaZYXWVUTSRQPONMLKJIHGFEDCBA
V,/S, is a measure of the size of the channel where the transport takes place. An attempt was, therefore, made to calculate V,/S, from sorption data and to correlate the latter quantity to the transport param- eters obtained from pervaporation experiments. V ,
can be calculated from the liquid water sorption data, assuming that the density of water in the polymer is the same as that of water in the bulk phase. S ,
was calculated from the data on q,(t)
zyxwvutsrqponmlkjihgfedcbaZYXWVUTSRQPONMLKJIHGFEDCBA
that was ob-tained from the vapor sorption experiment as fol- lows. Setting the surface area occupied by a single
water molecule equal to a
zyxwvutsrqponmlkjihgfedcbaZYXWVUTSRQPONMLKJIHGFEDCBA
[m2/molecule], S,[m2/kg]becomes,
where N is Avogadro number [molecule/mol]. The
quantity a can be calculated by Eq. (23),13
a
zyxwvutsrqponmlkjihgfedcbaZYXWVUTSRQPONMLKJIHGFEDCBA
= 1.091x
(M/pN)2’3 (23)where M is molecular weight [ kg/mol],
zyxwvutsrqponmlkjihgfedcbaZYXWVUTSRQPONMLKJIHGFEDCBA
p [ kg/m3] isthe liquid density. For water molecule, a is equal to 10.5 X [m2/molecule].
V J S , so calculated was plotted vs. transport pa- rameters A/Z and B/I in Figure 12. Both transport parameters increase linearly with an increase in V,/ S,. The values for V,/S, in Figure 12 are equal to or
greater than 30 X 10-l’ m and seem to be too large for pervaporation membranes. It should be noted that an assumption was made in the above calcu- lation that the morphology of the polymer under the condition of the BET adsorption experiments, where p / p * < 0.35, and under the condition of liquid water sorption is exactly equal. Obviously, this assumption is too crude. The polymer swells more in liquid water and the value for V , was greatly overestimated as
compared with the volume available for vapor sorp- tion. Hence, V,/S, is also an overestimation of the radius of the channel.
==
rn
vt/stxi
0’0[m]
zyxwvutsrqponmlkjihgfedcbaZYXWVUTSRQPONMLKJIHGFEDCBA
Figure 12 Relationship between V/S and A/1, B/1.
CONCLUSIONS
From the results of sorption and pervaporation ex- periments described above, the following conclusions can be drawn.
(1) The morphology of the homogeneous poly- amide membrane, when characterized by the size and the number of cylindrical channels, changes as the solvent evaporation progresses in the following way. ( a ) The size of the channels decreases; ( b ) the number of the channels increases. ( 2 ) There is a correlation between the parameters associated with the pervaporation transport of pure water and the channel diameter.
The above conclusions are restricted to the dense symmetric aromatic polyamide membranes prepared by solvent evaporation.
REFERENCES
1. R. Y. M. Huang (Ed.), Pervaporation Membrane Sep-
aration Processes, Elsevier, Amsterdam, 1991.
2. K. Chan, T. Matsuura, and S. Sourirajan, Ind. Eng.
Chem. Prod. Res. Den, 2 1 , 6 0 5 (1982).
3. K. Chan, T. Liu, T. Matsuura, and S. Sourirajan, Ind.
Eng. Chem. Prod. Res. Den, 2 3 , 4 9 2 (1984).
4. T. Matsuura and S. Sourirajan, in Reverse Osmosis
and Ultrafiltration, ACS Symposium Series, No. 281,
American Chemical Society, Washington, DC, 1985, p. 1.
5. T. D. Nguyen, K. Chan, T. Matsuura, and S. Souri- rajan, Znd. Eng. Chem. Pros. Res. Dev., 24,655 (1985).
EFFECT OF EVAPORATION T I M E
zyxwvutsrqponmlkjihgfedcbaZYXWVUTSRQPONMLKJIHGFEDCBA
14816. T. D. Nguyen, T. Matsuura, and S. Sourirajan, Chem.
zyxwvutsrqponmlkjihgfedcbaZYXWVUTSRQPONMLKJIHGFEDCBA
7. T. D. Nguyen, T. Matsuura, and S. Sourirajan, Chem.8. T. D. Nguyen, T. Matsuura, and S. Sourirajan, Chem.
9. Z. Zhenxin and T. Matsuura, J. Colloid Interface Sci., 10. W. Gudernatsch, Th. Menzel, and H. Strathmann, J.
Eng. Commun., 5 4 , 1 7 (1987). Eng. Commun., 67, 351 (1987). Eng. Commun., 8 8 , 9 1 (1990). 1 4 7 , 3 0 7 (1991).
Membr. Sci., 6 1 , 1 9 (1991).
11. Blais, P. in Reverse Osmosis Synthetic Membranes, S .
Sourirajan, Ed, National Research Council of Canada, Ottawa, 1977, p. 167.
12. T. O k a d a a n d T . Matsuura, J. Membr. Sci., 59, 133 (1991).
13. S. J. Gregg and K. S. W. Sing, Adsorption, Surface
Area, and Porosity, Academic Press, London, 1967. Received December 16, 1994