Publisher’s version / Version de l'éditeur:
Vous avez des questions? Nous pouvons vous aider. Pour communiquer directement avec un auteur, consultez la
première page de la revue dans laquelle son article a été publié afin de trouver ses coordonnées. Si vous n’arrivez pas à les repérer, communiquez avec nous à [email protected].
Questions? Contact the NRC Publications Archive team at
[email protected]. If you wish to email the authors directly, please see the first page of the publication for their contact information.
https://publications-cnrc.canada.ca/fra/droits
L’accès à ce site Web et l’utilisation de son contenu sont assujettis aux conditions présentées dans le site LISEZ CES CONDITIONS ATTENTIVEMENT AVANT D’UTILISER CE SITE WEB.
Technical Memorandum (National Research Council of Canada. Division of
Building Research); no. DBR-TM-72-1, 1961-07-01
READ THESE TERMS AND CONDITIONS CAREFULLY BEFORE USING THIS WEBSITE. https://nrc-publications.canada.ca/eng/copyright
NRC Publications Archive Record / Notice des Archives des publications du CNRC :
https://nrc-publications.canada.ca/eng/view/object/?id=47f36678-ec22-4bbb-a771-07f129a8ef23
https://publications-cnrc.canada.ca/fra/voir/objet/?id=47f36678-ec22-4bbb-a771-07f129a8ef23
NRC Publications Archive
Archives des publications du CNRC
This publication could be one of several versions: author’s original, accepted manuscript or the publisher’s version. / La version de cette publication peut être l’une des suivantes : la version prépublication de l’auteur, la version acceptée du manuscrit ou la version de l’éditeur.
Access and use of this website and the material on it are subject to the Terms and Conditions set forth at
Some grading-density relationships for sands / Quelques relations
entre la granulométrie et la densité des sables
The Associate Committee on Soil and Snow
Mechanics is one of about thirty special committees which
assist the National Research Council in its work.
Formed
in 1945 to deal with an urgent wartime problem involving
soil and snow, the Committee is now perfonning its intended
ta sk of co-ordinating Canadian research studies concerned
with the physical and mechanical properties of the terrain
of the Dominion.
It
does this through subcommittees on
Snow and Ice, Soil Mechanics, Muskeg and Pennafrost.
The Committee, which consists of about twenty-five Canadians
appointed as individuals and not as representatives. each for
a 3-year term, has funds available to it for making research
grants for work in its fields of interest.
Inquiries
wi
11 be
welcomed and should be addressed to: The Secretary, Associate
Committee on Soil and Snow Mechanics, c/o Division of
Building Research, National Research Council, Ottawa, Ontario.
This publication is one of a series being produced by the
Associate Committee on Soil and Snow Mechanics of the National Research
Council.
It
may therefore be reproduced, without amendment, provided
that the Division
i
s t o ld in advance and that full and due acknowledgment
of this publication is always made.
No abridgment of this report may
be published without the written authority of the Secretary of the ACSSM.
NATIONAL RESEARCH COUNCIL
CANADA
ASSOCIA TE COMMITTEE ON SOIL AND SNOW MECHANICS
CANADIAN PAPERS PRESENTED AT THE FIFTH
INTERNA TIONAL CONFERENCE ON SOIL MECHANICS
AND FOUNDATION ENGINEERING,
PARIS,
JULY 1961
TECHNICAL MEMORANDUM NO.72
OTTAWA
JANUARY 1962
PREFACE
The Fifth International Conference on Soil Mechanics
and Foundation Engineering was held in Paris, France, from 17 to
22 July 1961.
The first such conference was held in 1936 as a part
of the tercentenary celebrations of Harvard University, Cambridge,
Mass.
The incidence of war necessitated the gap of twelve years
between the first two meetings.
The second conference was held in
Rotterdam in 1948, and the third was held in Zurich in 1953.
The
fourth was held in London in 1957.
Seven Canadians were present at the Harvard rn e e
ti.ng,
This number has increased over the years and over 25 were present
at the conference in Paris.
The Associate Committee on Soil and
Snow Mechanics of the National Research Council is pleased to publish
the reprints of the eleven Canadian papers which were included in the
official proceedings.
The International Society of Soil Mechanics and Foundation
Engineering is composed of national sections.
The executive body for
the Canadian Section is the Associate Committee on Soil and Snow
Mechanics of the National Research Council.
The principal function of
the Canadian Section is to assist in the further development and
appli-cation of soil mechanics throughout Canada.
Enquiries with regard to
its work will be welcome; they may be addressed to the Secretary,
Associate Committee on Soil and Snow Mechanics, National Research
Council, Ottawa 2, Canada.
Robert F. Legget,
Chairman.
Ottawa
1/27
Some Grading-Density Relationships for Sands
Quelques relations entre la granulometrie et la densite des sables
by Bruce
HUTCHINSON,RE., M.Sc., Research Assistant
and
David
TOWNSEND,M.Eng., D.LC., Assistant Professor Civil Engineering Department, Queen's University, Kingston,
Ontario
Summary
The effect of the grain size distribution of certain fine and medium sands on their maximum, standard compaction, and minimum densities is analysed. The regression equations relating the grading of the sand to these respective densities are given and discussed.
Although absolute limiting density tests have not been evolved, some important factors influencing these test techniques have been illustrated. Due to the arbitrary nature of the limiting density tests used in present investigations, any direct comparison between the physical properties of sands from various separate investiga-tions is erroneous when only relative density data are reported.
Introduction
A previous investigation by the authors (1960) has shown the usefulness of the Bagnold grading law (1943) in explaining certain characteristics of sands used for highway base course construction. This investigation also showed that the concept of relative density would be a better criterion for evaluating the densification and the construction performance of these sands than the more normally used standard compaction test (AASHO 1955).
Other investigations (GIBBS and HOLTz, 1957, KOLBUS-ZEWSKI, 1958) have shown the importance of expressing the in-situ condition of a sand in terms of its relative density in order to give a better indication of the results of standard penetration tests.
KOLBUSZEWSKI (1948) has shown that the sand grading has an important effect on the minimum density of a sand due to the internal structure which is developed during the test. Consequently, in order to apply the concepts of standard relative density measurements over a wide range of sand gradations, limiting density techniques need to be developed which will not introduce secondary effects such as an artificial sand structure in the test. Standardization upon one form of suitable test has not taken place and a wide variety of tests ha ve been proposed.
In spite of the present arbitrary nature of various limiting density techniques, SHOCKLEY and GARBER (1953), and DURANTE and others (1957) have shown that there is a direct correlation between their respective limiting density tests and the grading of sands of similar grain size distributions. A direct correlation also exists between the grading and the natural densities of these fluvially deposited sands.
It is the purpose of this investigation to determine the magnitude of the variation, as measured by several techniques, with the changes in grain size distribution upon the maximum and minimum densities of various Ontario sands.
Sommaire
Nous avons etudie l'effet de la distribution granulornetrique
des sables fins et moyens sur leur densite apres un compactage maximum, standard, au minimum. Nous avons etabli et analyse les correlations qui existent entre cette distribution
granulorne-trique et ces densites respectives.
Bien que la densite absolue limite nait pas etedeterrninee,nous avons mis en evidence I'importance de certains facteurs sur la determination de ces limites. Etant donne la nature arbitraire des essais relatifs
a
la densite limite, la comparaison entre des pro-prietes physiques des sables obtenues par differcntes methodes montre que les resultats obtenus dependent directement de la methode d'cssais, et conduita
des conclusions fausses lorsque les valeurs de la dcnsite relati ve seule sont repartees.Description of the Sands
Representative sand samples were taken from 98 locations throughout the southern section of the Province of Ontario. Generally these sands have been deposited by a variety of geological environments, which include beach, aeolian, glacio-fluvial, and deltaic conditions.
A detailed description of the general geological background of these deposits is given by CHAPMAN and PUTNAM (1951) and their mineralogical composition is outlined by DELL (1959). The sands tested fell between the grading limits shown in Fig. 1.
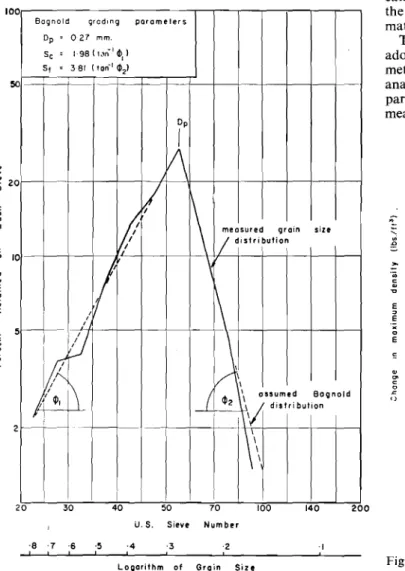
Laboratory sieve analyses showed that 90 per cent of these sands possess gradings which follow the grain size law devel-oped by BAGNOLD (1943) for aeolian sands. SHOCKLEY and GARBER (1953) have already shown that the grain size distri-bution of certain Iluvially deposited sands follow this law. The Bagnold distribution is shown in Fig. 2, where the loga-rithm of the percent retained on a given sieve is plotted against the logarithm of the mean particle size of the sieve interval. The distribution is defined by three parameters : the modal diameter,D) (in mm); the slope of the distribution curve for sizes coarser than the mode Sc; and the slope of the distribu-tion curve for sizes finer than the mode, Sf. Due to the arbi-trary nature of the slope parameters, all grain size distribu-tions have been plotted on standard two cycle log paper, as shown in Fig. 2. The Bagnold relationship was preferred over the more standard methods of expressing the grading by uniformity coefficients since it reasonably defines the complete grading of a sand as opposed to the identification of several isolated points.
The roundness of two samples from beach deposits and two samples from dune deposits was found to vary from 0'50 to 0'55, and this property was not investigated further for each of the sands tested.
10·0 5·0 2·0 ·5 ·6 ·7'8·91·0 0 I 9 , \ 2 '\. 1 . f -GPNセ Sf influence 7
,
Gセウ」 InfluenceII
6-,
I 4-,
I I U」⦅ゥセエャセセAQセ⦅・MエZ⦅_GNセ
セセセセ\ZLuZNヲセNセ
I 3,\,
I
I 2セ
I""",
j
Zイ|Gセ
-Infiuence
-1·2Ibs!cufl.. -\.1', I-1'\"
" 71\."
1\ "'
, : 110 loa 10 106 109 セ a E '" '" c セ"
12 E セMaximum Density Test
The following technique was selected for the determination of the maximum density of the sands; the sand sample was vibrated in three layers into a standard compaction mould (1/30 cu. ft.), with each layer being subjected to 15 minutes vibration by an electric vibratory hammer, vibrating at l,800 vibrations per minute, and a total weight on the hammer face of 50 Ibs, The soil was kept in the air dry condition, and the hammer face was modified so as to cover the complete cross-sectional area of the mould.
A similar method was developed by KOLBUSZEWSKI (1948) except that the hammer weight was not specified and the sample was compacted under water, as he had shown that densification of the sand was more effective when the sample was submerged in water than in the air-dry condition. Tests by the authors on eighteen sands possessing uniformity coefficients (Cll) from 1'4 to 5·0 indicated that the above observation is only true for uniformly graded sands (ell
1,4 to 2'3). For the well graded sands (Cll 2·5 to 5'0) when compacted under water, densities from 2 to 7Ibs.rcu.ft. lower were observed than when compacted in an air-dry condition. Moisture tests on several of the well graded sands at the completion of the submerged compaction tests revealed the average moisture content of the entire sample to be between 4 per cent and 6 per cent. It is suggested that an apparent cohesion was imparted by the moisture to the well graded sands and reduced the effectiveness of the vibrations in densifi-cation. It was also observed that for some very fine sands, the water became extremely murky indicating that fine materials were being washed from the samples during testing. The influence of the grading of the various sands on the adopted maximum density test was initially analysed by a method described by TOEBES (1955). This polydimensional analysis allows the pure influence of each of the grading parameters on the maximum density to be evaluated. The mean graphical results of this analysis are shown in Fig. 3
200
\ I
, II!
!IIii:
j I I , , ,, 140 100I
i j I !/1/
70I
I
/
SAND [mediurnlconr s sI
50/
l/./
/1
I
I
u.S. Sieve NumberII ,
40 SILTI
coarseI
fine 0·1 10 100 Groin Size (rn m) Limits of grading for the sands.Limites des analyses granulometriques des sables.
30
80f--+++++H+t- ++--1-+--1
+++f-f---l-,,0 f---l----l--H+rH++--+-+H-Hi+1--+-+-IH-I+J-.rl
Boqnold grading parameters Dp セ 027 rnm.
Sc 1·98 (",n-Idl,) Sf セ 381 ('on-Iill,)
Dp
セ
If
V
i\
measured grain sizeI
distribution LJI
セ
1\
I I-+-)1
セL
I II I , I1/
n
(
ill XI ossumedBognold , 2\\;1
distribution - ' - --\\
i
I..
'"
c:/
Ill!
I I
it
c:セN
lfL.'i..
I.:.!i
セ
60f----r-l-i-+++H--I-I--+-+-f-+H--!-+t---+II
rr:-;,
i
i!
I
. Iii
Zセ
I
j I I c:'"
o..
セ 20r----j-H-t-H--t-tf---t--t-+-H-t++t---+----I-++++H1 Fig. 1 100 2 c " '0 20 0·01 5 .c u e ....Fig. 2 Bagnold grain size distribution.
Distribution granulometrique de Bagnold.
Logarithm of Grain Size
-e · 7 · 6 ·5
, " -4 ·3 ·2 ·1
Slope of cccr s e fractions (Sc) or slope of fine fractions (Sf)
Fig. 3 Change in maximum density vs. slope of coarse fractions (fine fractions).
Variation de la densite en fonction de la pente donnee par les sables grossiers (sables fins).
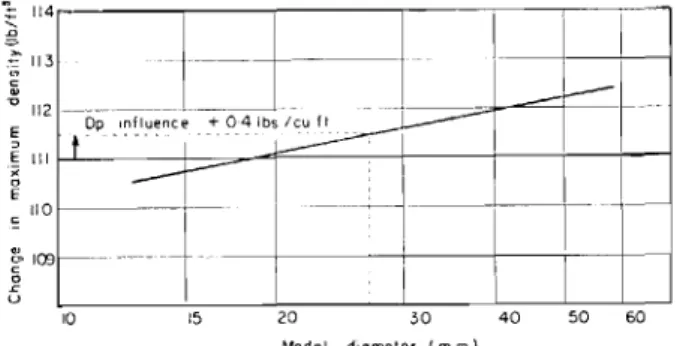
and Fig. 4, which also illustrate the manner in which these graphs may be used to estimate the maximum density of the sand shown in Fig. 2, Sc = 1'98, Sf = 3'81, Dp = 0'27 mm.
The respective influences of each of the parameters are applied to the mean value of maximum density of 111'0 Ibs./cu.ft. and an estimated density of 112'5 Ibs.jcu.ft. was obtained by algebraically adding the influences to this mean. The measured density was 113'9 lbs.zcu.ft,
The regression equations were developed from the results of a single density test on each sample. Limitations of sample quantities and laboratory testing time precluded more testing. It is suggested that the regression equations developed for the standard compaction test and maximum densities could be improved if the densities were determined from the mean of several tests on each sand.
'Ystd = 125-86 - 6'859 log (10Sc) - 8·6872 log (10Sf)
+
4'2061 log (10 Dp ) (2)Fig. 4 Change in maximum density vs. modal diameter. Variation de la densite maximum en fonction de la
gra-nulometrie la plus frequente.
The coefficient of multiple regression was
,2
0'79 which was the proportion of the variation in the maximum density explained by this equation relating the grading and the maximum density.Minimum Density Tests
The minimum density of each sand was estimated by two techniques. The initial method used was the tilting test dev-eloped by KOLBUSZEWSKI (1948) and the density used in the polydimensional and regression analyses was the mean of five determinations. The developed equation was:
Ymtn = 110'51 - 8·3215 log (10Sc) - 4.4736 log (10Sf)
+
4·2076 log (10 Dp ) (4)Ymin = 112·73 - 8·6214 log (10Sc) - 6'2562 log (10Sf)
+
1·7764 log (10 Dp ) (3)The regression coefficient obtained was 0'56 and in view of this low correlation, another test was used. In addition, it had been noticed that there was some segregation during the tilting test when well graded fine sands were tested.
The second test method relied on the careful deposition of the sand by spoon into a standard compaction mould (1/30 cu.ft.). The test is similar to that used by Wu (1957), and was partially chosen because of the different method of deposition as found in the tilting or funnel tests. The polydi-mensional analysis indicated similar mean relationships between grading and density as exists for Ymax and ystd. However, the regression equation also indicated erratic results, as shown by the correlation coefficient of 0'57 which was developed with the following equation:
Both analyses showed that the sands which possessed pre-dominantly coarse sizes, or were well graded materials in the fine sand and silt sizes (low values ofSf) did not follow the general relations exhibited by other sands. Since slightly over half of the variation in the minimum density test was explained by variations in the grading of the sands, it is felt that some other significant factors influence the minimum densities determined by either of these techniques.
For uniformly graded sands (Cu 1·4 to 2'3) the tilting test indicated minimum densities 2 to 3 lbs.rcu.ft. lower than those obtained from the spoon test, while for the more well graded sands(Cu2'5 to 5'0) the tilting test densities were 2 to 3 lbs.rcu.
ft. higher. These observations agree with the previous obser-vation by KOLBUSZEWSKI(1948) that a high rate of deposition of uniformly graded sands develops some form of open structure which reduces the density. The second test method apparently develops a denser structure for the uniformly graded sands because of the lower intensity of deposition. As the value of S, increases (i.e. more uniform coarse-size distribution) the density from the tilting test becomes incre-asingly lower than the spoon density result. This tends to support the idea that bridging is developed to a much greater extent in the finer and more uniformly graded sands. A similar difference appears to be developed between the two tests for uniformly graded coarse sands.
An indication of the importance of these secondary effects which are developed in the minimum density test is shown in Table I, where the properties of four typical sands are given. The standard tilting test was used for minimum density and maximum density was obtained using "dry" compaction.
50 60 10'7370(10 Sf) (1) Modal diameter (m m) 20 15 10 E EIII
f-l---+-=-¥=---+--+---+---t---l
;; セ 1 1 0 [-セ
109 --- -----+----+----+----i--+---I
l
I Ymax = 135'85 - 7'255 log (10Sc)+
6'4626 log (10D p)i
114,---..,---..,---,----,---,-,::::__l-i--
i_L
I
Dp⦅Qセセiセ・ョceG +0-4 IbsleuftThe polydimensional analysis also indicates that the pure influence of the modal diameter has little influence upon the maximum densities (Fig. 4) while a change in the distri-bution of the coarse or fine fractions will have a significant effect upon the maximum density. The analysis also indicated that a linear regression equation of the form below could bedeveloped to fit the experimental data, and such an analysis yielded the following equation :
Standard Compaction Tests
The standard compaction test (AASHO, 1955) involves the laboratory densification of a sand in three layers in a 1/30 cu. ft. mould. Each layer is subjected to 25 blows of a 5'5 lb. hammer falling 12 inches, and the diameter of the hammer face is 2 inches.
The polydimensional analysis indicated a similar pattern to that observed for the maximum densities, and the regres-sion equation developed to fit this data yielded :
with the coefficient of multiple regression of 0'79.
A comparison of the average densities from the maximum and the standard compaction tests shows the average diff-erence between the tests for uniformly graded sands(Cu 1'4 to 2'0) is 5 to 6 lbs.jcu.ft., while the average difference for well graded sands (Cu 3'5 to 5'0) is 8 to 9 lbs.jcu.ft. between the test results. Thus the well graded sands (with low values of Scand Sf) were more sensitive to changes in the magnitude of the compactive effort than the sands which had a tendency to be all of one size.
Table 1
I
I Ymax
I 1 RD
Sand C
u Dp Sc Sf I Ymin Ibs./ !y std. per
No. mm I , lbs.rcu.ft. cu.ft. cent I 1 - - - -- - -58-I 2·2 0·23 0'981 3·11i 101·2 116·4 109·3 57 59-63 2·6 0·21 0·85 1'921 97-3 117-6 109·7 66 58-12 3·6 0·21 1'85 1 0' 921 91-6 117·8 111·3 81 59-68 2·1 0'221 1' 971 2'36 1 94·6 114·0 107·0 68
The fine sand fraction of sand 58-1 is more uniformly graded than that of sample 59-63 as indicated by the steeper value of
St, while their other Bagnold parameters are セゥュゥャセイNN This variation produces a decrease of 3'9 lbs./cu.ft. In minimum density with little change in other densities. Samples 58-12
and 59-68possess similar Bagnold properties with the excep-tion that 58-12 is more well graded in the fine sand fraction than the other. This difference yields a 3 lbs.jcu.ft. lower minimum density for sand 58-12,but results in a 3 lbs.jcu.ft, increase in the other test densities for this sand.
A second analysis of the minimum density test results showed that for sands possessing neither a predominance of coarse fractions (S','> 1'4), nor well graded fine fractions
is,
>
1'4), a regression ・アオ。エゥセZュN 」ッセャ、 be developed whi.ch explained80per cent of the vanationInthe minimum density by changes in sand grading. Extrapolation of this relation to the excluded sands showed an underestimation of 6 lbs.jcu, ft. for the first grouping, and an overestimation of 5 lbs.zcu. ft. for the second grouping.It is suggested that in a majority of the fine and medium sands, the structure developed by the sand during deposition is of major importance. Unfortunately, there is insufficient evidence to quantitatively evaluate this structure in terms of absolute minimum density values.
Limitations on Relative Density Values
In order to compare a range of basic physical properties for a wide variety of sand types, the properties of sands are usually plotted against their relative densities, RD' As can be seen from Table 1 for the four sands which have been sub-jected to identical compacti ve processes and energies, different relative densities result. It can be assumed that the variation in relative density is an indication of the effect of the grading upon the energies involved in the laboratory procedures.
However, the differences in the "compactibility" of various sands, as reflected by changes in their relative densities, do not provide a correlation with their observed field behaviour, as is shown for the sands in Table 2.
Table 2
Sand i Dl' j max ...( min Rd Field
Cu Ibs./ Ibs./ orstd. per
No. I mm cu.ft. cu.ft. cent Remarks
,
-58-12 3-6 0·21 , 117·0 91·6 111·3 81 Stable
58-3 1-4 0·14' 109·5 87·6 102-3 72 IUnstable
59-86 3·3 0,26, 114·5 97·4 108·0 66 1Stable
58-8 2·1 0·32 116·4 96·0 111·0 73 [Unstable
The maximum and minimum densities shown in Table 2 are the standard tests proposed by KOLBUSZEWSKI (1948). The standard compaction density of each sand, which repre-sents the observed practical upper limit for field compaction, is expressed as a relative density. Three sands posses relative 4
densities approximately at 70per cent, yet each of these sands behaved differently on field construction projects. Sand 58-3 rutted excessively and became loose under the construction equipment, while sand 59-86 proved to be completely stable, and sand 58-8 exhibited characteristics mid-way between these two trends.
It is suggested that variations in grain size and grading of sands used in recent investigations have led to variations in the limiting densities which are not comparable, with the resulting relative density values yielding a poor basis for comparison.
It has been shown that in order to compare a variety of different sands on the basis of changes in their relative dens-ities with respect to comparable properties, it is most impor-tant that an appreciation of the range of gradings covered by the sands is obtained. At this stage, due to the arbitrary nature of the limiting density tests, it is suggested that changes in the physical properties of sands are expressed in terms of changes in their void ratios, without establishing their upper and lower limits. For sands of similar nature and grading, it is possible to use the limiting density techniques even though they do not represent ultimate techniques.
Conclusions
(I) The grain size distribution of90 per cent of the sands sampled from Southern Ontario can be expressed by Bagnold
Parameters.
(2) 80 per cent of the variation in standard compaction and maximum densities between these sands can be expressed by using the Bagnold grading parameters.
(3) The gradings of these sands explain in part the variation in the minimum densities for the techniques evaluated. Pre-sent techniques used for estimating minimum density are not satisfactory when a wide range of sands are to be compared. Due to a possible structure that is developed in the tests, the present techniques must not be considered as absolute tech-niques. The development of a minimum density test is needed which mainly reflects changes due to grading.
Acknowledgements
The analysis of these results was carried out with the assis-tance of the National Research Council of Canada. The samples were obtained in connection with another research project sponsored by the Ontario Joint Highway Research Programme of the Department of Highways.
References
[1] A.A.S.H.O. (1955). The Compaction and Density of Soils American Association of State Highway Officials Designa-tion, Tpp.99-49.
[2] BAGNOLD, R. A. (1943). The Physics of Blown Sand and Desert Dunes, Morrow and Co., N.Y.
[3] CHAPMAN, L. J. and PUTNAM, D.F. (1951).The Physiogra-phy of Southern Ontario, University of Toronto Press, Toronto, Ontario.
[4] DELL, CAROL, I. (1959). A Study of the Mineralogical Composition of Sand in Southern Ontario, Canadian Journal of Soil Science, vol.39,pp. 185-196,August1959. [5] DURANTE,
V.
A. and others(1957).The Field Investigations of Soil Densities and Moisture Contents Proc. 4th rc.O.S.M.F.E., vol. 1,p. 216, London, England, 1957.[6] GIBBS, H.J.and HOLTZ,W.G.(1957).Research on Determ-ining the Density of Sands by Spoon Penetration Testing, Proc.4th l.C.O.S.M.F.E.,vol. 1, p.35,London, England,
1957.
[7] KOLBUSZEWSKI, J. J. (1948).An Experimental Study of the Maximum and Minimum Porosities of Sands, Proc. 2nd l.C.O.S.M.F.E., vol. 1, p. 158, Rotterdam, 1948.
[8] - (1958). Fundamental Factors Affecting Experimental Procedures Dealing with Pressure Distributions in Sands,
Proc. Brussels Conf. on Earth Pressure Problems, Brussels, 1958.
[9] SHOCKLEY,W. G. and GARBER, P. K. (1953). Correlation of Some Physical Properties of Sands, Proc. 3rd I.C.O.S.M.F.E., vol. I, p. 21, Zurich, Switzerland, 1953. [l0] TOEBES, C. (1955). Streamflow-Polydimensional Treatment of Variable Factors Affecting the Velocity in Alluvial
Streams and Rivers, Proc. Inst. of Civil Engineers, vol. 4, No.3, Part 3, London, England, 1955.
[II] TOWNSEND, D. L. and HUTCHINSON, B. (1960). Field Cons-truction Performance of Some Southern Ontario Sands,
Report No.8, Ontario Joint Highway Research Pro-gramme, Queen's University, Kingston, 1960.
[12] Wu, T. H. (1957). Relative Density and Shear Strength of Sands A.S.C.E. Proc. Paper 1161, Journal of Soil
Mecha-nics and Foundations Division, January, 1957.