HAL Id: hal-01191255
https://hal.archives-ouvertes.fr/hal-01191255
Submitted on 29 May 2020
HAL is a multi-disciplinary open access
archive for the deposit and dissemination of
sci-entific research documents, whether they are
pub-lished or not. The documents may come from
teaching and research institutions in France or
abroad, or from public or private research centers.
L’archive ouverte pluridisciplinaire HAL, est
destinée au dépôt et à la diffusion de documents
scientifiques de niveau recherche, publiés ou non,
émanant des établissements d’enseignement et de
recherche français ou étrangers, des laboratoires
publics ou privés.
Farm-scale models built with farmers converting and
converted to organic farming
Lucie Gouttenoire, Sylvie Cournut, Stéphane Ingrand
To cite this version:
Lucie Gouttenoire, Sylvie Cournut, Stéphane Ingrand. Farm-scale models built with farmers
convert-ing and converted to organic farmconvert-ing. Agronomy for Sustainable Development, Sprconvert-inger Verlag/EDP
Sciences/INRA, 2013, 33 (3), pp.609-619. �10.1007/s13593-012-0125-6�. �hal-01191255�
RESEARCH ARTICLE
Farm-scale models built with farmers converting
and converted to organic farming
Lucie Gouttenoire&Sylvie Cournut&Stéphane Ingrand
Accepted: 22 November 2012 / Published online: 20 December 2012 # INRA and Springer-Verlag France 2012
Abstract Intensive livestock farming has recently induced several cases threatening food security. Therefore, redesign-ing sustainable livestock farmredesign-ing systems is a major chal-lenge for agricultural science. Specifically, farm-scale models that truly integrate different subsystems, viewpoints and time scales are needed. Up to now, however, no mod-elling approach has been able to meet these requirements. In previous work, we have designed a participatory modelling method based on causal mapping to help farmer groups redesign their livestock farming systems. Two causal maps have been built with two neighbouring groups of dairy farmers converting and converted to organic farming. It was the first time that consistent wholes had been made of elements cited by farmers faced with a redesign process. This article describes the content of the causal maps, with a focus on the current issue of integrating multiple subsys-tems, viewpoints and time scales within the same farm-scale model. We found that the maps included items at the whole farm scale and from a variety of disciplinary viewpoints and time scales. This finding indicates that these characteristics are useful in modelling approaches for redesigning farming systems. In addition, both maps closely linked herd
operations to the forage system in a cluster centered on the feeding–health–production complex. This result suggests that the feeding–health–production complex requires partic-ular attention for organic conversion of dairy farms. Lastly, novel relations were identified in the maps that linked work organisation and farm configuration to reproductive perfor-mance. This finding shows that analysing work organisation helps understanding how biotechnical performance evolves in a farming system.
Keywords Livestock farming systems . Modelling . Organic farming . Herd operations . Forage system . Cow health
1 Introduction
Livestock are important to the food security of millions of people and will continue to be so in the coming decades. It is estimated that 9.2 billion people may need to be fed by 2050, 1.3 times as many as in 2010; the increased population in developing countries is expected to consume almost twice as much animal protein as today (FAO2011). At the same time, there is increasing societal concern about‘sustainable devel-opment’ and a willingness to conserve already over-exploited natural resources. In this context, livestock farming systems and the way they are managed have been under close scrutiny. A livestock farming system (LFS) is a set of dynamically interacting entities managed by humans to transform resour-ces via domestic animals into various outputs (e.g. milk, meat, wool, work, organic matter) or to serve other goals (Landais1992). LFSs are particularly complex, as they are made of interacting living entities (plant and animal) whose production cycles do not necessarily have the same time scales (e.g. yearly crop production vs. multi-year cow life-span in a crop–livestock system). A high degree of manage-ment skill is therefore required (Russelle et al.2007).
L. Gouttenoire
:
S. Cournut:
S. Ingrand INRA, UMR1273 Métafort,63122 Saint-Genes Champanelle, France L. Gouttenoire (*)
:
S. Cournut:
S. Ingrand Clermont Université, VetAgro Sup, UMR Métafort, 63370 Lempdes, Francee-mail: lucie.gouttenoire@vetagro-sup.fr L. Gouttenoire
:
S. Cournut:
S. Ingrand AgroParisTech, UMR Métafort, 63170 Aubière, FranceL. Gouttenoire
:
S. Cournut:
S. Ingrand IRSTEA, UMR Métafort,63170 Aubière, France
Given this nature of LFSs, scientists have developed specific approaches to analyse them as complex objects (Gibon et al.1999; Dedieu et al. 2008). They often divide them into decisional and biotechnical subsystems (Gibon et al.1999), which requires not ignoring farmers, their objec-tives and their rearing practices. It is also important to consider three different poles in a LFS farmer, animals and resources (Landais1992). This system approach has proved useful in extension perspectives in developed countries, where LFS scientists and agricultural advisers have co-designed approaches, methods and tools to understand, an-alyse and better manage a wide diversity of LFSs (Dedieu et al.2008), and in developing countries, where similar theo-retical and methodological frameworks have been devel-oped and used (Lhoste1994).
Among the approaches, methods and tools used by LFS scientists, modelling has played a great part. A literature review of LFS models (either conceptual or in a simulation and/or optimisation platform) published since 2000 (n079) identified three main rationales in approaches to supporting changes in LFSs using models (Gouttenoire et al. 2011). The first type included models that dynamically simulate systems as a function of management options; farmers’ decision-making processes are assumed to consist of choos-ing values for management factors. The second type of model predicts the best combination of farm activities under given constraints, provided that farmers aim to maximise profit. The third type of model dynamically simulates farm-ing system management options, which are assumed to be planned according to farmers’ general objectives, which means that the decisional subsystem is represented in more detail than in the first type (Gouttenoire et al.2011).
For several decades, modelling it has helped agricultural scientists in general support stakeholders in the goal of achieving integrated, sustainable management of environ-mental resources (Malézieux et al.2001). Since then, agri-culture has been increasingly faced with change and uncertainty, due to, for example, revisions of the European Union’s Common Agriculture Policy, price volatility, cli-mate change and pressure from society for sustainable agri-cultural practices (Darnhofer et al. 2010). Designing innovative farming systems has been widely encouraged as a way to promote farming’s contribution to sustainable development. An international ‘Farming Systems Design’ (FSD) community has recently emerged (Donatelli et al.
2007; Hatfield and Hanson2009). Different ways of design-ing innovative farmdesign-ing systems have been identified, usdesign-ing research approaches such as modelling, experimentation and/or prototyping, sometimes in combination (Kropff et al. 2001; Sterk et al. 2007). Within the FSD community, some authors have also made a distinction between‘design’ and ‘redesign’: ‘redesign’ is seen as a way of innovating from existing farming systems to be analysed and improved,
whereas ‘design’ does not start from existing systems (Bellon et al.2007). Bellon et al. (2007) linked their inter-pretation of ‘redesign’ to the ‘R’ (‘Redesign’) in Hill and MacRae’s (1995) ESR model, which identifies three differ-ent approaches to achieve transitions from convdiffer-entional to sustainable agriculture: (1) improving input efficiency, (2) managing input substitution, and (3) carrying through sys-tem redesign (Hill and MacRae1995).
To address questions of design or redesign of agricultural farming systems, some authors have emphasised the need to build integrated models at the farm scale (Dedieu et al.
2008; Le Gal et al.2010). In our literature review introduced above (Gouttenoire et al.2011), we showed that none of the three modelling rationales that we identified was completely adapted to helping farmers redesign LFSs, not having been conceived for that purpose. In the first rationale, long-term simulations can be run at the farm scale and several disci-plinary viewpoints can be endorsed, but the models do not make it possible to question the very fabric of LFSs, and their outputs may not be relevant for the farmers, as the models are often designed without them. In the second rationale, based on optimisation, the models address neither how to implement the optimal solution nor its long-term consequences. In the third rationale, models are more com-prehensive than those in the first two, but they often repre-sent only farm subsystems (e.g. herd, forage system, manure management) and cannot simulate more than a few years in a realistic manner. Even when representing the whole farm, they often result from the aggregation of submodels con-ceived to address smaller-scale questions, which raises ques-tions about their relevance for redesigning the entire system. Lastly, these models focus on production, rarely on work organisation. No model of this type focuses on economics, animal health, the environment, or social sustainability, even though these can be real matters of concern for farmers (Gouttenoire et al. 2011). In sum, redesigning LFSs using models requires progress in integrating different time scales, subsystems and viewpoints in the same model.
In the accompanying paper (Gouttenoire et al.2012), we described a new modelling method involving farmer groups specifically aimed to help them redesign their LFSs. This method was applied and assessed with two neighbouring groups of dairy farmers made up of farmers both converting and converted to organic farming. Converting to organic farming was seen as one example of a redesign process. Two conceptual models of LFS operation were built with the farmers. To our knowledge, it was the first time that farmers had been able to combine the elements of the redesign process into consistent wholes (i.e., two models). Strengths and weaknesses of the method for supporting farmers’ redesign processes are discussed in the accompa-nying paper (Gouttenoire et al.2012). The objective of the present paper is to describe and analyse the content of the
models we obtained, with special emphasis on the current question of integrating multiple time scales, subsystems and viewpoints within the same farm-scale model. Are participatory-built models ‘more integrated’ than others? Which relations within a LFS seem most relevant to discuss when converting to organic farming?
2 Materials and methods
2.1 Two causal maps built with farmer groups
Two causal maps (Cossette and Audet 1992) were built, each with a group of five dairy farmers in the Pilat region (Regional Natural Park, Eastern Massif Central, France), both converting and converted to organic farming. Each map made a consistent whole of the elements cited by the participating farmers about their conversion to organic farm-ing. For each group, the causal mapping process started during a workshop (the second) with a list of five‘initiating items’ (Table1) that had been selected on the basis of work done during a first workshop. The method is described in more detail in the accompanying paper (Gouttenoire et al.
2012).
Farmers were asked to identify all items that influenced and were influenced by each item in Table1, which were noted on sheets of paper and connected with causal arrows (one sheet per item in Table1). The same exercise was then done with all new items that had appeared during the first step and so on, until the farmers were satisfied with the content of the partial maps that appeared on the sheets. Next, items that appeared several times on each group’s sheets were aggregated to form one master causal map per group. Group 1’s map comprised 178 items and 304 links; group 2’s map 128 items and 181 links.
2.2 Comparing the causal maps with other models of livestock farming systems
First, we characterised items in the causal maps according to criteria and classes that were relevant for comparing the maps with previously published LFS models. We then de-scribed the structure of the two causal maps by identifying groups of strongly interrelated items. Lastly, we analysed the ideas in these groups of items so as to describe how the
elements of a LFS classically described by modellers were integrated in the causal maps built with farmers.
2.2.1 Characterising item diversity in the maps
We (animal scientists specialised in LFS analysis) charac-terised items in both maps according to criteria and classes previously defined in our literature review of LFS models (Gouttenoire et al.2011). Two of us had already built LFS models (Ingrand et al.2003; Cournut and Dedieu2004), and all three had a thorough knowledge of LFS models, updated through conducting the literature review (Gouttenoire et al.
2011). Three criteria were considered to characterise the items: (1) the type of viewpoint on LFS operation the items entailed (criterion ‘viewpoints’) [Bonnemaire and Osty (2004) suggested for example four possible ‘viewpoints’ on a LFS, i.e. biotechnical, economic and technological, ecological and geographical, and finally societal; here we used six classes for criterion‘viewpoint’ (production, econ-omy, environment, social sustainability, animal health and work organisation) based on those developed in our litera-ture review]; (2) the different subsystems of the whole LFS represented by the different items (criterion‘subsystems’), for example the herd operation or the forage subsystem; and (3) the different time scale implied (criterion‘time scales’). Each of us separately assigned one or more viewpoints to each item in both maps. The synthesis of this triple-blind process was based on retaining the classification of item 1 in class m if and only if at least two persons out of three had placed it in that class. For the criteria‘subsystems’ and ‘time scales’, the maps were more qualitatively described. 2.2.2 Clustering the maps
To analyse and describe map structure, we used the cluster-detecting option of the Decision Explorer software (Eden
2004). In a causal map, a cluster is a group of strongly interrelated items (Table2). The idea behind cluster analysis is that the meaning of an item is related to the items that it is linked to, so that the groups of items identified roughly relate to the same area of discussion (Banxia Software
2010).
‘Matching scores’ (known as Jaccard Coefficients) for each item in relation to others in the surrounding map are used to identify clusters. The algorithm takes no account of
Table 1 Items used in each group to initiate the participatory modelling process
Item 1 Item 2 Item 3 Item 4 Item 5
Group 1 Healthy cows Long-term investing Farmer well-being Unpredictable harvesting conditions
Good public image Group 2 Low ecological
footprint
Early harvesting of grass
Economical milk production
High pasture herbage yield Well-managed breeding programme
the meaning of the items: It is based solely on the structure of the links between items; all links are considered to have equal weight (Banxia Software2010). A matching score can be calculated for every pair of items in a causal map; it is the ratio between the number of items directly linked to both items in the pair and the total number of items directly linked to either of the two items in the map. The clustering process begins by selecting one item, then another, and then calculating the matching score between them. If the match-ing score is greater than a preset threshold value, the items are placed in the same set; otherwise, the second item forms the seed for a new set. A different item is then selected and a matching score computed between it and the seed item of each existing set. The process continues until all items in the map have been analysed and had matching scores calculat-ed. This clustering process usually produces many small sets. The cluster command also aggregates small sets into larger ones by merging groups towards ‘head’ items (i.e. items with no out-pointing arrows) until the target set size is reached. The sets are then inspected again and ‘floating’ heads and‘tails’ (i.e. items with no in-pointing arrows), not yet included in any set, are merged into the nearest group (Banxia Software2010).
Certain assumptions have been made in the clustering algorithm by the software developers on the basis of expe-rience in using the tool, for example the inclusion of floating heads and tails, or the target cluster size (30 items) (Banxia Software 2010). The clustering method reveals clear-cut clusters when they exist; if they do not, clusters can be
‘forced’ by reducing the target size to a minimum value of five items. However, this process can still reveal relatively large clusters, which means that the model is heavily interlinked and cannot be broken down further (Banxia Software 2010). We used the default target size setting with our causal maps, which split each map into several clusters of similar size.
Isolating‘decision domains’ to be treated as independent-ly as possible is one way to overcome the limitations of human cognitive capacities to address complex issues (Sebillotte and Soler 1990). Clusters identified in a causal map can help identify possible sets of such decision domains.
Once clusters in both maps were identified, we de-fined each cluster’s most ‘structuring’ items, which met two conditions. The first was an ‘intra-cluster ratio’ (defined in Table 2)≥2/3, ruling out items mainly linked
to unspecific topics in their cluster. To have a denom-inator high enough for this ratio to remain significant, we considered only items that were directly connected to at least four other items (‘domain score’, Table 2). The second condition was item centrality (defined in Table 2) greater than or equal to the median centrality score for all items in the map; this simplifying condition thus identified only the most structuring items in each cluster [as a result of these rules, the most central items in the two maps (shown in Fig. 6 of the accompanying paper (Gouttenoire et al. 2012)) are not necessarily cluster-structuring items.]
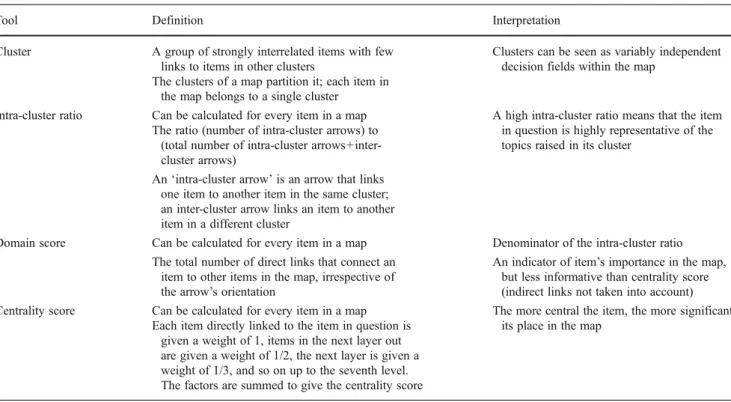
Table 2 Tools used to analyse the causal maps (Decision Explorer Software, Banxia Software Ltd.)
Tool Definition Interpretation
Cluster A group of strongly interrelated items with few links to items in other clusters
Clusters can be seen as variably independent decision fields within the map
The clusters of a map partition it; each item in the map belongs to a single cluster
Intra-cluster ratio Can be calculated for every item in a map A high intra-cluster ratio means that the item in question is highly representative of the topics raised in its cluster
The ratio (number of intra-cluster arrows) to (total number of intra-cluster arrows+inter-cluster arrows)
An‘intra-cluster arrow’ is an arrow that links one item to another item in the same cluster; an inter-cluster arrow links an item to another item in a different cluster
Domain score Can be calculated for every item in a map Denominator of the intra-cluster ratio The total number of direct links that connect an
item to other items in the map, irrespective of the arrow’s orientation
An indicator of item’s importance in the map, but less informative than centrality score (indirect links not taken into account) Centrality score Can be calculated for every item in a map The more central the item, the more significant
its place in the map Each item directly linked to the item in question is
given a weight of 1, items in the next layer out are given a weight of 1/2, the next layer is given a weight of 1/3, and so on up to the seventh level. The factors are summed to give the centrality score
2.2.3 Analysing cluster content
The clusters of both maps were qualitatively compared according to the viewpoints they endorsed and the subsys-tems they represented. We investigated whether similar clusters could be found on this basis between the two maps. We assumed that such similar clusters would convey rele-vant ideas for discussing a LFS conversion to organic farm-ing. The similar clusters we found were therefore described in more detail and analysed against the literature on LFS dealing with ideas similar to those contained in these clus-ters. We also looked for novel combinations of classes of ‘viewpoints’ and ‘subsystems’ criteria within the clusters. This analysis sought to identify and document novel links for LFS research.
3 Results and discussion
3.1 A wide diversity of viewpoints and time scales within farm-scale models
All classes of‘viewpoints’ based on LFS modelling litera-ture were represented in each causal map (Table3). Many items belonged to two to three classes (e.g. ‘good feed quality’ was associated with both production and animal
health viewpoints), suggesting that many items used by farmers were not completely covered by researcher-built categories.
We did not succeed in classifying six items within the ‘viewpoints’ criterion, each of us having a different opinion on the‘right’ class for them. These items were ‘stress’ (for the farmer),‘young farmer’, ‘pressure from neighbours’ (to invest in farm equipment),‘influence from small economi-cal production systems (like those in Switzerland)’, ‘self-orientated personality’ and ‘looking at the moon’ (to seed at the right time). Apart from ‘young farmer’, the ideas they carried had not been expressed in the modelling literature read for our review (Gouttenoire et al.2011). Considerations of farmer age were found in Cabrera et al. (2005), who describe a model that dynamically considers birth, age and death of household members and crop, livestock, and eco-nomic activities to assess household welfare in limited-resource farms in Peru. However, to our knowledge, no dynamic simulations of these particular aspects of farm social sustainability have been carried out in the context of developed countries.
Concerning time scales, items were connected to time in many ways. Some items concerned the daily routine; for example, ‘healthy cows’ and ‘low milk protein and fat contents’ can be assessed every day as a routine check, the results of which can influence farmers’ decisions and
Table 3 Number of items in each causal map according to ‘viewpoints’ classification
aReading key: in group 1’s map, seven items (out of 178) belong to both‘Production’ and ‘Ani-mal health’
‘Viewpoints’ criterion Number of items in
Map 1 (n0178) Map 2 (n0128) Production 56 54 Economy 13 6 Environment 4 4 Social sustainability 19 4 Animal health 11 7 Work organisation 19 5
Production and economy 10 12
Production and environment 3 6
Production and social sustainability 1 0
Production and animal health 7a 11
Production and work organisation 9 6
Economy and environment 2 1
Economy and animal health 1 1
Economy and work organisation 2 2
Environment and social sustainability 4 2 Social sustainability and work organisation 2 2 Production and economy and work organisation 0 1 Production and environment and social sustainability 1 0 Production and social sustainability and work organisation 0 1 Economy and environment and social sustainability 1 2 Economy and social sustainability and work organisation 0 1
actions over the following days or for longer periods. Other items could have major implications for the agricultural year (e.g. ‘unpredictable harvesting conditions’, ‘seeding at the right time’) or for several years, such as ‘well-managed breeding programme’, as herd dynamics are strongly influ-enced by reproductive performance. Some items referred to periods of up to several decades, such as‘long-term invest-ing’. Lastly, certain items referred to an indefinite future, such as‘difficulties to ensure farm succession’. Although it would be difficult to establish a small number of classes to describe how time is considered in causal maps (which generally do not focus on time aspects), these results show that maps contain complex interrelations between events, time scales and considerations about both the present and the future.
Last, map items represented several LFS subsystems of the whole LFS, such as management of the herd (e.g.‘good rumination’, ‘bad body condition score’) or forage resources (e.g.‘weeds’, ‘high pasture herbage yield’). The decisional subsystem was also represented, with elements linked not only to management of biotechnical resources but also to labour (e.g. ‘farmer with too little care for agronomy’, ‘willing to improve quality of life’, ‘collective organisation of harvesting tasks’), materials and buildings (e.g. ‘investing in farm equipment’, ‘owning a round baler or barn hay-drying system’), or financial resources (e.g. ‘need to gener-ate more income from farming’, ‘no financial breathing space’). Other items referred to farm structural and geo-graphical characteristics (e.g.‘altitude’, ‘hay-based farming system’). Lastly, relations between the farmer, the farm and society were represented on both maps, with items such as ‘good public image’, ‘opportunities to communicate with ramblers’, or ‘low ecological footprint’. In conclusion, the causal maps are conceptual farm-scale models that include elements from all subsystems classically represented in LFS models, with a specific focus on the links between the farm and its social environment.
Views of LFS operation in the causal maps were‘broad’ in the sense that they covered the whole-farm scale and contained elements from all viewpoints and time scales found in LFS modelling literature (Gouttenoire et al.2011). From a theoretical perspective, these results were not surprising. During the participatory modelling workshops, farmers were prompted to express items that would be helpful for action in their specific redesign situations. According to Alrøe and Kristensen (2002), representation, action and perception are closely interconnected in any cognitive system, whether that of farmers or researchers. Consequently, farmers’ representa-tions of livestock farming translated into items in the causal maps may have been strongly influenced by their everyday action on the farm in their redesign situations. As everyday action on a farm in a redesign situation is a complex problem, these representations were thus spontaneously‘multi-criteria’.
In contrast, researchers generally tend to address a single question per model they build, within a given disciplinary framework, although they sometimes add one or two other viewpoints to their models (Gouttenoire et al. 2011). As a result, their models are less comprehensive than our causal maps. From a practical perspective, these results reinforce the idea that designing or redesigning a LFS requires holistic views of the system, with close association of different view-points, time scales and subsystems. Our wish is not to promote cumbersome all-purpose models of livestock farming that attempt to maximise the number of details, subsystems, time scales and viewpoints. Following Guerrin (2007), we believe that model relevance with regard to the question at hand is more important than the accuracy or‘exhaustiveness’ offered by numerous submodels.
3.2 Causal maps described as collections of clusters
3.2.1 Overview of the clusters
Four clusters were identified in the map built with group 1 (Table 4), and five clusters in the map built with group 2 (Table 5). Given differences in mean centrality scores of maps of groups 1 and 2 (44 and 24, respectively), centrality scores cannot be meaningfully compared between maps.
Despite being built with different initiating items (Table1), the two maps had some similarities. In group 1’s
map, cluster 1 (which contains the most central structuring items of the map) deals with biotechnical issues such as cow health, milk production and the feeding system (Table 4). Similar elements can be found in cluster 2 of group 2’s map (Table5). As such elements are classically modelled by LFS scientists, we focused on these two clusters and compared their contents with previously published LFS models (Section3.2.2). Each map also contained a cluster (clusters 4 and 1 for maps of groups 1 and 2, respectively) dealing with relations between the LFS and its environment (e.g. ecological results or opinions of society).
Besides these ‘common clusters’, cluster 2 of group 1’s map is particularly interesting: Its items deal with long-term investing (especially in livestock buildings), reasons for investing and the main consequences of investing. However, this cluster also contains structuring items concerning cow fecundity and time spent observ-ing the cows, which may appear surprisobserv-ing (these links are explored in Section 3.2.3). Lastly, cluster 3 of group 1’s map mainly deals with farm geographical and struc-tural characteristics (farm size, altitude, etc.), farmer personality and their implications for the farming system and its products. Clusters 3–5 of group 2’s map are small and organised around one main topic each: man-aging pasture herbage yields, early harvesting of grass and the breeding programme, respectively.
3.2.2 Productive and health viewpoints associating herd and forage management
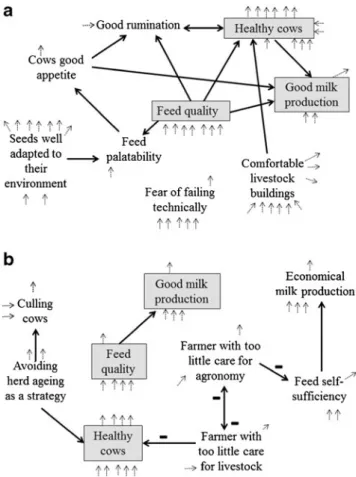
Clusters 1 and 2 in maps of groups 1and 2, respectively, have the following common traits (Tables4 and 5): (1) a strong productive viewpoint, (2) structuring items concerning herd and forage management and (3) the structuring items‘healthy cows’, ‘feed quality’ and ‘good milk production’. With high centrality scores in each map, the latter three items lay at the core of the farmers’ conceptions of a LFS. As they are strongly interrelated with direct links, these elements of herd and forage management appear in the same cluster (Fig.1).
About 70 % of LFS models reviewed (Gouttenoire et al.
2011) gave little consideration farmers’ decision-making
processes; they were assumed to consist of either choosing
values of predefined operating rules or maximising profit. The remaining 30 % of models (n012) considered farm management as being planned according to farmers’ objec-tives (Gouttenoire et al.2011); this more comprehensive and detailed way to represent decision making makes these models more similar to the causal maps than the others. Among these 12 models, forage and herd systems were usually represented in separate submodels (Gouttenoire et al.2011). It is therefore difficult to comprehensively model, for example, interactions between herd operations and the crop–forage system in integrated crop–livestock systems, although many farming systems worldwide revolve around such interactions (Thornton and Herrero 2001). In this study, herd and forage systems were integrated within the same cluster, which suggests that further participatory
Table 4 Structuring items of each cluster in Group 1’s map
See Table2for explanations of centrality score, domain score and intra-cluster ratio
Cluster Structuring item in the cluster Centrality score Domain score Intra-cluster ratio Number of items 1 Healthy cows 66 17 0.9 53
Comfortable livestock building 64 10 0.7
Feed quality 60 11 0.9
Good milk production 58 6 0.7
Good rumination 50 5 1
Seeds well adapted to their environment 48 10 0.8 Fear of failing technically 47 6 1
Cows good appetite 47 4 1
Feed palatability 47 4 1
2 Willing to improve quality of life 57 6 0.8 46 Investing in livestock building 56 9 0.8
Need to generate more income from farming 53 7 0.9
Long-term investing 53 9 0.7
Straw in sufficient quantity 53 4 0.8
Good fecundity 49 5 0.8
No financial breathing space 47 6 0.7 Time spent observing cows 47 4 1
3 Good mountain hay 54 5 0.8 35
Owning a round baler or barn hay-drying system 50 6 0.7
Being one’s own boss 50 4 0.8
Feed self-sufficiency 47 6 0.8
Unpredictable harvesting dates 46 6 0.7 Hay-based farming system 45 4 1
Altitude 45 6 1
4 Good public image 63 16 0.9 44
Weeds 54 10 0.8
Biodiversity 49 4 0.8
Opportunities to communicate with ramblers 48 7 1
Rumex 48 5 0.8
Bad image of pollution 47 6 1
modelling with farmers could help integrate these subsys-tems in comprehensive LFS models.
In addition,‘healthy cows’ was a central item in both maps, and structuring items of the two‘common biotechnical clus-ters’ were often associated with animal health, especially in group 1’s map. Health management is an important concern in organic dairy farming, as organic-production regulations limit use of allopathic treatments. This constraint may be associated with a greater concern for cow health, helping to explain the high centrality of health-related items. In such a setting, pro-ductive and health viewpoints are closely interconnected; however, only 2 of the 44 models in our literature review the main viewpoint of which was either productive or health viewpoint included both viewpoints. One of the models (Kudahl et al.2007) predicts effects of paratuberculosis and different control strategies on dairy production, while the other (Ostergaard et al.2000) represents precisely the ‘feed-ing–health–production complex’ that farmers in both groups alluded to via the items ‘feed quality’, ‘healthy cows’ and ‘good milk production’. Outside this modelling literature,
ecopathology has also developed approaches that jointly ana-lyse productive and health aspects to explain multi-factorial diseases in terms of risk factors (Ganière et al.1991).
These three items obtained high centrality in both maps whether or not they had been introduced into the modelling process as an initiating item (Table 1). ‘Healthy cows’ belonged to initiating items for group 1 but not for group 2, in which it was spontaneously introduced by farmers through the initiating item ‘economical milk production’, as farmers saw that healthy cows decreased veterinary costs. Given assumptions about the validity domain of farmers’ forms of knowledge (Darré et al.2004), thinking about the feeding–health–production complex should be especially relevant to all organic and converting-to-organic farmers in the Pilat region who belong to the same‘local professional group’ (Darré et al.2004). If similar results were found in other regions, the result could be generalised to a whole ‘technical community’ (Darré et al.2004). Our results sug-gest considering the feeding–health–production complex, as defined by Ostergaard et al. (2000), paying particular
Table 5 Structuring items of each cluster in group 2’s map
See Table2for explanations of centrality score, domain score and intra-cluster ratio
Cluster Structuring item of the cluster Centrality Domain Intra-cluster Number of items
1 Use of fossil energy 38 7 1 41
Low ecological footprint 38 10 1 Synthetic nitrogen fertilisers 37 6 0.8
Running engines 32 4 1
Work load 32 4 1
Barn hay drying system 31 4 0.8
Solar panels 29 5 1
High quantity of nitrogen in manure 26 4 0.8 Use of alternative medicine: homeopathy,
aromatherapy
26 4 1
2 Feed quality 34 6 0.7 36
Healthy cows 33 11 1
Good milk production 31 5 1
Feed self-sufficiency 31 5 0.8 Economical milk production 28 5 1 Farmer with too little care for livestock 27 5 1 Farmer with too little care for agronomy 27 5 1 Avoiding herd ageing as a strategy 26 4 1
Culling cows 24 4 0.8
3 High pasture herbage yield 39 15 0.9 26
Hay meadows 30 6 1
Spread yields 25 4 1
4 Early harvesting of grass 32 9 0.9 10
5 Well-managed breeding programme 30 9 0.7 15 Closely grouped calving dates 29 6 0.8
attention to when the processes for converting dairy farms to organic farming need to be performed.
3.2.3 Novel links between farm structural characteristics and management and cow fecundity
As a biotechnical item belonging to herd operations, it was surprising to find‘good fecundity’ in cluster 2 of group 1’s map, which concerns mainly the management of human, financial and material resources and farm structural charac-teristics (Table 4). Instead, ‘good fecundity’ might have been expected in cluster 1, the ‘core biotechnical cluster’. The causal map helps understand how fecundity is closely linked to questions about long-term investing and farm structural characteristics (Fig.2).
According to the farmers, good fecundity is directly linked to heat detection and taking good care of cows (Fig. 2). These skills can be improved by observing cows and having a good knowledge of them and their‘signs’ (e.g. behaviour, general appearance, hairs, faeces). However, time spent observing cows decreases when work load is high, as when farmers extend and modernise their farms. Young farmers tend to be involved in such activities (linked to long-term investing) more often than older ones. In addi-tion, they tend to have less experience and thus less knowl-edge of animals and their signs, which may increase the risk of poor reproductive performance of the herd.
Variability in farmers’ ability to detect heat has been recognised (Opsomer et al.2004), and its consequences on herd dynamics have recently been modelled (Brun-Lafleur et al.2010). However, until now, emphasis has been placed on factors that can decrease heat expression, such as phys-iological factors (Cutullic et al.2009), type of floor surface and foot problems (Opsomer et al. 2004), rather than on management factors that influence heat detection by
Fig. 1 Structuring items in cluster 1 in group 1’s map (a) and cluster no. 2 in group 2’s map (b) and their interrelations. Items in gray boxes are common to both clusters
Fig. 2 Cluster 2 of group 1’s map shows links from farm management and structural characteristics to‘good fecundity’
farmers. A farmer’s ability to detect heat has been analysed in terms of the number of observations per day, time of day, time spent per observation, knowledge of primary and sec-ondary signs of oestrus and use of visual aids (Opsomer et al. 2004). To our knowledge, few studies have analysed variability in heat detection due to interactions between cows, farmers and LFSs (Disenhaus et al.2010) (e.g. factors such as work organisation, farm size, farmer age and rearing skills) or how to use them to improve heat detection. In contrast, relations between LFS types, workforce and work organisation have been explored (Hostiou and Dedieu2009; Cournut and Hostiou2010), but such studies rarely include biotechnical performance such as milk production and do not include reproductive performance. Only one model (Martel et al.2008) in our literature review (Gouttenoire et al. 2011) contained variables concerning both production and work organisation, but direct connections between them were little explored. To improve reproductive performance in dairy herds, it would be useful to document features linking reproductive performance to work organisation and farm structural characteristics. More generally, analysing work organisation can help improve understanding of how biotechnical performance develops in a farming system.
4 Conclusion
The two causal maps of LFS operation built with farmers converting and converted to organic farming included items that covered the whole-farm scale and multiple viewpoints and time scales, which reinforced the idea that these character-istics are relevant to help redesign LFSs using models. In addition, each map integrated herd operations and the forage system in a cluster centred on the feeding–health–production complex, which suggests that this complex requires particular attention when dairy farms are being converted to organic farming. Lastly, novel relations were identified in the maps linking work organisation and farm configuration to repro-ductive performance, showing that analysing work organisa-tion can help improve understanding of how biotechnical performance develops in a farming system, which is rarely performed in studies.
These results are some examples of what can be obtained from participatory-built causal maps to document scientific questions. Here, we focused on integrating different subsys-tems, viewpoints and time scales within the same conceptual model, characterising items within the maps and building and analysing clusters. Other topics and methods could have been chosen. In particular, we could have identified different types of arrows within the maps (e.g. cause/effect, means/ end), which might have provided other results. We show in the accompanying paper (Gouttenoire et al.2012) that the modelling process was useful for the participating farmers to
help them redesign their LFSs, rather than the models them-selves. Here we showed that the models may be useful to document researchers’ questions. For example, we learned about the importance of the feeding–health–production complex to the conversion to organic farming. It thus may be less efficient for those who wish to support farmers in their conversion processes to treat these three domains sep-arately; however, the relevance of this complex to other types of redesign issues remains to be shown.
Finally, as in many other participatory modelling proj-ects, the work carried out with participants makes it possi-ble, via the modelling process, to help them with the situation at hand and, via the models obtained, to better understand the system under study. This approach remains quite new in LFS modelling and, given its promising results, should be developed further.
Acknowledgements This work was funded by the Science for Action and Development (SAD) department of the French National Institute for Agricultural Research (INRA) and by the Education and Research Di-rectorate (DGER) of the French Ministry of Agriculture and Fisheries.
References
Alrøe HF, Kristensen ES (2002) Towards a systemic research method-ology in agriculture: rethinking the role of values in science. Agric Hum Values 19:3–23
Banxia Software Ltd (2010) Cluster analysis—how it works. Decision Explorer Newsletter Compendium version 1.0.0, 3–4
Bellon S, Bockstaller C, Fauriel J, Geniaux G, Lamine C (2007) To design or to redesign: how can indicators contribute. In: Donatelli M, Hatfield J, Rizzoli A (eds) Farming Systems Design 2007: an inter-national symposium on methodologies on integrated analysis on farm production systems. La Goliardica Pavese, Pavia, pp 133–134 Bonnemaire J, Osty PL (2004) Approche systémique des systèmes
d’élevage: quelques avancées et enjeux de recherche. Cah Recherches l’Académie d’Agric France 90:1–29
Brun-Lafleur L, Rellier JP, Martin-Clouaire R, Faverdin P (2010) A simulation model of dairy cows' herd with focus on the informa-tion system (SITEL). In: EAAP (ed) 61. Annual EAAP Meeting, Wageningen Academic, Heraklion, Crete Island (GR), p. 245 Cabrera VE, Hildebrand PE, Jones JW (2005) Modelling the effect of
household composition on the welfare of limited-resource farmers in Coastal Canete. Peru Agric Syst 86:207–222. doi:10.1016/ j.agsy.2004.08.009
Cossette P, Audet M (1992) Mapping of an idiosyncratic schema. J Manag Stud 29:325–347. doi:10.1111/j.1467-6486.1992.tb00668.x
Cournut S, Dedieu B (2004) A discrete events simulation of flock dynamics: a management application to three lambings in two years. Anim Res 53:383–403. doi:10.1051/animres:2004025
Cournut S, Hostiou N (2010) Adaptations des systèmes bovin lait pour réduire la contrainte travail: une étude en Ségala (France). Cah Agric 19:248–353. doi:10.1684/agr.2010.0418
Cutullic E, Delaby L, Causeur D, Michel G, Disenhaus C (2009) Hierarchy of factors affecting behavioural signs used for oestrus detection of Holstein and Normande dairy cows in a seasonal calving system. Anim Reprod Sci 113:22–37. doi:10.1016/ j.anireprosci.2008.07.001
Darnhofer I, Bellon S, Dedieu B, Milestad R (2010) Adaptiveness to enhance the sustainability of farming systems. A Rev Agron Sustain Dev 30:545–555. doi:10.1051/agro/2009053
Darré JP, Mathieu A, Lasseur J (2004) Le sens des pratiques: concep-tions d'agriculteurs et modèles d'agronomes. Institut national de la recherche agronomique, Paris
Dedieu B, Faverdin P, Dourmad J-Y, Gibon A (2008) Livestock farm-ing system, a concept to conceptualise changes in livestock. INRA Prod Anim 21:15–58
Disenhaus C, Cutullic E, Freret S, Paccard P, Ponsart C, INRA, IE (2010) Vers une cohérence des pratiques de détection des chaleurs: intégrer la vache, l’éleveur et le système d’élevage. In: INRA IE (ed) Rencontres autour des Recherches sur les Ruminants, vol 17, 17th edn. Institut de l'Elevage, Paris, pp 113–120
Donatelli M., Hatfield J., Rizzoli A. (2007) Farming Systems Design 2007: an international symposium on methodologies on integrated analysis on farm production systems, 10–12 September 2007, Catania, La Goliardica Pavese, Pavia (IT)
Eden C (2004) Analyzing cognitive maps to help structure issues or problems. Eur J Oper Res 159:673–686. doi:10.1016/S0377-2217 (03)00431-4
FAO (2011) World Livestock 2011—livestock in food security. FAO, Rome Ganière JP, André-Fontaine G, Drouin P, Faye B, Madec F, Rosner G, Fourichon C, Wang B, Tillon JP (1991) Ecopathology: a method of evaluating the health of farmed animals. INRA Prod Anim 4:247–256 Gibon A, Sibbald AR, Flamant JC, Lhoste P, Revilla R, Rubino R, Sorensen JT (1999) Livestock farming systems research in Europe and its potential contribution for managing towards sus-tainability in livestock farming. Livest Prod Sci 61:121–137 Gouttenoire L, Cournut S, Ingrand S (2011) Modelling as a tool to
redesign livestock farming systems: a literature review. Animal 5:1957–1971. doi:10.1017/S175173111100111X
Gouttenoire L, Cournut S, Ingrand S (2012) Participatory modelling with farmer groups to help them redesign their livestock farming systems. Agron Sustain Dev. doi:10.1007/s13593-012-0112-y
Guerrin F (2007) Représentation des connaissances pour la décision et l'action. Université de la Réunion, La Réunion
Hatfield J.L., Hanson J.D. (2009) Farming Systems Design 2009: an international symposium on methodologies for integrated analysis of farm production systems, 23-26 August 2009, Monterey Hill SB, MacRae RJ (1995) Conceptual frameworks for the transition
from conventional to sustainable agriculture. J Sustain Agric 7:81–87. doi:10.1300/J064v07n01_07
Hostiou N, Dedieu B (2009) Diversity of forage system work and adoption of intensive techniques in dairy cattle farms of Amazonia. Agron Sustain Dev 29:535–544. doi:10.1051/agro/2009012
Ingrand S, Cournut S, Dedieu B, Antheaume F (2003) Modelling beef herd management decisions. INRA Prod Anim 16:263–270 Kropff MJ, Bouma J, Jones JW (2001) Systems approaches for the
design of sustainable agro-ecosystems. Agric Syst 70:369–393. doi:10.1016/S0308-521X(01)00052-X
Kudahl AB, Ostergaard S, Sorensen JT, Nielsen SS (2007) A stochastic model simulating paratuberculosis in a dairy herd. Prev Vet Med 78:97–117. doi:10.1016/j.prevetmed.2006.05.015
Landais E (1992) Principes de modélisation des systèmes d’élevage. Appro Graph Cah Rech-Dév 32:82–95
Le Gal PY, Merot A, Moulin CH, Navarrete M, Wery J (2010) A modelling framework to support farmers in designing agricultural production systems. Environ Model Softw 25:258–268. doi:10.1016/j.envsoft.2008.12.013
Lhoste P (1994) L’évolution des méthodes de recherche et de recherche-développement sur les systèmes d’élevage en régions chaudes. In: Sebillotte M (ed) Proceedings of the International Symposium‘Systems-Oriented Research in Agriculture and Rural Development. CIRAD, Montpellier, pp 173–177
Malézieux E, Trébuil G, Jaeger M (2001) Modélisation des agroécosystèmes et aide à la décision. Editions Quae, Montpellier
Martel G, Dedieu B, Dourmad JY (2008) Simulation of sow herd dynamics with emphasis on performance and distribution of pe-riodic task events. J Agric Sci 146:365–380. doi:10.1017/ S0021859608007879
Opsomer G, Coryn M, de Kruif A (2004) Postpartum anoestrus in high yielding dairy cows. Vlaams Dier ge nees kun dig Tijd schrift 73:112–118
Ostergaard S, Sorensen JT, Kristensen AR (2000) A stochastic model simulating the feeding–health–production complex in a dairy herd. J Dairy Sci 83:721–733
Russelle MP, Entz MH, Franzluebbers AJ (2007) Reconsidering inte-grated crop–livestock systems in North America. Agron J 99:325–334. doi:10.2134/agronj2006.0139
Sebillotte M, Soler LG (1990) Les processus de decision des agricul-teurs. In: Brossier J, Vissac B, Le Moigne JL (eds) Seminaire du Departement de Recherches sur les Systemes Agraires et le Developpement. INRA, Paris, pp 93–117
Sterk B, van Ittersum MK, Leeuwis C, Wijnands FG (2007) Prototyping and farm system modelling: partners on the road towards more sustainable farm systems? Eur J Agron 26:401– 409. doi:10.1016/j.eja.2006.12.006
Thornton PK, Herrero M (2001) Integrated crop–livestock simulation models for scenario analysis and impact assessment. Agric Syst 70:581–602. doi:10.1016/S0308-521X(01)00060-9