HAL Id: hal-01737991
https://hal.sorbonne-universite.fr/hal-01737991
Submitted on 20 Mar 2018
HAL is a multi-disciplinary open access
archive for the deposit and dissemination of
sci-entific research documents, whether they are
pub-lished or not. The documents may come from
teaching and research institutions in France or
abroad, or from public or private research centers.
L’archive ouverte pluridisciplinaire HAL, est
destinée au dépôt et à la diffusion de documents
scientifiques de niveau recherche, publiés ou non,
émanant des établissements d’enseignement et de
recherche français ou étrangers, des laboratoires
publics ou privés.
Distributed under a Creative Commons Attribution - NonCommercial - NoDerivatives| 4.0
International License
Genetic disruption of the oncogenic
HMGA2–PLAG1–IGF2 pathway causes fetal growth
restriction
Walid Habib, Frédéric Brioude, Thomas Edouard, James T. Bennett, Anne
Lienhardt-Roussie, Frédérique Tixier, Jennifer Salem, Tony Yuen, Salah Azzi,
Yves Le Bouc, et al.
To cite this version:
Walid Habib, Frédéric Brioude, Thomas Edouard, James T. Bennett, Anne Lienhardt-Roussie, et al..
Genetic disruption of the oncogenic HMGA2–PLAG1–IGF2 pathway causes fetal growth restriction.
Genetics in Medicine, Nature Publishing Group, 2018, 20 (2), pp.250-258. �10.1038/gim.2017.105�.
�hal-01737991�
Genetic disruption of the oncogenic
HMGA2–PLAG1–IGF2
pathway causes fetal growth restriction
Walid Abi Habib, PhD
1,2,10, Frédéric Brioude, MD, PhD
1,2, Thomas Edouard, MD, PhD
3,4,
James T. Bennett, MD, PhD
5, Anne Lienhardt-Roussie, MD, PhD
6, Frédérique Tixier, MD
7,
Jennifer Salem, MSc
8, Tony Yuen, PhD
9, Salah Azzi, PhD
1,2, Yves Le Bouc, MD, PhD
1,2,
Madeleine D. Harbison, MD
9and Irène Netchine, MD, PhD
1,2Purpose: Fetal growth is a complex process involving maternal, placental and fetal factors. The etiology of fetal growth retardation remains unknown in many cases. The aim of this study is to identify novel human mutations and genes related to Silver–Russell syndrome (SRS), a syndromic form of fetal growth retardation, usually caused by epigenetic downregulation of the potent fetal growth factor IGF2. Methods: Whole-exome sequencing was carried out on members of an SRS familial case. The candidate gene from the familial case and two other genes were screened by targeted high-throughput sequen-cing in a large cohort of suspected SRS patients. Functional experi-ments were then used to link these genes into a regulatory pathway. Results: We report the first mutations of the PLAG1 gene in humans, as well as new mutations in HMGA2 and IGF2 in six
sporadic and/or familial cases of SRS. We demonstrate that HMGA2 regulates IGF2 expression through PLAG1 and in a PLAG1-independent manner.
Conclusion: Genetic defects of the HMGA2–PLAG1–IGF2 pathway can lead to fetal and postnatal growth restriction, highlighting the role of this oncogenic pathway in the fine regulation of physiological fetal/postnatal growth. This work defines new genetic causes of SRS, important for genetic counseling.
Genet Med advance online publication 10 August 2017
Key Words: fetal growth restriction; HMGA2; IGF2; PLAG1; Silver–Russell syndrome
INTRODUCTION
Intrauterine growth retardation (IUGR) is a common condition arising from multiple origins (environmental, (epi)genetic, vascular, etc.).1 A well-characterized syndromic form of IUGR is represented by Silver–Russell syndrome (SRS, OMIM 180860). SRS is a clinically and genetically heterogeneous imprinting disorder characterized by fetal and postnatal growth retardation, relative macrocephaly at birth, a prominent forehead, and additional features.2The syndrome remains a clinical diagnosis, defined by clinical scoring systems.2–6 Insulin-like growth factor 2 (IGF2) is a growth factor strongly implicated in fetal growth and in the pathophysiology of SRS, as up to 50–60% of patients display hypomethylation of the imprinted 11p15.5 IGF2/H19 domain, which leads to the downregulation of IGF2 expression.2,7,8 The second most common cause of SRS is maternal uniparental disomy of chromosome 7, accounting for about 10% of cases.2Other rare 11p15.5-related genetic defects, such
as maternal duplications, maternal CDKN1C mutation,9 and
paternal IGF2 point mutation10have also been implicated in
SRS. In about 30–40% of patients with a clinical diagnosis of SRS, the molecular etiology of this syndrome remains unknown, involving molecular mechanisms and genes other than those cited above.6
Pleomorphic adenoma gene 1 (PLAG1), on human chromosome 8q12, was initially identified as an oncogene associated with certain types of cancer (e.g., pleomorphic adenomas, lipoblastoma, hepatoblastoma).11–13 The tumori-genic capacity of PLAG1 results from its ability to bind the P3 promoter of IGF2, thereby increasing IGF2 expression in tumor cells.13–16 In addition to functioning as an oncogene, PLAG1 has been implicated in growth, as Plag1 knockout mice and paternal Igf2-deficient mice have remarkably similar phenotypes, characterized by intrauterine and postnatal growth retardation.17
The DNA-binding protein high-mobility group AT-hook 2 (HMGA2), located on human chromosome 12q14, is a transcription factor that has been identified as an oncogene 1Sorbonne Universités, UPMC Univ Paris 06, UMR_S 938, CDR Saint-Antoine, Paris, France;2Service d’Explorations Fonctionnelles Endocriniennes, AP-HP, Hôpital Trousseau,
Paris, France;3Endocrine, Bone Diseases, and Genetics Unit, Children’s Hospital, University Hospital Center, Toulouse, France;4INSERM Unit 1043, Physiopathology Center of Toulouse Purpan (CTPT), Paul-Sabatier University, Toulouse, France;5Department of Pediatrics (Genetics), University of Washington, and Center for Integrative Brain Research,
Seattle Children’s Research Institute, Seattle, Washington, USA;6Département de Pédiatrie Médicale, Centre Hospitalo-Universitaire de Limoges, Limoges Cedex, France; 7Département d’Endocrinologie Pédiatrique, Hôpital Debrousse, Lyon, France;8
RSS/SGA Research & Education Fund, MAGIC Foundation, Oak Park, Illinois, USA;9Department of Pediatrics, Icahn School of Medicine at Mount Sinai, New York, New York, USA;10Current affiliation: Center for Epigenetics, Van Andel Research Institute, Grand Rapids,
Michigan, USA. Correspondence: Irène Netchine (irene.netchine@aphp.fr) The last three authors contributed equally to this work.
and shown to be an upstream regulator of PLAG1 expression in several tumor cells and experimental models.18 Hmga2-deficient mice have a pygmy phenotype and fetal growth retardation.19 A splicing mutation of HMGA2 was recently associated with SRS in a family but the contribution of this mutation to the phenotype was not clearly assessed.20
Rearrangements of 8q12 and 12q14 chromosomal regions corresponding to the locations of PLAG1 and HMGA2, respectively, have been reported in patients with SRS and SRS-like conditions.21 Finally, GWAS meta-analysis studies
on humans have shown HMGA2 and PLAG1 variants to be strongly correlated with childhood/adult height, highlighting the role of these genes in the control of human growth.22–25 Together, these observations strongly suggest that HMGA2 and PLAG1 play a role in growth physiology mediated by IGF2, but direct evidence has been lacking.
Here we report new mutations in the HMGA2–PLAG1– IGF2 pathway resulting in lower levels of IGF2 expression in SRS patients. These findings highlight the role of HMGA2 and PLAG1 as upstream regulators of IGF2.
MATERIALS AND METHODS
Population studied
The familial case and the 192 patients included in this study were referred for IUGR and suspected Silver–Russell syndrome. Blood samples were collected during clinical visits. Written informed consent for participation was received from all patients or parents, in accordance with national ethics rules (Assistance Publique–Hôpitaux de Paris author-ization no. 681 for French patients and IRB I00000204 at the Mount Sinai School of Medicine, New York, for patients recruited in the United States). Written consent was also obtained to publish patient photos. Patients were either followed at Armand Trousseau Children’s Hospital or referred by other clinical centers for molecular analysis of suspected SRS. A geneticist and/or a pediatric endocrinologist examined each patient and a detailed clinical form was completed. Patients who were negative for methylation defects within the imprinted domains controlling IGF2/H19, DLK1/GTL2, and MEST/ GRB10 assessed by allele-specific methylated multiplex real-time quantitative polymerase chain reaction, as previously described,2were retained for further molecular analysis.
Whole-exome sequencing and targeted HMGA2–PLAG1–IGF2 sequencing
Library preparation, exome capture/gene enrichment, sequen-cing, and data analysis were performed by IntegraGen SA (Evry, France). The sequencing methods and bioinformatics analysis are described in detail in the Supplementary Methods online.
Sanger sequencing and short tandem repeat typing
HMGA2, PLAG1, and IGF2 mutations identified with whole-exome sequencing and targeted sequencing were verified by standard methods of Sanger sequencing, using the ABI PRISM Big Dye Terminator v3.0 Cycle Sequencing Kit and
an ABI 3100 Genetic Analyzer (Life Technologies, Courta-boeuf, France). The sequencing products were then analyzed with SeqScape v2.6 (Life Technologies). For de novo muta-tions, parental inheritance was verified using short tandem repeat typing on chromosome 14 (D14S65 and D14S292).
Cell cultures and transfections
Fibroblasts, Hep3B, and HEK293 cells were cultured under standard conditions in supplemented RPMI 1640 and MEM, respectively (Gibco, Cergy Pontoise, France), at 37 °C. Gene silencing and overexpression assays were performed accord-ing to the manufacturer’s protocols (Thermo Fisher, France). Details of the culture conditions, gene silencing, and overexpression assays as well as RNA extraction are provided in the Supplementary Methods.
Reverse transcription and real-time messenger RNA quantification
We generated complementary DNA from the messenger RNA of fibroblasts, Hep3B, and HEK293 cells, with the SuperScript II reverse transcription system (#18064-014 Invitrogen Thermo Fisher, France). Real-time PCR was performed on the complementary DNAs obtained, in an ABI-7900HT machine, and gene expression was quantified with the Power SYBR Green PCR Master Mix (Life Technologies). Details from the reverse transcription and real-time quantification analysis are provided in the Supplementary Methods.
Statistical analysis
We compared data for pairs of groups in Mann–Whitney (expression in fibroblasts) and unpaired t (silencing and overexpressing assays) tests. We considered P values of less than 0.05 to indicate statistical significance. The analyses were performed with GraphPad Prism version 6.00 (GraphPad Software, La Jolla, CA).
RESULTS
HeterozygousPLAG1 frameshift mutation
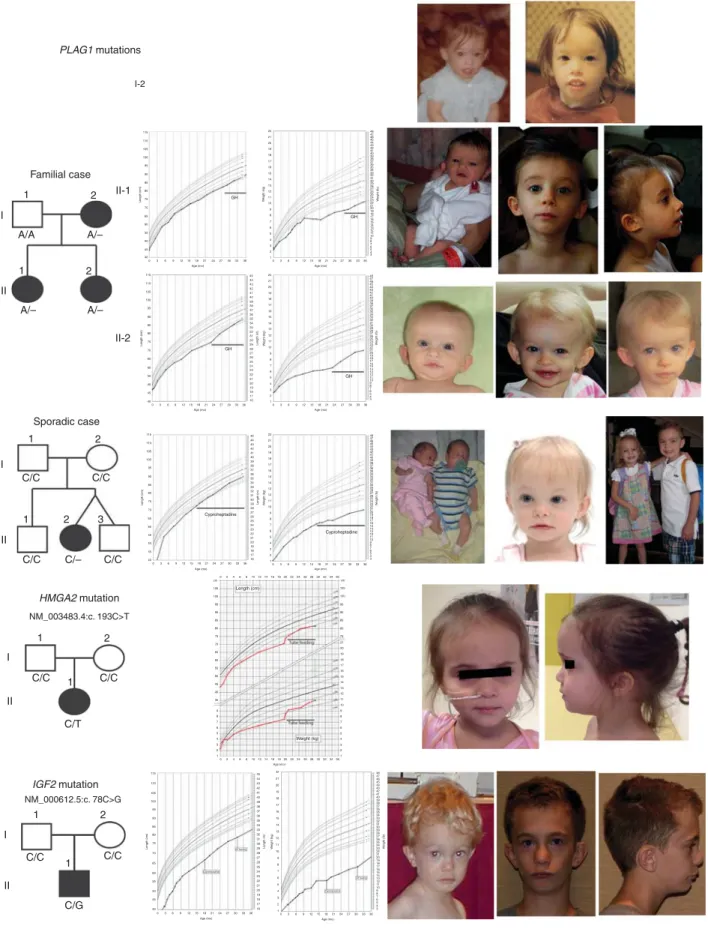
SRS was diagnosed clinically using the Netchine–Harbison clinical scoring system (NH–CSS)2,6in patient II-2 from the
affected family (Figure 1). Molecular analysis revealed a normal methylation on chromosomes 11, 7, and 14. Single-nucleotide polymorphism array excluded maternal unipar-ental disomies and chromosomal rearrangements. The proband’s sister and mother had similar phenotypes con-sistent with dominant transmission of the disease. Whole-exome sequencing revealed a heterozygous deletion of a single nucleotide within exon 5 of the PLAG1 gene (NM_002655.2: c.439del) in the proband, her mother, and her sister, but not in the father. This deletion leads to a frameshift and production of a truncated, 227–amino acid peptide (NP_002646.2:p.Ser147Valfs*82). This variant was not reported in any polymorphism or the ExAC database. The 18 other variants listed in Supplementary Table 1, which were found in the three affected family members, have no known effect on growth.
Familial case PLAG1 mutations Sporadic case 1 1 I II II II I I II-2 II-1 A/A A/– A/– A/– 2 1 1 2 3 C/C C/C C/– C/C HMGA2 mutation IGF2 mutation NM_003483.4:c. 193C>T NM_000612.5:c. 78C>G C/C C/C C/T C/C 2 1 1 II I C/C C/G C/C 1 2 1 2 2 115 22 48 47 46 45 44 43 42 41 40 39 38 37 36 35 34 33 32 31 30 29 28 27 26 25 24 23 22 GH GH GH GH 21 20 19 W eight (Ib) W eight (kg) 18 17 16 15 14 13 12 11 10 9 8 7 6 5 4 3 48 47 46 45 44 43 42 41 40 39 38 37 36 35 34 33 32 31 30 29 28 27 26 25 24 23 22 21 20 19 W eight (Ib) 18 17 16 15 14 13 12 11 10 9 8 7 6 5 4 3 45 44 43 42 41 40 39 38 37 36 35 34 33 32 31 30 29 28 27 26 25 24 23 22 21 20 19 Length (in) 18 17 16 21 20 19 18 97 95 90 75 50 25 10 5 3 97 95 90 75 50 25 10 5 3 97 95 90 75 50 25 10 5 3 97 95 90 75 50 25 10 5 3 97 95 90 75 50 25 10 5 3 97 95 90 75 50 25 10 5 3 75 50 25 10 5 3 97 95 90 75 50 25 10 53 17 16 15 14 13 12 11 10 9 8 7 6 5 4 3 2 1 22 W eight (kg) 21 20 19 18 17 16 15 14 13 12 11 10 9 8 7 6 5 4 3 2 1 03 6 9121518212427303336 110 105 100 95 90 85 80 75 Length (cm) 70 65 60 55 50 45 40 0 3 6 9121518
Age (mo) Age (mo)
03 6 912 1518212427303336 Age (mo) 21 2427 3033 36 115 110 105 100 95 90 85 80 75 Length (cm) 70 65 60 55 50 45 40 0 36 9121518 Age (mo) 212427303336 48 47 46 45 44 43 42 41 40 39 38 37 36 35 34 33 32 31 30 29 28 27 26 25 24 23 22 21 20 19 W eight (Ib) 18 17 16 15 14 13 12 11 10 9 8 7 6 5 4 3 45 44 43 42 41 40 39 38 37 36 35 34 33 32 31 30 29 28 27 Cyproheptadine Cyproheptadine Cyproheptadine Length (cm) Weight (kg) Cyproheptadine 26 25 24 23 22 21 20 19 Length (in) 18 17 16 22 W eight (kg) 21 20 19 18 17 16 15 14 13 12 11 10 9 8 7 6 5 4 3 2 1 03 69 121518212427303336 Age (mo) 115 110 105 100 95 90 85 80 75 Length (cm) 70 65 60 55 50 45 40 105 cm 024681012141618202224262830323436 024681012141618202224262830323436 cm 100 95 90 85 80 75 105 100 95 90 85 80 75 21 20 19 18 17 16 15 14 13 12 11 10 9 8 7 6 5 4 3 2 1 70 65 60 55 50 45 40 35 9 8 7 6 5 4 3 2 1 03 69121518 Age (mo) Age (mo) 212427303336 48 47 46 45 44 43 42 41 40 39 38 37 36 35 34 33 32 31 30 29 28 27 26 25 24 23 22 21 20 19 W eight (Ib) 18 17 16 15 14 13 12 11 10 9 8 7 6 5 4 3 45 44 43 42 41 40 39 38 37 36 35 34 33 32 31 30 29 GT feeding GT feeding 28 27 26 25 24 23 22 21 20 19 Length (in) 18 17 16 22 W eight (kg) 21 20 19 18 17 16 15 14 13 12 11 10 9 8 7 6 5 4 3 2 1 03 69121518212427303336 Age (mo) 115 110 105 100 95 90 85 80 75 Length (cm) 70 65 60 55 50 45 40 0 36 9121518 Age (mo) 212427303336 I-2
Figure 1 Pedigrees, growth charts, and photographs of patients carrying mutations affecting the HMGA2–PLAG1–IGF2 pathway. The patient with sporadic PLAG1 anomaly is next to her healthy twin brother. The patient with IGF2 anomaly shows that a prominent forehead evident in early childhood may become less obvious in later life. The patients’ growth charts between the ages of 2 and 20 years are included in the Supplementary Figure.
Description of the screened population
We have selected 192 patients for whom a diagnosis of SRS was suspected and for whom we could not identify any known epigenetic or genetic cause of SRS. All these patients were born small for gestational age (birth weight and/or birth length o–2 standard deviation score (SDS)) and without body asymmetry, which is in favor of a genetic rather than an epigenetic defect. Of these patients, 76 displayed head circumference sparing with relative macrocephaly at birth.
Identification of new genetic defects affecting theHMGA2–
PLAG1–IGF2 pathway
As PLAG1 plays a key role in the HMGA2–PLAG1–IGF2 pathway, we screened for mutations using high-throughput targeted sequencing for these three genes in the cohort of patients described above. We identified another hetero-zygous, de novo deletion of a single nucleotide in PLAG1 (NM_002655.2:c.1363del), leading to a frameshift and the production of a truncated, 469–amino acid protein (NP_002646.2:pGln455Serfs*16). This deletion was not found in the parents, the twin brother, or the older brother of the patient (Figure 1). Two new heterozygous variants were identified in the HMGA2 gene: a de novo nonsense mutation (NM_003483.4:c.193C> T) leading to premature termination (NP_003474.1:p.Gln65*), and a deletion of a single nucleotide (NM_003483.4:c.189del) leading to an elongated protein (NP_003474.1:p.Ala64Leufs*102) (Table 1). Due to lack of parental DNA, the origin of this deletion could not be investigated, but the father’s adult height of 155 cm strongly suggests that he passed this deletion to his son. Finally, we found two heterozygous variations within the IGF2 gene: a de novo nonsense mutation (NM_000612.5: c.78C> G) leading to the production of a truncated peptide (NP_000603.1:p.Tyr26*), and a de novo two-nucleotide duplication (NM_000612.5:c.158_159dup) leading to a frame-shift and the production of a truncated 59–amino acid protein (NP_000603.1:p.Arg54Alafs*7).
All five mutations were identified in the group of 76 patients with relative macrocephaly at birth.
Clinical data
The clinical presentation of the patients harboring the mutations is summarized in Table 1. We were unable to categorize patient I-2 due to a lack of information about some of her clinical signs. For the remaining patients, five out of seven fulfilled the SRS clinical diagnostic criteria of the NH–CSS (at least four of six criteria, including relative macrocephaly). Patient II-1 fulfilled only three of the six criteria from the NH-CSS and patient II-2 fulfilled four of six criteria without relative macrocephaly at birth. Birth weights and lengths were most strongly affected for patients with IGF2 and HMGA2 mutations (respectively), with a slightly smaller effect observed in patients with PLAG1 defects. Similarly, relative macrocephaly, defined as a difference in SDS of at least 1.5 between head circumference and length or weight at birth, was more pronounced in patients with the IGF2
mutations. As is characteristic of SRS, all patients presented with significant feeding difficulties and need for nutritional support with nonvolitional feeding and/or appetite stimula-tion. Serum IGF2 levels and other related markers from the patients with PLAG1, HMGA2, and IGF2 mutations are listed inTable 1.
Regulation of IGF2 levels by HMGA2 andHMAG2–PLAG1
pathway
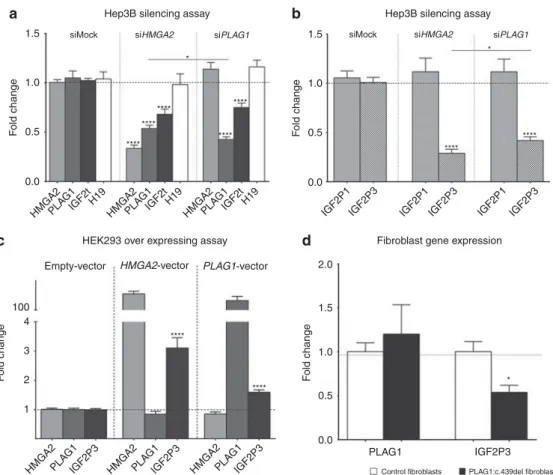
The small interfering RNA (siRNA)-mediated silencing of HMGA2 in Hep3b cells decreased PLAG1 and total IGF2 expression (Figure 2a). Silencing of PLAG1 resulted in lower levels of total IGF2, but did not change the levels of HMGA2 expression (Figure 2a). Since PLAG1 binds specifically to the IGF2 promoter P3, we assessed the levels of IGF2 generated by transcription from the P1 and P3 promoters (IGF2-P1 and IGF2-P3, respectively). The silencing of both HMGA2 and PLAG1 led to a downregulation of IGF2-P3, whereas IGF2-P1 expression remained normal (Figure 2b). Finally, H19 expression was not affected by the silencing of either HMGA2 or PLAG1. PLAG1 therefore acts as a trans–acting factor at the IGF2-P3 promoter, but does not affect the whole IGF2/H19 domain (Figure 2a). IGF2-P3 levels were signifi-cantly lower in siHMGA2-treated than in siPLAG1-treated cells despite the production of significantly lower levels of PLAG1 in siPLAG1-treated cells (Figure 2a,b), suggesting a PLAG1-independent HMGA2 regulation of IGF2. In order to verify this, we performed an overexpressing assay of HMGA2 and PLAG1 in HEK293 cells. Overexpression of HMGA2 in these cells resulted in an increased expression of IGF2-P3, without affecting the messenger RNA levels of PLAG1 (Figure 2c). However, PLAG1 maintained its capacity to upregulate IGF2-P3 upon PLAG1 overexpression (Figure 2c). These results show that HMGA2 and PLAG1 both positively regulate IGF2-P3 expression, independently or via a HMGA2– PLAG1–IGF2 pathway.
We further investigated gene expression in fibroblasts from patient I-2 from the family (Figure 1) carrying the PLAG1 deletion. The levels of PLAG1 expression were similar to those in controls, but IGF2 expression was half that of the controls (Figure 2d).
DISCUSSION
IGF2 has been identified as a major factor in the control of fetal growth in many species, including humans. IGF2 is a maternally imprinted gene, and its expression is regulated mostly by epigenetic marks.27Epigenetic and genetic defects within 11p15.5 have been implicated in syndromes involving growth retardation (SRS, with IGF2 downregulation)28 or overgrowth (Beckwith–Wiedemann syndrome, with IGF2 overexpression).29 Furthermore, the overexpression of IGF2 is frequently observed in several types of tumors, including embryonal tumors in particular.30 The epigenetic regulation
of IGF2 expression is well described, but the upstream genetic mechanism by which IGF2 expression is regulated remains unknown.
Case Familial case patient I-2 Familial case patient II-1 Familial case patient II-2
Sporadic case Sporadic case Sporadic case Sporadic case Sporadic case
Defect NM_002655.2:c. 439del NM_002655.2:c. 439del NM_002655.2:c. 439del NM_002655.2:c. 1363del NM_003483.4: c.193C> T NM_003483.4: c.189del NM_000612.5:c. 78C> G NM_000612.5:c. 158_159dup
Effect and prediction Frameshift- premature
stop Deleterious Frameshift-premature stop Deleterious Frameshift-premature stop Deleterious Frameshift-premature stop Deleterious Premature stop Deleterious Frameshift-elongated protein Deleterious Premature stop Deleterious Frameshift-premature stop Deleterious ClinVar accessions SCV000297812 SCV000297812 SCV000297812 SCV000297813 SCV000297814 SCV000297815 SCV000297816 SCV000297817
Gender Female Female Female Female Female Male Male Female
Phenotype SRS adult SRS SRS SRS SRS SRS SRS SRS
Gestational age (weeks of amenorrhea)
Term 39 w 6 d 39 w 31 w 6 d 39 37 32 w 2 d 29
Birth length cm/SDS Very small 44.5/–2.3 47/–2 37.5/–2.78 43.5/–3.9 40/–4.8 34.5/–4.97 30/–5.5
Birth weight g/SDS Very light 2,340/–2.1 2,557/–1.9 1,050/–3 2,300/–2.5 1,720/–3.1 960/–3.57 570/–4
Birth head circumference
cm/SDSa
? 31/–3.84 31/–3.45 27.4/–1.5 32.5/–2 31/–2.3 27/–2.13 23.5/–2.3
Relative macrocephaly at birth
? No No Yes Yes Yes Yes Yes
Length cm at 2 years cm/SDS
Very small 79/–2.0 75/–2.8 79/–2.0 66/–3.4 91.5/–3 (4 yr) 73.4/–3.5 65/–5.1
Weight g at 2 years/SDS Very light 8,520/–3.7 6,600/–6.7 7,800/–4.4 6,850/–3.6 11,800/–4 (4 yr) 6,590/–6.1 5,370/–6.2
BMI at 2 years/SDS ? 13.5/–2.3 11.7/–3.8 12.5/–3.2 15.6/–0.6 14.1/–1.1 12.2/–3.5 12.5/–3.2
Feeding difficulties during infancy
? Yes Yes Yes Yes Yes Yes Yes
Prominent forehead during infancy
Yes No Yes Yes Yes Yes Yes Yes
Body asymmetry No No No No No No No No N–H score 3/4b 3/6 4/6 4/6 5/6 5/6 5/6 5/6 Head circumference cm/SDS 2 yra 51.5/SDS–2.8 (adult) 43.9/–2.6 43.3/–2.5 44.7/–2.0 44.5/–1.2 NA 46.4/–1.7 43.2/–3.1
Triangular facies Yes Yes Yes Yes Yes Yes Yes Yes
Final height cm/SDS 148.3/–2.31 NA NA NA NA NA NA NA
GH therapy and age at start No Yes: 2.5 yr Yes: 2 yr Yes: 6 yr No Yes: 4.2 yr Yes: 3.3 yr Yes: 4.4 yr
GI/feeding therapies No Cyproheptadinec Cyproheptadinec Cyproheptadinec NGT 1.6 yr GT Cyproheptadinec
GT 2.6 yr NGT 2 months Bsl IGF1 (ng/ml)/SDS ND 162/+2.8 67/–1.5 119/-1.2 ND 142/+1.3 152/+3.30 285/+5.4 Bsl IGFBP3 (mg/L) [R 0.8–3.0 M 2.1]/ALS/SDS ND 2.6/20/+5.8 2.5/10/+1.8 2.1/8.3/+0.4 ND ND 2.0/ND/ND ND GH dose (mg/kg/wk)/ IGF1/SDS ND 0.26/368/+7.2 0.27/195/+3.1 0.24/255/+1.7 NA 0.31/402/+5 0.34/525/+9.0 0.36/348/+4.5 GH-treated IGFBP3 [R 1.5–3.4 M 2.4]/ALS/SDS ND 3.5/19/+4.5 3.0/16./+3.4 3.4/14/+2.8 NA 3.2/ND/NA 5.3/15/+2.4 ND IGF2 (ng/ml) ND 498d 393d 299d ND 920d 486eand 382e ND
ALS, acid labil subunit; BMI, body mass index; Bsl, basal; GH, growth hormone, GI, gastrointestinal; IGF, insulin-like growth factor; NA, not applicable; ND, not determined; (N)GT, (naso)gastric tube; N–H, Netchine–Harbison;
SDS, standard deviation score; SRS, Silver–Russell syndrome.
The criteria of the Netchine–Harbinson scoring system are marked in bold characters.
aHead circumference at birth≥ 1.5 SDS above birth weight and/or length SDS.bFor this adult patient, the Netchine–Harbison clinical scoring system was determined from four criteria only, as the two additional items (birth
head circumference and BMI at 2 years) were not available.cCyproheptadine, a first-generation antihistamine, has also been used as an orexigenic drug in some pediatric disorders with malnutrition.26dIGF2 Mediagnost RIA
assay, 3–7 years normal range 397–973 ng/ml.eIGF2 Esoterix assay, prepubertal normal range 334–642 ng/ml.
RESEARCH
ARTICLE
ABI HABIB et al |Oncogenes and fetal g rowth Volume 20 |Number 2 |February 2018 |GENETICS in MEDI CINEWe report the first mutations of PLAG1 in a familial case with dominant transmission of syndromic IUGR associated with SRS and in another sporadic case of SRS with a de novo mutation. Since PLAG1 is a key factor in the HMGA2– PLAG1–IGF2 pathway, we screened for and identified mutations of the HMGA2 and IGF2 genes. These findings highlight the crucial role of this pathway in controlling fetal IGF2 levels and its involvement in the pathophysiology of IUGR and SRS (Figure 3).
These observations also demonstrate that, in addition to epimutation at the 11p15 locus and mutation in the imprinted IGF2 gene, SRS may be caused by mutations of genes controlling IGF2 expression, such as PLAG1 and HMGA2. Though previously shown in mice,31 this is one of the first examples in humans, where nonimprinted genes deregulate the expression of distant, normally imprinted genes.
The mutations we identified in PLAG1 and HMGA2 were heterozygous leading to dominant transmission of SRS. The
mutations we found in IGF2 were also heterozygous, but because IGF2 is paternally expressed in most tissues during fetal and postnatal development, to induce the SRS pheno-type, an IGF2 mutation must occur on the paternal allele. We could not find any other inherited polymorphism near the de novo mutations in the IGF2 gene to specifically determine the parental origins of these mutations. However, given the typical SRS phenotype of these reported patients who carry the de novo IGF2 mutations, it is very likely that the mutations affected their paternal alleles, consistent with the imprinted status of this gene.
Very few mechanistic data on the HMGA2–PLAG1–IGF2 pathway or its role in pathological processes have been reported to date. All previous studies have shown HMGA2– PLAG1 and PLAG1–IGF2 expression levels to be correlated, in overexpression models or in tumors.18,32Murine models with
inactivation of Hmga2,19 Plag1,17 or Igf233 display growth
retardation, but the processes underlying the pathological phenotype have yet to be determined.
1.5 1.0 0.5 siMock siHMGA2 * * **** **** **** **** **** **** * **** **** ****
Hep3B silencing assay Hep3B silencing assay
siPLAG1
a b
d c
siMock siHMGA2 siPLAG1
0.0 1.5 1.0 0.5 0.0 100 2.0 1.5 1.0 0.5 0.0 PLAG1
Control fibroblasts PLAG1:c.439del fibroblasts
IGF2P3 4 3 2 1 HMGA2 HMGA2 PLA G1 PLA G1 IGF2P3 HMGA2PLA G1 IGF2P3 HMGA2PLA G1 IGF2P3 IGF2t F old change F old change F old change Empty-vector F old change
HEK293 over expressing assay Fibroblast gene expression
HMGA2-vector PLAG1-vector H19 HMGA2PLA G1 IGF2tH19 HMGA2PLA G1 IGF2t
IGF2P1 IGF2P3 IGF2P1IGF2P3 IGF2P1 IGF2P3 H19
Figure 2 Functional characterization of the effects ofHMGA2 and PLAG1 silencing/mutation on IGF2 expression. (a) HMGA2 is an upstream regulator of PLAG1, which in turn is an upstream regulator of IGF2. (b) The HMGA2–PLAG1 pathway regulates IGF2-P3 expression. (c) The IGF2 regulation by HMGA2 in a PLAG1-independent manner. (d) The effect of the PLAG1:c.439del on IGF2 expression in cultures of patient fibroblasts. A single asterisk indicates a Po 0.05, and four asterisks indicate a P o 0.0001. The histograms represent the fold change means of biological replicates. Three separate small interfering RNA (siRNA) and vector transfection assays were performed. Each transfection assay contained at least four transfected wells of control and siRNA or vector transfection (N ≥ 12 biological sample per group per assay). For fibroblast expression, five cultures of control fibroblasts derived from different donors were compared to five different passages of cultured fibroblasts from the patient carrying the PLAG1 single-nucleotide deletion. The error bars indicate the standard error of the mean.
We show that the disruption of any genes in this pathway leads to a decrease in IGF2 expression and produces a SRS phenotype, similar to patients carrying 11p15.5 epigenetic defects. We also show that this downregulation of IGF2 expression is caused by a lack of activation of the IGF2 P3 promoter, consistent with the results of previous studies showing a direct interaction between PLAG1 and this promoter.34 IGF2-P3 is the main transcript and is highly
active in fetal tissues, whereas IGF2-P1 is active only in the liver after birth.35This specific action at IGF2-P3 may account
for the nondecreased levels of IGF2 in patients with mutations of the PLAG1 and HMGA2 genes. Indeed, circulating IGF2 is synthesized from the P1 promoter in a biallelic fashion by the adult liver in humans with no imprinting in this organ.36 The silencing of HMGA2 or PLAG1 had no effect on IGF2 transcription from the P1 promoter. Therefore, patients with an HMGA2–PLAG1 defect display conserved P1 trans-cription activity in the liver, resulting in normal postnatal IGF2 serum levels. The patients with the IGF2 mutations had low normal or modestly decreased levels of IGF2 in the serum (Table 1). In this case, the circulating IGF2 was probably produced by transcription from the unaffected allele alone. This is in accordance with the modestly decreased circulating IGF2 levels observed in the previously described patients carrying paternal IGF210mutations (Table 1).
As expected with a genetic defect, none of the cases have body asymmetry. In a family carrying this kind of muta-tion, body asymmetry is not expected to occur because the molecular defect is present in all the cells of the body (unlike the mosaic epigenetic change at the 11p15.5 locus). Thus, the absence of body asymmetry does not exclude the diagnosis of SRS in this particular case. However, despite the fact that patients harboring a genetic defect of the HMGA2–PLAG1–IGF2 pathway presented IUGR and an SRS clinical diagnosis, some differences were observed between the phenotypes. Indeed, patients with the IGF2 and HMGA2 defects were smaller at birth and their head circumferences were larger than those patients with PLAG1 defects. These differences between the phenotypes could simply reflect individual human variations, and more cases are needed to confirm these observations. Such variability is also observed within the group of SRS patients with IGF2/H19 hypomethy-lation. However, using siRNA-based silencing technique in cell lines, we showed that HMGA2 silencing led to significantly lower levels of IGF2 expression than PLAG1 silencing, despite a more effective PLAG1 downregulation in the latter silencing assay. Furthermore, using vector-based overexpressing technique in another cell line, we showed that HMGA2 is capable of regulating IGF2 expression in a PLAG1-independent manner. Thus, IGF2 expression is more strongly affected by IGF2 and HMGA2 mutations, respec-tively, than by PLAG1 mutations.
The elucidation of these new genetic mechanisms has major implications for genetic counseling. In keeping with the imprinted, paternally expressed nature of the gene, males carrying IGF2 mutations have a 50% risk of transmitting the disorder. As HMGA2 and PLAG1 are not imprinted, males and females with mutations of these genes both have a 50% risk of transmitting SRS. Given this high risk of SRS transmission, screening for mutations of these genes should be considered in cases of SRS presenting with no epigenetic defect of 11p15.5 or maternal disomy of chromosome 7. Furthermore, in the context of next-generation sequencing, these genes could be included in panels for the screening of growth retardation disorders for patients with no 11p15 epimutations or maternal disomy of chromosome 7 or 14.
In conclusion, we show for the first time that defects of the HMGA2–PLAG1–IGF2 pathway can lead to SRS, highlighting the role of this oncogenic pathway in the fine regulation of physiological fetal/postnatal growth and food intake. We also show that nonimprinted genes can deregulate the expression of distant imprinted genes in humans. Given the crucial role played by the low level of IGF2 expression in the outcome of IUGR and the SRS phenotype, identification of new targets of IGF2 will be the next step in the development of new treatment options for this group of patients.
Accession numbers
The ClinVar accession numbers for the PLAG1, HMGA2, and IGF2 variant sequences reported in this paper are listed in
Table 1. Normal PLAG1 PLAG1 PLAG1 PLAG1 IGF2 IGF2 IGF2 IGF2 SRS HMGA2 HMGA2 HMGA2 HMGA2 PLA G1 PLA G1 PLA G1 PLA G1 P3 P3 P3 P3
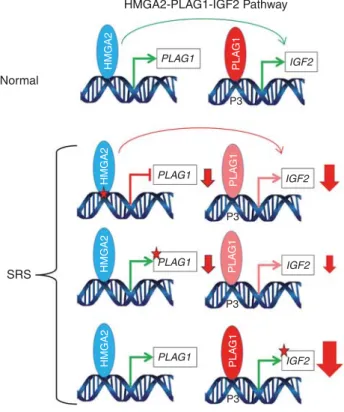
Figure 3 Schematic representation of the HMGA2–PLAG1–IGF2 pathway in a normal individual and in Silver–Russell cases. Green arrows indicate normal expression, the sizes of red arrows are representative of IGF2 downregulation and red stars indicate functional impairment for HMGA2, PLAG1, or IGF2 expression. SRS, Silver–Russell syndrome.
SUPPLEMENTARY MATERIAL
Supplementary material is linked to the online version of the paper at http://www.nature.com/gim
ACKNOWLEDGMENTS
This work was supported by the Institut National de la Santé et de la Recherche Médicale, funding from the Université Pierre et Marie Curie (UPMC-Paris6), the Agence Nationale de la Recherche (ANR EPIFEGRO 2010) and from the“Association Françaises des Familles ayant un enfant atteint du Syndrome Silver Russell ou né Petit pour
l'Age Gestationnel (AFIF/PAG)”. W.A.H. was supported by the
People Programme Marie Curie Actions (MCA) of the European Union’s Seventh Framework Programme FP7/ITN Ingenium 2007– 2013/ under REA grant agreement no. 290123 and by the Société Française d’Endocrinologie et Diabétologie Pédiatrique. F.B. was
supported by a Novonordisk “Growth Hormone, Growth and
Metabolism” grant. J.T.B. is supported by a Pediatric Early
Research Career Award from Seattle Children’s Research Institute. We received funding from the Fondation des Maladies Rares (France) for exome sequencing in the familial case. We thank the patients, their families, and their physicians (Jeanne Languepin, Marie-Pierre Cordier, and Noel Peretti), and the MAGIC Founda-tion, for their support. We also thank Françoise Praz from the Saint Antoine Research Centre (INSERM_U938) for kindly providing the Hep3B cell line for the silencing assays and Sandra Chantot-Bastaraud for performing the SNP arrays for the familial case. In addition, we are grateful to Laurence Perin for performing IGF2 determinations on patients’ serum, and Nathalie Thibaut, Cristina Das Neves, Marilyne le Jule and Evelyne Tagodoe, the diagnostic technicians of the Pediatric Endocrinology Department, Trousseau Pediatric Hospital.
W.A.H., I.N., and Y.L.B. are members of the European Union’s Seventh Framework Programme FP7/ITN Ingenium 2007–2013. F.B. and I.N. are members of the EUCID.net network COST (BM1208).
AUTHOR CONTRIBUTIONS
W.A.H, F.B, S.A, Y.L.B, M.D.H and I.N conceived the project and analyzed the data. W.A.H performed and designed experiments. T.Y performed DNA extraction and reviewed the manuscript. T.E, J.T.B, A.L.R, F.T, J.S and M.D.H provided patients’ samples and recorded the clinical data. W.A.H, F.B, M.D.H and I.N wrote the manuscript.
DISCLOSURE
The authors declare no conflict of interest.
REFERENCES
1. Sheridan C. Intrauterine growth restriction—diagnosis and management. Aust Fam Physician. 2005;34:717–723.
2. Azzi S, Salem J, Thibaud N, et al. A prospective study validating a clinical scoring system and demonstrating phenotypical-genotypical correlations in Silver-Russell syndrome. J Med Genet. 2015;52:446–453.
3. Dias RP, Nightingale P, Hardy C, et al. Comparison of the clinical scoring systems in Silver-Russell syndrome and development of modified diagnostic criteria to guide molecular genetic testing. J Med Genet. 2013;50:635–639.
4. Bartholdi D, Krajewska-Walasek M, Ounap K, et al. Epigenetic mutations of the imprinted IGF2-H19 domain in Silver-Russell syndrome (SRS): results from a large cohort of patients with SRS and SRS-like phenotypes. J Med Genet. 2009;46:192–197.
5. Netchine I, Rossignol S, Dufourg MN, et al. 11p15 imprinting center region 1 loss of methylation is a common and specific cause of typical Russell-Silver syndrome: clinical scoring system and epigenetic-phenotypic correlations. J Clin Endocrinol Metab. 2007;92:3148–3154. 6. Wakeling EL, Brioude F, Lokulo-Sodipe O, et al. Diagnosis and
manage-ment of Silver-Russell syndrome: first international consensus statemanage-ment. Nat Rev Endocrinol. 2016;13:105–124.
7. Gicquel C, Rossignol S, Cabrol S, et al. Epimutation of the telomeric imprinting center region on chromosome 11p15 in Silver-Russell syndrome. Nat Genet. 2005;37:1003–1007.
8. Azzi S, Blaise A, Steunou V, et al. Complex tissue-specific epigenotypes in Russell-Silver Syndrome associated with 11p15 ICR1 hypomethylation. Hum Mutat. 2014;35:1211–1220.
9. Brioude F, Oliver-Petit I, Blaise A, et al. CDKN1C mutation affecting the PCNA-binding domain as a cause of familial Russell Silver syndrome. J Med Genet. 2013;50:823–830.
10. Begemann M, Zirn B, Santen G, et al. Paternally inherited IGF2 mutation and growth restriction. N Engl J Med. 2015;373:349–356.
11. Kas K, Voz ML, Roijer E, et al. Promoter swapping between the genes for a novel zinc finger protein and beta-catenin in pleiomorphic adenomas with t(3;8)(p21;q12) translocations. Nat Genet. 1997;15:170–174. 12. Astrom A, D’Amore ES, Sainati L, et al. Evidence of involvement of the
PLAG1 gene in lipoblastomas. Int J Oncol. 2000;16:1107–1110. 13. Zatkova A, Rouillard JM, Hartmann W, et al. Amplification and
over-expression of the IGF2 regulator PLAG1 in hepatoblastoma. Genes Chromosomes Cancer. 2004;39:126–137.
14. Voz ML, Agten NS, Van de Ven WJ, Kas K. PLAG1, the main trans-location target in pleomorphic adenoma of the salivary glands, is a positive regulator of IGF-II. Cancer Res. 2000;60:106–113.
15. Hensen K, Van Valckenborgh IC, Kas K, Van de Ven WJ, Voz ML. The tumorigenic diversity of the three PLAG family members is associated with different DNA binding capacities. Cancer Res. 2002;62:1510–1517. 16. Declercq J, Van Dyck F, Braem CV, et al. Salivary gland tumors in transgenic mice with targeted PLAG1 proto-oncogene overexpression. Cancer Res. 2005;65:4544–4553.
17. Hensen K, Braem C, Declercq J, et al. Targeted disruption of the murine Plag1 proto-oncogene causes growth retardation and reduced fertility. Dev Growth Differ. 2004;46:459–470.
18. Klemke M, Muller MH, Wosniok W, et al. Correlated expression of HMGA2 and PLAG1 in thyroid tumors, uterine leiomyomas and experimental models. PLoS One. 2014;9:e88126.
19. Zhou X, Benson KF, Ashar HR, Chada K. Mutation responsible for the mouse pygmy phenotype in the developmentally regulated factor HMGI-C. Nature. 1995;376:771–774.
20. De Crescenzo A, Citro V, Freschi A, et al. A splicing mutation of the HMGA2 gene is associated with Silver-Russell syndrome phenotype. J Hum Genet. 2015;60:287–293.
21. Fokstuen S, Kotzot D. Chromosomal rearrangements in patients with clinical features of Silver-Russell syndrome. Am J Med Genet A. 2014;164A:1595–1605.
22. Okada Y, Kamatani Y, Takahashi A, et al. A genome-wide association study in 19 633 Japanese subjects identified LHX3-QSOX2 and IGF1 as adult height loci. Hum Mol Genet. 2010;19:2303–2312.
23. Cho YS, Go MJ, Kim YJ, et al. A large-scale genome-wide association study of Asian populations uncovers genetic factors influencing eight quantitative traits. Nat Genet. 2009;41:527–534.
24. Gudbjartsson DF, Walters GB, Thorleifsson G, et al. Many sequence variants affecting diversity of adult human height. Nat Genet. 2008;40: 609–615.
25. Weedon MN, Lettre G, Freathy RM, et al. A common variant of HMGA2 is associated with adult and childhood height in the general population. Nat Genet. 2007;39:1245–1250.
26. Chinuck R, Dewar J, Baldwin DR, Hendron E. Appetite stimulants for people with cystic fibrosis. Cochrane Database Syst Rev. 2014: CD008190.
27. Chao W, D’Amore PA. IGF2: epigenetic regulation and role in develop-ment and disease. Cytokine Growth Factor Rev. 2008;19:111–120. 28. Abi Habib W, Brioude F, Azzi S, et al. 11p15 ICR1 partial deletions
asso-ciated with IGF2/H19 DMR hypomethylation and Silver-Russell syndrome. Hum Mutat. 2016;38:105–111.
29. Abi Habib W, Azzi S, Brioude F, et al. Extensive investigation of the IGF2/ H19 imprinting control region reveals novel OCT4/SOX2 binding site defects associated with specific methylation patterns in Beckwith-Wiedemann syndrome. Hum Mol Genet. 2014;23:5763–5773. 30. Azzi S, Abi Habib W, Netchine I. Beckwith-Wiedemann and Russell-Silver
Syndromes: from new molecular insights to the comprehension of imprinting regulation. Curr Opin Endocrinol Diabetes Obes. 2014;21: 30–38.
31. Mott R, Yuan W, Kaisaki P, et al. The architecture of parent-of-origin effects in mice. Cell. 2014;156:332–342.
32. Juma AR, Damdimopoulou PE, Grommen SV, Van de Ven WJ, De Groef B. Emerging role of PLAG1 as a regulator of growth and reproduction. J Endocrinol. 2016;228:R45–56.
33. DeChiara TM, Efstratiadis A, Robertson EJ. A growth-deficiency phenotype in heterozygous mice carrying an insulin-like growth factor II gene disrupted by targeting. Nature. 1990;345:78–80.
34. Akhtar M, Holmgren C, Gondor A, et al. Cell type and context-specific function of PLAG1 for IGF2 P3 promoter activity. Int J Oncol. 2012;41: 1959–1966.
35. Li X, Nong Z, Ekstrom C, et al. Disrupted IGF2 promoter control by silencing of promoter P1 in human hepatocellular carcinoma. Cancer Res. 1997;57:2048–2054.
36. Ekstrom TJ, Cui H, Li X, Ohlsson R. Promoter-specific IGF2 imprinting status and its plasticity during human liver development. Development. 1995;121:309–316.
37. Gnirke A, Melnikov A, Maguire J, et al. Solution hybrid selection with ultra-long oligonucleotides for massively parallel targeted sequencing. Nat Biotechnol. 2009;27:182–189.
This work is licensed under a Creative Commons Attribution-NonCommercial-NoDerivs 4.0 International License. The images or other third party material in this article are included in the article’s Creative Commons license, unless indicated otherwise in the credit line; if the material is not included under the Creative Commons license, users will need to obtain permission from the license holder to reproduce the material. To view a copy of this license, visit http://creativecommons.org/licenses/ by-nc-nd/4.0/