Publisher’s version / Version de l'éditeur:
Vous avez des questions? Nous pouvons vous aider. Pour communiquer directement avec un auteur, consultez la
première page de la revue dans laquelle son article a été publié afin de trouver ses coordonnées. Si vous n’arrivez pas à les repérer, communiquez avec nous à [email protected].
Questions? Contact the NRC Publications Archive team at
[email protected]. If you wish to email the authors directly, please see the first page of the publication for their contact information.
https://publications-cnrc.canada.ca/fra/droits
L’accès à ce site Web et l’utilisation de son contenu sont assujettis aux conditions présentées dans le site LISEZ CES CONDITIONS ATTENTIVEMENT AVANT D’UTILISER CE SITE WEB.
Internal Report (National Research Council of Canada. Division of Building Research), 1959-11-01
READ THESE TERMS AND CONDITIONS CAREFULLY BEFORE USING THIS WEBSITE. https://nrc-publications.canada.ca/eng/copyright
NRC Publications Archive Record / Notice des Archives des publications du CNRC :
https://nrc-publications.canada.ca/eng/view/object/?id=abd69fc5-2695-40d2-a696-bcc9d2271f05 https://publications-cnrc.canada.ca/fra/voir/objet/?id=abd69fc5-2695-40d2-a696-bcc9d2271f05
NRC Publications Archive
Archives des publications du CNRC
For the publisher’s version, please access the DOI link below./ Pour consulter la version de l’éditeur, utilisez le lien DOI ci-dessous.
https://doi.org/10.4224/20386753
Access and use of this website and the material on it are subject to the Terms and Conditions set forth at Snow loads on roofs 1958-59: third progress report
NATIONAL RESEARCH COUNCIL CANADA
DIVISION OF BUILDING RESEARCH
SNOW LOADS ON ROOFS 1958-59 Third Progress Report
by
H.
J.
Thorburn and B. G. W. PeterANAL VZfD
Internal Report No. 184
of the
Division of Building Research
OTTAWA November 1959
PREFAOE
The numerous roof failures caused b;)' the snow loads of the 1958-59 winter have again provided a reminder of the danger that can be created by heavy snow loads on roofs and of the fact that these loads must be adequately allowed for
in desie,n. Safety is one aspect of design; economy is another.
In Canada, the magnitude of the design snow load usually
governs the design of the roof and therefore has considerable
influence on the cost of construction. Thus it is that the
design snow loads are an important ー。セセ of any Oanadian
building code. The design snow loads must be high enouGh to
reduce the probability of failure to an acceptable level. but not so high that unnecessary and unreasonable costs result.
It is generally considered that the snoV'! loads
specified in the present National Building Oode (1953 edition), excluding the loads for the mountainous areas, satisfy the
safety requirement. Indeed, it has been said that they are
excessively safe and that in some cases they resu.l t in
unneces-sary and unreasonable costs. It has been claimed that tbe
measurements of ground snow depths upon which the セイョッ loads
are based are not directly applicable to the determination of
roof snow loads, because superficial observations usuaLl.y
showed that roof snow depths were appreciably less than those on the ground.
Recognizing these criticisms, and appreciating the influence of snow loads on the cost of construction, the
Division of Building Research, in 1956, began a survey of the
actual snow loads on roofs. This countrywide study began with
a pilot survey of the 1956-57 winter and has continued during
subsequent winters as a full survey, with the co-operation of
more than 50 observers across Oanada. The winter of 1958-59
wns the third winter in which observations were made.
This third progress report on this work presents
the results of the 1958-59 observations. It follows closely
the form of the second progress report in using graphs, tables,
and photographs as the main means of presentation. Trends and
unusual features of the observations are discussed in detail. Appendix A describes a number of the roof failures caused by
the snow loads of the 1958-59 winter. Because of the annual
variations in snowfall preliminary conclusions only can be
drawn after but three winters of observations. Definite
ii
Once again, it is a special pleasure to record here the appreciation of the Division of Building Research for the excellent work done under difficult conditions by all the observers across Canada.
The report was prepared by H. J. Thorburn, research
officer with the Building Structures Section of the Division of Building Research and B. G. W. Peter, fourth-year civil engineering student of Nova Scotia Technical College who worked with the Section during the summer of 1959.
ottawa,
111
TABLE OF CONTENTS
Description of the 1958-59 Survey
.
.
.
.
..
.
.
..
.
セ..
.
.
.
.
.
.
.
.
.
..
.
..
.
.
.
...
.
...
1.2.
Introduction
Summary of 1958-59 observattons
.
...
..
.
..
.
.
.
.
.
.
.
.
.
.
..
.
.
.
.
.
.
.
.
.
.
.
..
.
.
1 2 2.
.
...
.
.
.
.
.
.
.
.
.
..
.
.
.
.
....
.
.
.
.
.
.
.
.
.
..
.
.
.
.
.
.
.
.
...
.
.
..
.
..
.
.
.
.
.
.
..
.
..
.
.
.
.
.
.
.
.
.
.
..
.
.
..
..
.
.
.
.
.
.
.
.
.
.
.
...
.
.
.
.
..
.
...
.
.
.
..
.
....
.
.
.
.
.
.
.
.
.
.
.
..
.
...
..
...
.
.
.
...
.
4 4 3 8 5 7 813
8 10.
..
.
.
.
.
..
..
.
.
.
.
.
.
.
.
.
..
.
.
.
..
.
.
.
.
.
.
..
.
....
.
...
.
.
..
.
.
.
..
..
.
.
.
.
.
...
.
.
.
.
.
.
.
..
.
....
...
.
.
.
.
..
.
..
.
...
..
.
..
.
Meteorological Factors Roof Factors •.•••••••••••. A Stations B Stations C Stations (a) (b) (a) (b) (c) Results Weather Further Points General Discussion Presentation of Results5.
7.
4.
8. 6...
...
.
.
.
.
.
..
.
.
.
.
...
..
..
.
.
.
.
Preliminary Conclusions9.
(a) (b) (c)Accumulations from Above-normal Snow Density ••••••••••.••.•. Snow Loads in the Mountains
Snowfall
.
...
13
13
14
14
Acknowledgements.
.
..
.
.
.
...
.
.
.
..
....
.
.
.
.
.
.
.
..
.
.
.
.
..
.
.
.
.
15 Appendix A. Roof Failures Under the Snow Loads ofSNOW I,OADS CHI ROOFS 1958-59
Third iセッァイ・ウウ Report
by
H. J. Thorburn and B. G. W. Peter
This progress report covers the observations made
during the winter 1958-59 in the continuing country-wide survey
of snow loads on roofs being carried out by the Division of
Building Research. This survey comprises observations of snow
depth and density on a number of large and small roofs and observations of depth only on a similar number of roofs.
Corresponding observations are made on the ground surrounding each roof.
The survey was started in 1956 at the request of the
Advisory Structural Group of the Assoc Lat e Committee on the
National Building Code. The purpose of the survey is to
provide a basis for more rational design snow loads in future
editions of the National Building Code. The basic design snow
loads specified in the present lIDC (1953 edition) are based
directly on measurements of ground snow depth and, although these loads are more r8tional than those of any previous Canadian specification, there is some evidence that ground snow depths are not always directly applicable to the
deter-mination of roof snow loads. Superficially it appears that
snow accumulations on roofs are generally less than on the ground.
The objectives of the survey as defined in 1956
remain unchanged. The prime objectives are to determine the
relationship or difference between snow accumulations on roofs and on the ground and to study the factors which produce this
difference. Another important aim is the collection of examples
or case histories of snow loads on certain roofs which, it is hoped, will assist designers in determining the loads to be expected from a given set of conditions.
In the pilot survey of the 1956-57 winter
observa-tions were made at seven representative locaobserva-tions across Canada to test the method and apparatus proposed for the full survey. On the basis of the results of this preliminary investigation,
the xull survey was planned and started in 1957-58. A full
description of the background and results of these past survey activities has been presented in three DBR internal reports:
2
-DBR Report 106 - gives the background of the whole survey and. a proposal for the pilot survey
DBR Report
134 -
gives the results of the pilot surveyand a proposal for the full survey DBR Report 163 - gives the results of the first winter
of full survey observations.
It is the purpose of the present report to summarize and discuss the observations made during the 1958-59 winter. As the method of presentation used in Report 163 proved
satis-factory, it has been used again with few changes. Where
advantageous, 1957-58 results have been considered in combina-tion with those of 1958-59.
Numerous roof failures were caused by snow loads
during the 1958-59 winter. Because there are lessons to be
learned from these failures, a discussion of some of them is
given in Appendix A to this report. All the failures discussed
were investigated by the Division. Although the snow loads at
the time of failure are here the prime interest, the lessons to be learned from the failures do not relate to the actual loading.
2. SUMMARY OF 1958-59 OBSERVATIONS
The snow load observations of the 1958-59 winter have prOVided considerable evidence in support of the trends
observed in past winters. This is true for both Western and
F..astern Canada where the snowfalls were below and generally
above normal respectively. Again, a very appreciable difference
has been observed between average roof and ground snow loads, with the amount by which they differed being extremely variable
and usually hard to predict. At the same time, snowdrifts and
concentrations far exceeding the ground load were observed, most of them in locations where one would expect them to occur. Of all the factors causing these variations from the ground load wind, combined with shelter, shape, and orientation of the roof, proved to have the greatest effect while heat loss and solar radiation were secondary.
3.
DESCRIPTION OF THE 1958-59 SURVEYThe survey was carried out in essentially the same
way as it was during the 1957-58 winter. The three types of
3
-again with the locations of most 01' the s t.at Lons unchange d ,
A Station observers continued, in most cases, to make detailed measurements of depth and density on one flat and
one pitched roof of residen"t;ial size, and on the suz-rounding
grollild. These measurements, which were made weekly and after
every heavy snowstorm, were carried out as described in DBR
Technical Note 233.
B Station observers made less detailed ob s ervat Lons .
Here, periodic measurements of depth only were made throughout the winter on usually one roof and on the surrounding ground. Additional depth measurements were made on other roofs at the time when the snow loads were at a maximum for the winter.
C Station observers, as in 1957-58, made detailed
observa-tions on i。イァセ roofs located at RCAF bases across Canada. Each
station observed two or more of the four standard C-Station roofs, the four b e i.ng the Un.it Supply Depot roof (flat), the cantilever hangar roof (flat), the Mechanical Equipment Garage roof (flat, split-level) and the arch hangar roof (curved). As at A Stations, snow depths and densities were measured on
each roof and the surrounding ground we ek.Ly and after every
heavy snowstorm.
Observation reports for the 1958-59 winter were
received from a total of 50 stations. Fifteen A Stations
reported observations on 42 roofs, 28 B Stations on 46 roofs
and
7
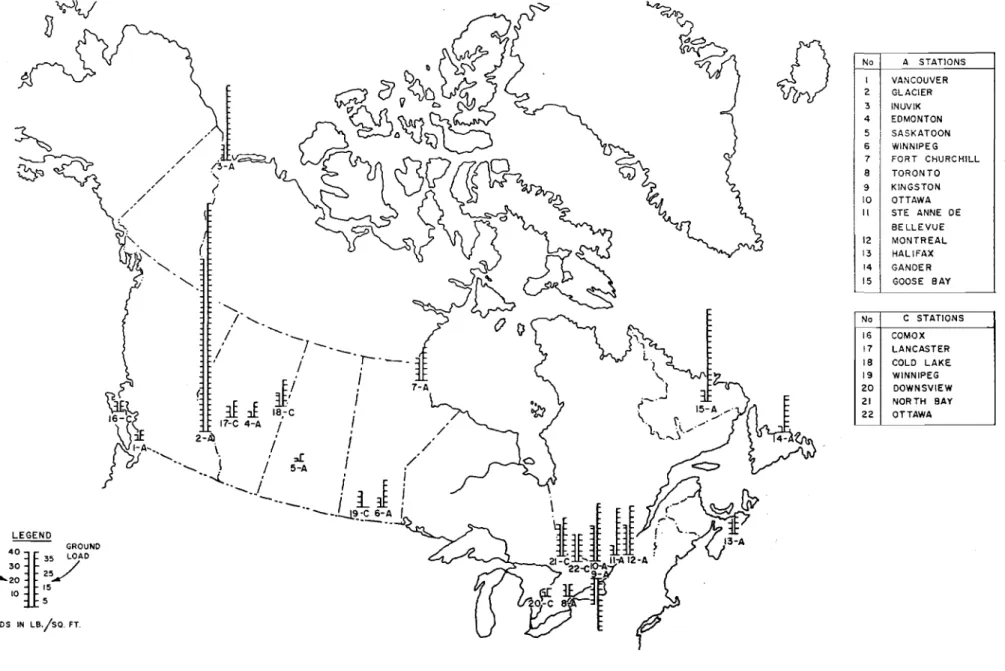
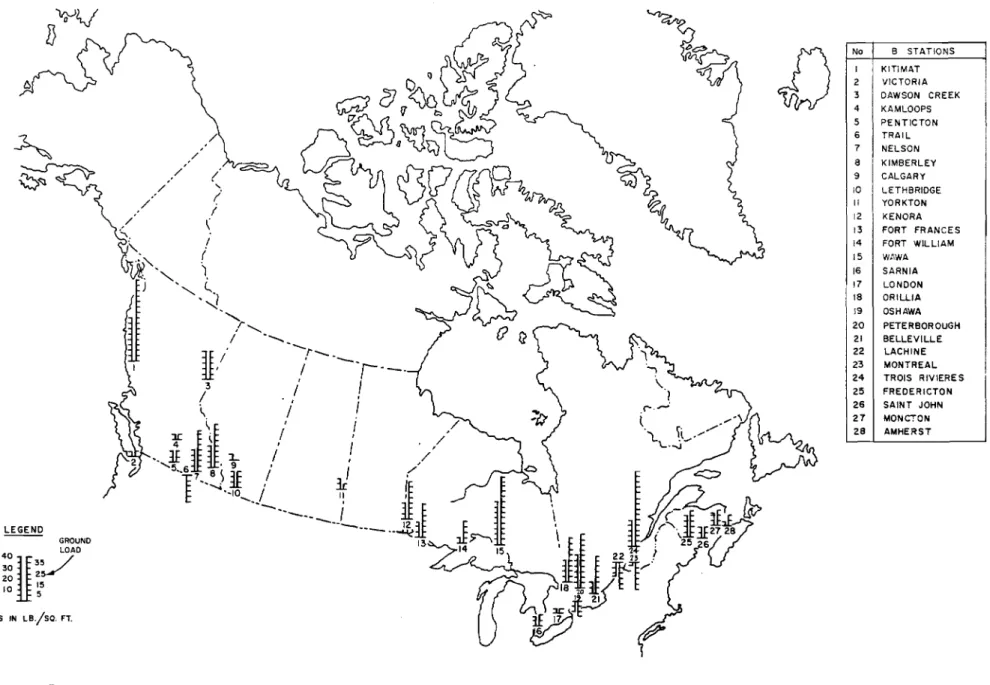
C Stations on 23 roofs for a total of III roofs. Thelocations of all stations are given in Figs. 1 and 2.
4.
PRESENTATION OF R8SULTSAs in DBR Report 163, A-Station results are given in detail for each roof by means of a graph in which the
maximwn, average, and minimum roof loads and the average ground
load are plotted against time. Accompanying the graphs for
each station are records of wind, temperature, and sunsru.ne
and drawings giVing the gauge positions and the basic
dimen-sions of each roof. These detailed results, which are given
in Figs. 3 to 17 inclusive, are sUlnmarized in Table I and its graphical equivalent, Fig. 25.
B-Station results are presented in somewhat more
detail than they are in Report 163. In addition to the map
giving B-Station locations and "stick" graphs of maximum average roof and ground loads (Fig. 2), the present report
includes a tabular summary in which roof details and loading influences are noted (Table II).
With t!l2 exception of the graphical summary, C- Station
results are presented in the same form as those of the
A Stations. The load-time graphs for each roof are given in
Figs. 18 to 24 inclusive DT,d the tabular summary in fable III.
One small but significant change has been made in the method of determining the load-time curves for several of
the セ。ョ、 C-Station roofs. In those cases where depth
measure-ments were made not only on the main roof but also on adjacent canopies or lean-to roofs, the measurements made on the adja-cent roofs have been disregarded in determining the load-time
curves. Therefore the maximum, average, and minimum load
curves given for all roofs are for the main roof areas only. Where required, an additional curve has been plotted to show
the maximum load occurring on the canopy or lean-to roof. In
Report
163
main and adjacent roof readings were consideredtogether, with the result that the curves did not represent the loads on the main roof only but an average of the actual main roof load and the usually large adjacent roof load.
5.
WEATHERThe weather across Canada during the
1958-59
wintershowed considerable variation from the normal but all parts
did not vary in the same direction. Snowfall in the three
western provinces and the northenl territories was up to 25
per cent below normal; the temperatures throughout the Winter, with the exception of January, were generally above nornal.
Conversely, the other seven provinces had snowfalls varying from 0 to 100 per cent above normal, tlle latter figure applying to the "snow belt" (east of Lake Huron) of southern Ontario.
Temperatures generally ran below normal. Throughout the
country, Wind, the factor with the greatest influence on snow
loads, did not show any significant departure from normal. On
the other hand, the number of hours of sunshine showed a positive departure.
6. RESULTS
As stated in the summary, the observations of the
1958-59 winter have prOVided considerable evidence in support
of the.trends observed during the previous two winters. Most
significant of these, again, is the difference observed between
snow loads on roofs and snow loads on the ground. As before,
in most cases, average roof loads were significantly less than those on the ground, with the roof load vaIying from 0 to 100
roof load was sub at.arrt LaLf.y less than the ground load, as bOIne out by the fact that only 20 per cent of the roofs
observed had loads of more than 75 per cent of the gro1xnd load.
A good part of this 20 per cent was made up of roofs located in areas where the maximum snow load resulted from a single stonn as opposed to those areas where the load accumulated
throughout the winter. In the latter areas roofs which had a
high roof-to-ground-load ratio we re invariably in sheltered
locations. This would indicate, therefore, that shelter
condi-tions are the main factor in detennining the
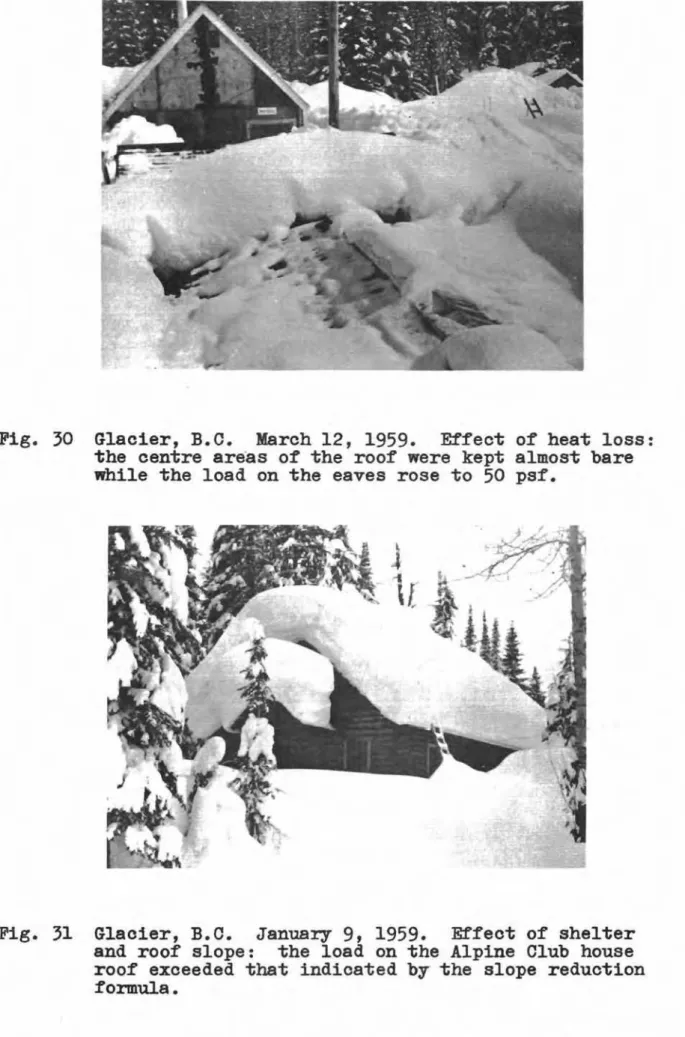
roof-to-ground-load ratio. The results for the Alpine Club house at Glacier
(Fig. 31), which is a completely sheltered location, provide a good example.
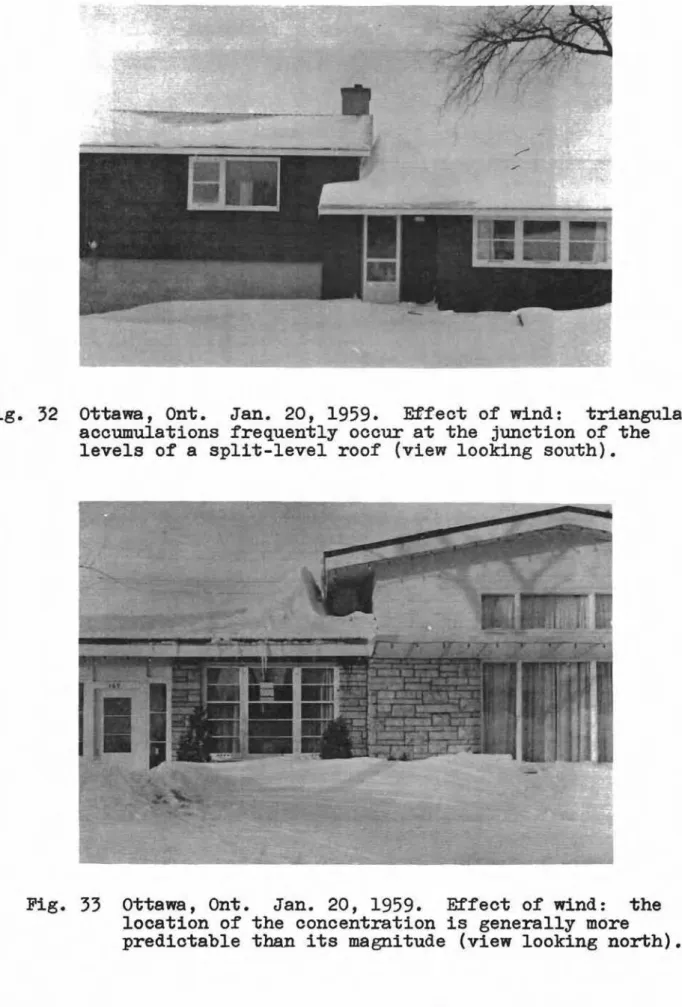
The 1958-59 results also provided further information on the manner in which concentrations and drifts occur on
various roof shapes. In many cases these concentrations
greatly exceeded the ground load. The most frequently observed
examples occurred at the junction of the levels of split-level roofs, on porch roofs and canopies, and along parapet walls. Others occurred at the ridges of pitched roofs and around large
chimneys. Although the locations of many of these
concentra-tions can now be predicted, their magnitudes vary considerably and are difficult to predict.
The following comments on individual A-Station observations will point out some of the variations in the roof to ground ratio and load concentrations mentioned above.
(a) A Stations
Montreal. - Although the 1958-59 snowfall wa s roughly
10 per cent above ョoャセ。ャL the average loads observed on two of
the three roofs did not exceed 10 psf and, in fact, were not larger than those of the previous winter which had less
snow-fall. On the third roof, however, a flat roof without a
parapet, the average load reached 27 psf and a concentration which occurred in the same place as it had the previous winter
produced a maximum load of 72 psf. These relatively large
loads are explained by the unusual shelter conditions of the
roof. On the east and west wide the roof is abutted by higher
buildings which, besides sheltering the roof, prOVide sources
from which snow can be transferred. The north and south sides
of the roof are unsheltered.
ste. aセセ・ de Bellevue.- First observations from this
station, located 20 miles west of Montreal, were made dltring
the 1958-59 winter. Winds from the west tended to keep the
flat roof bare while sections of the gable roof, sheltered by the higher central section of the building, accumulated a
s
-concentrated load of 75 psf. 'I'he ave ra ge load for botb roofs
never exceeded 20 per Gent of the 50 psf design load. The
danger of loads resulting from ice damming at the eaves was well demonstrated on the gab]e Toof where "22 inches (110 psf) of ice accumulated, the result of poor insulation.
Ottawa.- In spite of the fact that ottawa received a total snowfall 25 per cent above normal, the maximum average load on any of the five observed roofs did not exceed 62 per
cent of the 50 psf rIDC design load. This load occurred on a
well sheltered split-level flat roof which at the junction of
the levels accumulated a concentrated load of 60 psf. On two
less sheltered flat roofs, one with a parapet and one without, the average loads reached 29 and 23 psf and the maximum load
reached
44
and 33 psf respectively. In the first case, themaximum occurred at the parapet wall and in the second near a
large chimney which created local drifts. Average accumulations
on the gable roofs were fairly uniform and never exceeded 10 psf.
Kingston. - Although Kingston's snowfall for the 1958-59 winter was 91 inches (60 per cent above normal), the maximum average load remained less than 30 and 40 per cent of the }ffiC design load on the pitched and flat roofs
respec-tively. Appreciable drifting did not occur on the pitched
roof but on the flat roof, drifting to a depth of 28 inches occurred at the parapets while the central areas never
accumu-lated more than
5
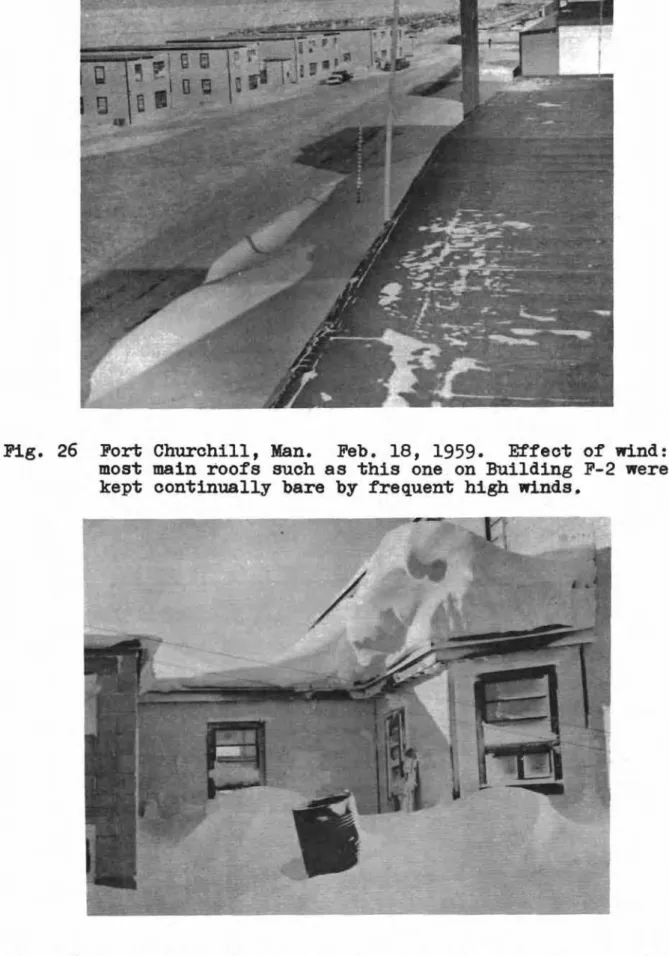
inches of snow.Fort Churchill.- As in 1957-58, the roofs at Fort Churchill again showed the results of extreme exposure in an
area of frequent high winds. All main roofs were continually
swept bare while large accumulations occurred on areas of localized shelter such as the lean-to and corridor roofs
(Figs. 26 and 27). Although the ground load reached 31 psf
average roof loads never exceeded 5 psf. The maximum observed
concentration occurred on a corridor roof and reached 69 psf.
wゥョョゥー・セNM With the snowfall exceeding the normal
54
inches by58
per cent, the average loads on the roofsobserved at Winnipeg never exceeded 35 per cent of the ground
load, nor 23 per cent of the NBC design load. These low loads
were primarily due to the exposed location of both roofs. As
on other flat roofs, drifting occurred against the parapet walls while the central areas were never covered by more than
5
inches. Negligible drifting occurred on the pitched roof.Inuvik.- Compared with other stations Inuvik, with
its snowfall
25
per cent below normal, experienced higher snow7
-found in the faot that the measured snow densities were
unusually high 8nd that the mean number of hours of calm
experienced at Inuvik is
5
to 10 times that of most otherstations. In spite of this, however, both gable roofs showed
definite signs of wind action in that they both had uneven
load distributions, the load on the lee side being almost twice
that on the windward. The distribution on the lee side was
consistently the same with the maximum at the ridge and the
minimum at the eaves. Average roof loads reached 13 and 16 psf
or roughly 50 per cent of the NBC design load.
Glacier.- Because of its elevation and location (4100 ft in the British Columbia mountains) the A Station at Glacier experienced, as it does every year, extreme snow loads. With a snowfall of 39 feet, which is 35 per cent above normal,
the average ground load reached 193 psf. Approaching this were
the average loads on the completely sheltered Alpine Club house roof and the flat powder house roof when they reached
160 and 155 psf respectively. The maximum load on these roofs
did not exceed the average by more than 10 per cent. The
snow load on the third roof observed at Glacier was unfortu-nately, but from necessity, removed after it reached an average
of 66 psf. As the roof had been designed for 30 psf it had
naturally shown signs of considerable strain before the load
was removed. Ice damming at the eaves and the resulting leaks
also made it necessary to remove the snow. All roofs at
Glacier had a tendency to accumulate large overhanging snow bulges, some extending 6 feet horizontally from the eaves. Although such overhangs decreased the load on the roof rafters through cantilever action, they ultimately increased the
vertical load carried by the walls.
Other A Stations.- The loads observed at the A Stations not mentioned above all provided evidence that roof loads are usually less than the corresponding ground
load. No unusual accumulations were obserVed, however, and
the results given in the graphs are therefore self-explanatory. (b) B Stations
On the whole, the results of B-Station observations made during the 1958-59 winter followed along the same lines
as those of the A Stations. Generally, a significant difference
was observed between roof and ground loads with the difference
again being widely variable. Numerous concentrations with
depths greater than the ground depth were also observed on sheltered sections of roofs such as at parapet walls and on canopies and lean-to roofs.
.. 8
-(c) a Stations
As in the previous winter the results of a-Station observations again showed that large flat roofs, when in
exposed locations, do not accumulate high average loads. The
cantilever hangar roof at ottawa shown in Fig. 28 is a good
example. With the exception of the flat wings of the arch
hangar roof none of the roofs had average loads exceeding 15
psf. Had it not been for the projections on each of the roofs
the average loads would undoubtedly have been less. It was at
these projections, i.e., at the parapet wall of the Supply Depot roof, the raised section of the M. E. Garage roof and the door housings of the cantilever hangar roof that these
concentrations occurred, in one case up to 80 psf. Higher
concentrations were observed on some of the canopies and
lean-to roofs. Measurements were not made on the arch proper of
the arch hangar roofs. Thus the loads given in Table III for
the arch hangar roof are for the flat wings at the base of
the arch. The loads observed here were naturally high because
of the shelter provided by the arch proper. At one a Station,
however, a few measurements were made on the arch itself. These indicated that the crown of the arch was usually bare and that the depth of snow increased towards the base of the arch (Fig. 29).
7.
GENERAL DISCUSSIONObservations made during the first two winters of the snow load survey have shown that the weight of snow
accumulating on any given roof surface depends on many factors. These can be roughly divided into two groups, although in some cases there is much interaction and interdependence between
factors. First, there are the meteorological factors that
apply to all roofs, are the same in any particular area, and
over which the designer has no control. The other group, the
"roof" factors, applies to one roof only in a particular area and is to a large extent under the control of the designer.
(a) Meteorological Factors
(i) Precipitation.- Obviously, the amount of annual snow-fall determines the amount of snow available for
accwnulation. It is to be assumed that with all other
factors the same the snow loads on roofs in different
areas would be proportional to the snowfall. Rain
falling into a snow accumulation on a roof will always increase the load although if the fall is sufficient it will ultimately decrease the load.
9
-(i1) Wind.- (Jf the many facets of the wind's character,
tEre"e are prominent in determining its influence on
snow accumulations. Speed is paramount, for it is
the speed of the wind that determines the amount of
energy available fox snow transfer. It also plays a
part in determining the amount of turbulence which in
turn affects the formation of concentrations. Second,
the direction of the wind has considerable influence and is closely tied to the orientation of the roof
thus making each roof a case in itself. And third,
the duration of the wind or, expressed in another way, the per cent calm has an"influence on snow
accumulation as was demonstrated at Inuvik. These
three factors are only part of the story, however, because the influence of the wind is primarily depen-dent on roof factors such as shelter and roof shape.
(iii) Temperature.- The effect of temperature on snow
accumulations is quite variable. If the temperature
is sufficiently high the load will naturally be
decreased by melting. In some cases the temperature
can also contribute to a decrease if it is continually
low. For example, on a ventilated roof in an area
where the temperature remains well below freezing for most of the Winter, no melting will occur on the roof with the result that the snow does not become bonded to the roof as would be the case ·if the snow next to
the roof melted and refroze. This lack of bond allows
the snow to be easily blovm off the roof. Such was
the case of the flat roof at Fort Churchill. On the
other hand, the temperature can also act to retain
the snow on the roof. In this case the temperature
rises above freezing long enough to melt the upper layer of snow and then drops below freezing again. A crust is thus formed over the snow layer and the
effect of the wind is greatly reduced. A similar
crust can be formed by freezing rain. Frequent brief
rises of temperature above freezing can also reduce the effect of the wind by increasing the density of the snow.
(iv) Solar radiation. - The effects of sunehi.ne are not as obvious as those of wind and temperature but they are
nevertheless significant. There is the effect of
sublimation. The influence of the sun is particularly
apparent when the snow layer is not deep and when
parts of the dark roof surface show through. Similarly
when the layer is thin a difference can be seen in the accumulations on. the north and the south roof slopes.
10
-(b) Roof Factors
(i) Heat loss.- The effect of heat loss can be very
pronounced in some cases. The most outstanding
example during the 1958-59 winter occurred on one of
the pitched roofs observed at Glacier. Here, heat
loss through the roof was sufficient to keep the centre areas almost bare while the load on the eaves
rose to approximately 50 psf (Fig. 30). Heat loss
cannot always be relied upon to reduce the load, however, because of the possibility of the building remaining unoccupied thus unheated during the winter. Moreover, the trend to ventilated roofs and improved
insulation will also reduce the effect. In some
situa-tions heat loss will help maintain the load in the
same way as do brief rises of temperature above freezing. It will increase the density of the snow thus decreasing
the effect of the wind. Heat loss can also cause load
concentrations as was demonstrated at ste. Anne de Bellevue where 22 inches of ice formed at the eaves.
(ii)
Roof slope.- The present NBC recognizes roof slope asa factor which reduces the load on pitched roofs from
that which would occur on a flat roof. The reduction
is 100 per cent for slopes of 60° or more and zero per cent for slopes of 20° or less, reductions for intermediate slopes being determined by linear
inter-polation. Survey observations have not entirely
veri-fied this reduction, however, for a number of pitched roofs with slopes greater than 20° have been observed with loads exceeding those on flat roofs at the same
locations. Goose Bay and Gander had examples of this.
The lower limit of 20° is therefore in some doubt;
perhaps it should be 30° or more. There is also some
doubt about the linear relation between the limits, particularly when the roof is in a sheltered location. On such roofs the slope is usually effective in causing slide-off rather than amplifying wind action which
means that little reduction occurs until the slope is steep enough for slide-off to occur, rou6hly 45° or
more on non-metallic roof surfaces. Although the
excessively cohesive character of the snow at Glacier biases the example, the load on the Alpine Club house
roof demonstrates this point (Fig. 31). The slope of
the roof is 11 in 14 or roughly 38° and the ground
load was 190 psf. Therefore, by the present slope
reduction formula the design load would be calculated
to be 190 [1 - 0.0233(38-20)J
=
110 psf. The measured11
-to verify it, but 60° seems -to be a reasonable upper
limit. Although roof slope is generally considered
to reduce snow loads it is also the cause of some extreme concentrations as will be pointed out later. (iii) Orientation.- It is reasonable to expect that the
orientation of a roof to the direction of the
prevailing winds and maximum solar radiation should
have an effect on snow accumulations. Although
observations have shown this to be true in some
respects it is nevertheless very difficult to predict
the effect. At Fort Churchill, for example, three
identical corridors were observed, two of which were oriented in the same direction, and at right angles
to the third. The latter was oriented in the
cHrec-tion most conducive to snow removal by the wind and
as would be expected a small load, 8 psf, resulted.
On the other two roofs where large loads would be expected one had a maximum of 70 psf but the other had only 20 psf.
Another comparison of identical roofs oriented at right angles to each other is allowed by the two
gable roofs observed at Ottawa.' In this case little
difference was noted between the average loads although the locations of the concentrations were different,
one at the eaves the other at the ridge. Some effect
of orientation on solar radiation was also noticed here.
(iv) Shelter.- As mentioned previously, survey observations have shown that shelter, and by this is meant shelter of the roof as a whole, greatly influences snow
accumulations. The Alpine Club house at Glacier is
the outstanding example where, completely sheltered, the average roof load was only 10 per cent less than
the ground load. Similarly the roof at Fairhaven Way
in Ottawa (Fig. 12) and the previously mentioned roof
in Montreal demonstrated the effect of shelter.
The effects of shelter are not entirely predic-table, however, as was shown by a gable roof observed
at Winnipeg. Here, a large central building is
flanked by two lower gable roofed wings which are
each divided by a 、ッセョ・イN Although one would expect
the area nearest the central section to be more
sheltered than the outer areas and thus to accumulate the largest loads, such was not the case for one wing
(v)
12
-where the outer area had the heaviest load. As is
the case with heat loss, shelter is not a constant
factor. When a building is planned, its site might
be totally unsheltered, giving small loads. During
the life of the building, however, much shelter could develop and produce lU1expected high loadings.
Roof size
fi
shape and projections.- A comparison ofsome
of
t e C-Station roofs with smaller A-Stationroofs in the same districts indicates that the size (i.e. area) of the roof has some effect on the depth
of snow accumulated on it. Some C-Station roofs had
less snow than A-Station roofs (ottawa for example) and although this can be partly attributed to the difference in exposure it is also the result of the
difference in size. Areas of localized shelter cover
a larger portion of small roofs than large roofs with the result that wind is less effective on small roofs. The size of roof also plays a part in the formation of concentrations on lower roofs because the amount of snow available for transfer is proportional to the area of the higher roof.
The shape of a roof plays a very definite part in determining both the over-all snow accwnulation on the roof and the concentrated accumulations, though the former is more influenced by the shelter
conditions of the roof as a whole. Concentrations
were observed to occur primarily in areas of localized shelter which were the result of the shape of the
roof. Compare, for example, a flat roof without
para-pets with one which has parapara-pets. On the first there
are no areas of localized shelter thus no
concentra-tions, whereas on the second, the parapet wall creates
sheltered areas w}lere concentrations occur. Invariably
the central areas of the roof with parapets accumulated
little snow. This was generally true of most large
flat roofs. Other frequently observed concentrations
were found on the lower level of split-level roofs (Figs. 32 and 33), on canopies and lean-to roofs
(Figs.
34
and35)
and generally on any surface thatis sheltered at a lower level than the main roof
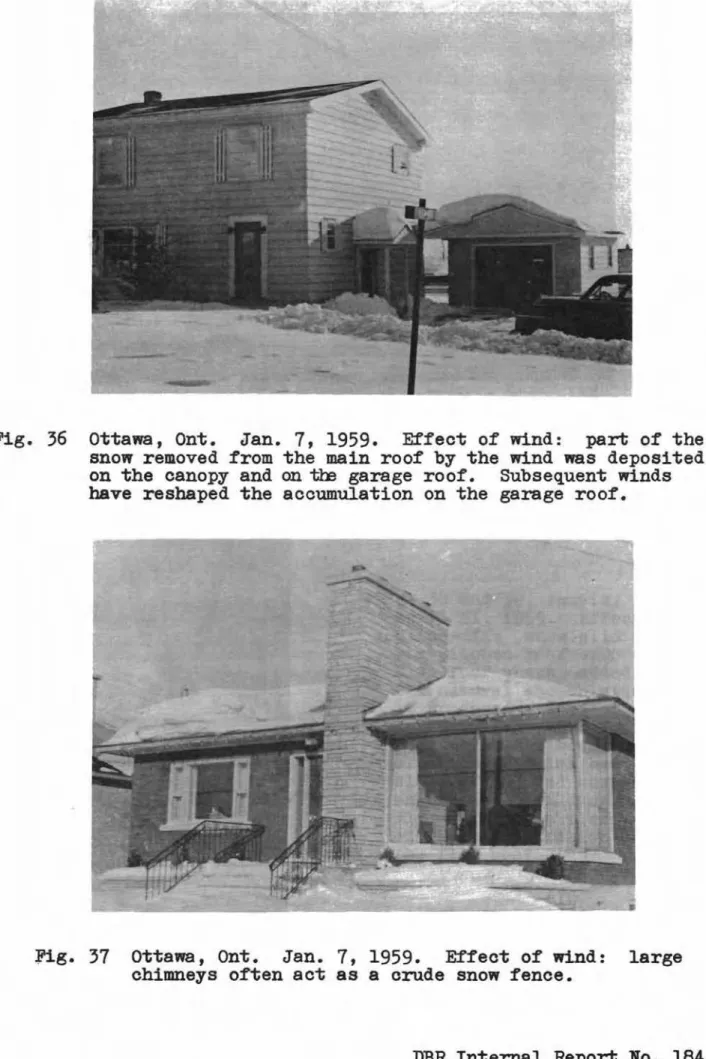
surface. More subtle examples of localized sheltering
are to be found on simple pitched and arch-shaped roofs where one side of the roof creates shelter for
the other (Fig.
36).
One such example was reportedwhere snow had accumulated to a depth of
4
ft at the13
-Concentrati.ons have also been caused by factors
other than the actual shape of the roof. JJar!":e
chimneys, :for example, have been observed to act as crude snow-fences and produce sizeable concentrations,
even on flat roofs (Fig.
37).
Snow sliding off ahigher roof onto a lower adjacent roof to produce a concentration was reported from two places during the
1958-59 winter. At Inuvik, snow lying on an alumimJffi
shingled gable roof slid onto an adjacent flat roof and created a snow load of approximately 70 psf (Figs.
38 and 39). The other case occurred on the roof of
a community centre in southern Ontario where, besides concentrating snow on the lower roof, the sliding snow sheared off a chimney on the higher roof. 8. FURTHER POINTS
(a) Accumulating from Above-normal Snowfall
In DBR Report 163 it was suggested that observations made during winters of above normal snowfall might lead to different conclusions than those made from observing
winters of below normal snowfall. This was not apparent
from the observations of the 1958-59 winter, however, and certainly its snowfall was above normal in many
parts of the country. Naturally the magnitudes of the
loads were greater, particularly on sheltered roofs, but little difference was observed in the distribution and
shape of the load. This seems reasonable if one is
correct in assuming that above normal snowfall is primarily the result of an increased number of snow storms rather than an increased snowfall from each of
an average number of storms. If each storm is of equal
intensity, then the wind and other factors are equally
effective in removing the snow. On the other hand it
is also logical to assume that one extremely large storm would produce accumulations of a different character, notably more uniform loadings.
(b) Snow Density
In determining the loads observed at B Stations it
was necessary to estimate the density of the snow. In
the past, including the NBC (1953), a density of
0.2 gm/cc was assumed regardless of the age of the snow. Snow density, however, does not remain constant
through-out the winter. A graph of density against time, which
was plotted for the snow on the roofs of all A Stations, indicated that the ,mean density increased from 0.15 gm/cc
14
-on 1 December to 0.35 gm/cc -on 31 March. The scatter
of the points was 0.05 grn/cc. On the basis of thts
plot the following densities were used for determining B-Station loads and are recommended when the density has not been measured.
From To Densiエセイ
1 December 15 January 0.20 gm/cc
16 January 15 Pebr-uary 0.25 gm/cc
16 Pebruary 31 March 0.30 gm/cc
(c) Snow Loads in the Mountains
Besides providing general information about snow loads on roofs, the A Station at Glacier also yielded a great deal of information on snow loads in the
mountains. This subject was discussed in detail in
DBR Internal Report 162 ("Snow Load s in the Mountains" by C. J. Turkstra) in which an attempt was made to
relate snow loads to elevation. On the basis of many
years of ground depth measurements linear elevation-load relationships were arrived at for each climatic
zone of the mountainous area. Loads determined from
these relationships were then increased by a factor of
1.4 to arrive at a basic design load. A comparison of
the load thus determined for Glacier and that occur-r.i.ng
during 1958-59 is worthwhile. According to Rep0r-t. 162
the basic design snow load for Glacier is 260 psf and as already noted, a maximum of 160 psf on a roof and
190 psf on the ground occurred in 1958-59. Thus the
predicted load for Glacier seems reasonable, though somewhat conservative in view of the fact that the 1958-59 snowfall was 35 per cent above normal.
9.
PRELIMINARY CONCLUSIONSAfter two years of full survey observations the general
conclusions and the form of a future snow load s pe cLf Lca't Lon
suggested in DBR Internal Report 163 are still valid. Summarized, these conclusions are:
(i) The average snow load on a roof is less than the load on the surrounding ground
15
-(ii) The amount by which the roof and ground load varies
is as yet unpr-edLc'tabLe but is primarily determined
by the shelter of the roof
(iii) Concentrations greater than the ground load are to be expected on roofs in any area of localized shelter. The locations of these areas are generally predic-table but the magnitude of the load they will accumu-late is not predictable as yet.
On the basis of these conclusions a logical form for
a future snow load specification might "be:
(i) A basic uniform snow load which varies according to geographical location and applies to all roofs with
less thBn extremely sheltered conditions. This load
would allow for the possibility of rain falling into the snow layer and might be less than the load speci-fied in the NBC (1953).
(ii) A factor for increasing the basic uniform load when
extremely sheltered conditions ・セエN The basic load
increased by this factor might approach the present NBC load.
(iii) Concentrations to be superimposed on the basic uniform load where they may occur as the result of roof levels, orientation, shape, etc.
(iv) In lieu of the above, the designer might, if he wishes, use simply a uniformly distributed design
snow load. This load would be rather conservative
since the intention would be to cover the possi-bilities of rain falling into the snow layer, local drifts and all sheltered conditions simply by a
uniformly distributed load. This load m:isht be
roughly equal to the present IillC load.
Although the above points have become much clearer after two years of full survey observations, they are not yet
supported by sufficient evidence to allow their implementation at the present time.
ACKNOWLEDGEMENTS
The Division of Building Research wishes to express its appreciation to all those observers who made the survey of the 1958-59 winter possible and successful.
16
-In particular, thanks go to the many building inspectors, private companies and others who made B-Station observations and also to the RCAF personnel at the C St8tions and their organizers in ottawa, Messrs. M. Huepeden and
J. Stark. Grateful appreciation also goes to A-Station
observers of the Meteorological Branch of the Department of Transport at Goose Bay and Gander, the Dept. of National De£ence at Fort Churchill, the Dept. of Northern Affairs and National Resources at Inuvik, the Ecole Polytechnique at
Montreal, Macdonald College at Ste. Anne de Bellevue, Queen's University at Kingston, the University of Toronto, the
University of Manitoba at Winnipeg, and the University of
Alberta at Edmonton. The authors also wish to express their
appreciation to the staff of the Division of Building Research in Vancouver, Glacier, Saskatoon, Ottawa, and Halifax.
3 [3 1 8 4 2 3 1 6 6 17 7 17 26 40 s OHSYIG[セ 21 69 8 160 72 175 29 45 セBQM[MXx • o「ウヲョZvHセ」Q nOaI (psf ) o o 1 4 1 8 2 o 9 21 5 5 8 14 22 160 16 13 6 3 3 6 4 155 66 [l;la x . Av. Roof (psf) 8 8 8 43 70 13 13 6 6 6 6 25 23 31 31 31 31 31 9 9 37 47 212 190 178 !'lax. tcv , Ground (psf) 35 30 35 35 30 30 30 35 35 55 55 55 25 35 45 55 NBC (ps:f) ----j--- - - - -e----. insulated insulated insulated insulated Heated, Heated, Heated, Heated,
Gable: Exposed, heated, insulated 30 Gable: Sheltered, heated,
insulated 30 Flat: Rot heRted
Gable (Offioe): Not insulated, heated
Gable: Sheltered, not heated, not ゥョウオセ。エ・、
Gable: Gable: Flat: Flat:
Gable: Heated, insulated Flat: Heated, insulated
Gable: Not heated 25
Flat: Heated, insulated 25
Gable: Heated, insulated Plat: Heated, insulated Flat (Corridors): Heated,
insulated
Gable: Heated, insulated Flat: Heated, insulated Gable: Heated, insulated Flat: Heated, insulated Edmonton, Alta
Glacier, B. C.
Kingst on, Ont. Inuvik, N.W.T. Saskatoon, Sosk. Fort Churchill, Man. Toronto, Onto Ylinnipeg, Man. _ _ Stotion__
ヲMセセ⦅ョHャoヲ
_
VanC01)\-er, B.C. Gable: Heated, nr-t Lnau Lat cd 1:'1at: Heated , in'3111atod Flat: Heated, insulated
ottawa, Onto
Ste. Anne de Bellevue, P.Q.
Gable: Heated, insulated &able: Heated, insulated Plat (Ho parapet): Heated,
insulated Flat (Parapet): Heated,
insulated Flat (Raised section): Heated,
insulated
Flat: Heated, insulated Gable: Heated, insulated
45 45 50 50 50 50 35 45 45 44 44 52 42 43 8 12 21 29 32 5 7 22 20 33 44 59 18 75 Eontreal, P.Q. Halifax, N. S. Gander, Hfld.
Goose Bay , Lab ,
Flat: Heated, inSUlated, in lee of hieher roofs Flat: Heated, not insulated Gable: Heated, insulated
Gable: Heated, not insulated Flat: h・。セ・、L insulated Flat: Heabe d , Lnsu.Lat od
Gable: Not heated, insulated Plat: Not heated, insulated
Gable: Heated, insulated Flat: Heated, insulated
50 50 45 35 40 40 40 45 75 90 23 22 45 18 12 12 30 32 84 71 27 8 8 4 15 4 5 1 10 5 72 14 18 6 20 23 8 5 20 8
TARI'!-; I [
---SND'I! WADS FORB STATIONS
r;iajor Influences Ground Roof NBO Drifts Loada in Ib/ft 2 'C <j"" Ol "..., '0'" "r< ...,::< Ol Ul " Q :r:H Type of !ioof Location Kitimat, B.O. Victoria, B. C. Da.vs on Creek, B.C. Kam'Loops , B.C. Penticton, B.O. Trail, B.C. Nelson, B.C. Ki",berley. B.O. セ。ャァ。イケL A.lta Lethbridge, Alta Yorkton, Sask. Kenora, Onto Fort Frances, ant.
Fort セゥャャゥ。ュL Onto I'Nawa, Onto Sarnia, Onto London, Onto Oril11a, ant. Pembroke, Onto OshaIVa, Onto Peterborouch, Onto Belleville, Onto Lachine, P.Q. Montreal, P.Q. Trois rゥカゥセイ・XL P.Q. Fredericton, N.B. Saint ,John, N.B. Moncton, N.3. Amherst, N.3. Flat Flat Flat Flat Gable Flat Flat Gable Flat Gable Lean-to Flat Other Flat Flat Flat Flat Flat Flat Flat Flat Lean-to All Gable Gable Flat Flat Flat All Flat Gable Flat Hip Flat Gable Flat Flat Flat Flat Flat Gable Gable Flat Flat Flat Flat x X x X X X X x x x x X X X X x x x x x X x X X x x x x x x x x x x x X x x x x x x x X X x x x x x x x x x 60 30 40 40 40 40 70 40(70)* 25 25 25 25 25 35 40 45 45 45 45 55 40(60) 40(60) 30 30 30 40 70 35 35 40(60) 50 50 50 50 60 60 65 65 50 60 55 75 4 25 5 5 11 37 20 20 20 13 13 13 10 35 30 30 30 30 20 65 65 '7 8 10 5 40 11 14 50 13 33 22 23 70 70 24 22 10 11 11 40 3 20 5 5 11 25 22 19 15 40 6 9 7 14 5 14 13 13 20 7 5 40 20 '7 6 8 5 20 30 o 10 12 33 4 8 12 3 23 23 20 13 10 12 2 5 20 8 IJ 33 25 15 10 75 16 14 18 25 20 40 36 7 10 27 5 22 75 10 12 47 60 45 50 85 40 20 25 30 2 Parapets No drifts, 37° slope Parapet Upper deck Lower deck 2' Parapet 2' 4" Parapets Sheltered hut 34° sheltered 34° exposed No parapets, sheltered One side of roof 6' snow at
10' projection Lean-to below hip roof Drifts at hip
No parapets Monitors; parapets Drifts at parapets Large roof, drifts
at parapets
Gables - 10 Ib/ft 2 Parapets
No snowstorms
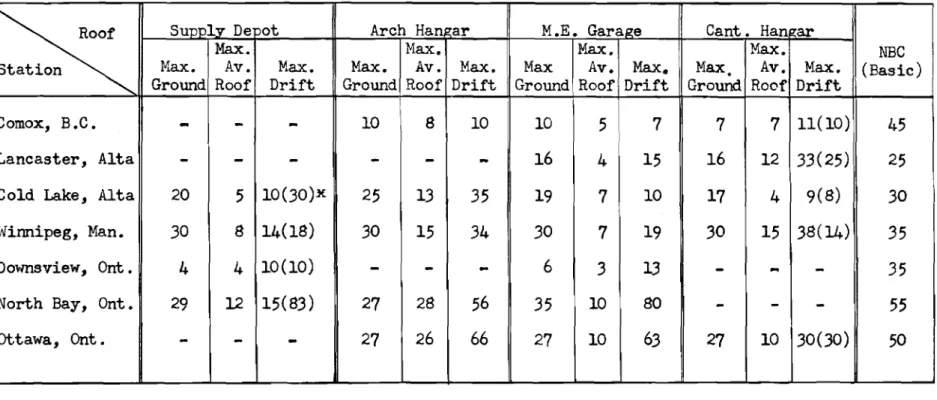
TABLE III
SNOW LOADS FOR C STATIONS (in psf)
セ
Supply DeDot Arch Han:rar M.E. Gara/2:e Cant. Han 2'arMax. Max. Max. Max. NBC
Station Max. Av. Max. Max. Av. Max. Max Av. Max. Max. Av. Hax. (Basic)
Ground Roof Drift Ground Roof Drift Ground Roof Drift Ground Roof Drift
Comox, B.C.
-
-
-
10 8 10 I 10 5 7 7 7 11(10) 45Lancaster, Alta
-
-
-
-
-
-
16 4 15 16 12 33(25) 25Cold Lake, Alta 20 5 10(30)x 25 13 35 19 7 10 17 4 9(8) 30
Ivirmipeg, Man. 30 8 14(18) 30 15 34 30 7 19 30 15 38(14) 35
Dovnevfew, Ont • 4 4 10(10)
-
-
-
6 3 13-
-
-
35North Bay, Onto 29 12 15(83) 27 28 56 35 10 80
-
-
-
55attawa, Ont.
-
-
-
27 26 66 27 10 63 27 10 30(30) 50Note: - indicates roof not available.
No C STATIONS 16 COMOX 17 LANCASTER 18 COLD LAKE 19 WINNIPEG 20 DOWNSVIEW 21 NORTH BAY 22 OTTAWA No A STATIONS I VANCOUVER 2 GLACIER 3 INUVIK 4 EDMONTON 5 SASKATOON 6 WINNIPEG 7 FORT CHURCHILL 8 TORONTO 9 KINGSTON 10 OTTAWA II STE ANNE DE 8ELLEVUE 12 MONTREAL 13 HALIFAX 14 GANDER 15 GOOSE BAY
/J
/3-A'"
( I \ <, .F<, / ... I --I '- .../
I
' y -セO I 7-AセャL
31:J
18.-·C {')J
f\
17-C 4-A I :IE 2-A) ,P
- A' . . \ ;!
<,,,_ -I /':a.C5-A , •....(... ; j セA"-...,
. i
セ!
-··--.Lg-C
6-A I ...-
....LOADS
INLB,/SQ.
FT. LEGEND ROOF 4-0- - GROUNDlozZセ
U
:J/AD
15 10 5FIGURE I A 8 C STATION LOCATIONS AND THEIR MAXIMUM AVERAGE ROOF 8 GROUND LOADS
No B STATIONS I KITIMAT 2 VICTORIA 3 DAWSON CREEK 4 KAMLOOPS 5 PENTICTON 6 TRAIL 7 NELSON a KIMBERLEY 9 CALGARY '0 LETHBRIDGE II YORKTON 12 I KENORA 13 FORT FRANCES 14 FORT WILLIAM 15 WAWA 16 SARNIA 17 LONDON 18 ORILLIA 19 OSHAWA 20 PETERBOROUGH 21 BELLEVILLE 22 LACHINE
I
23 MONTREAL 24 TROIS RIVIERES 25 FREDERICTON 26 SAINT JOHN 27 MONCTON 28 AMHERST '\'..,
\. '1C,..:
. セ| .>/...
Lセ
l.\.. ... '--.1 セ \ (-ェヲセ
[p
Mセエスエヲ
e!
" I i セ I l"
,\
l,'-'..J
-'-r-; /-"
/ , / .: / -3E,/r--· __
11 Jr--·
3 ;!
/ J' I セN.J
Jll} /
!
5._6$
8セ
3f
J IQMMセGMio
i
*
iセ
--- i
- - - _llJ
12 - - _ '0,"",< 13 ,/ / LOADS IN LB./SQ. fT.FIGURE 2 B STATION LOCATIONS AND THEIR
MAXIMUM MINIMUM LOAD ON AVERAGE MAIN ROOF MAXIMUM ON CANOPY OR LEAN-TO ROOF ETC. ....
---,
"
"
,
"GROUND LOAD NUMBER INDICATES GAUGE LOCATION OF MAXIMUM Cl <to
...J -TIME (DAYS),
MAXIMUM ATQセR
B,C, RESEARCH COUNCIL ROOF DESCRIPTION!'-
MINIMUM AT 9 Gセ / 0 A. B.C, RESEARCH COUNCIL セ 80 90'·1 /
r----• I ·4 7· 60-
.2 • 5 8 • .-,..f--N..
H·32' '3 '6 9' 40-=J
srsreoセ
BIOLOGY BUILDING INSULA reo
UNSHeLTeReD ND PARAPer 20 MAXIMUM AT 4,6,69 BIOLOGY BUILDING ,. 45' N
セ
MINIMUM AT 2 ·1 l-lL 0 loo.. I'4 To Mセ BOtj
• I 0 H' 30' cl 0 [H'36'1 'II) ..J '2 ·5 8' on 60)I"
I '330' 1'6 9· I 40 HeAreDINSULA reo (POORLY}
HUT M-2 UNSHELTeReD 2' PARAPer 20 HUT M-2 0
k
A... .. .
3 4 7 8 セ""
"0 '"NOVEMBER DECEMBER JANUARY FEBRUARY MARCH ' - -
.
I 2.. .
5 60 50 z :r セ a: >-;l; ..J セ 0 0
...
25\(
...
I.
.1
x Q. 24' <t VI ./ '\ ;l; '2 0 UGUセ I +50 --t
セ --
"2...
- -セ.
0 Q. --;l; 0 HeAreD, UNINSULArEO. VeNT/LArED
z
...
SeMI- SHeLTeReD <t I- --...
- -::IE - -40 NORMAL 1958/59...
--
SNOWFALL 28-8' o Z セ -V I I - -ll:VIFIGURE
3 :> Z - -0:> -I f / )-SNOW LOAD OBSERVATIONS ON ROOFS
YEAR: 1958/59ROOF DESCRIPTION
QTPセB
ALPINE CLUB LODGE
SHELTERED NOT HEATED ALPINE CLUB LODGE
01 50 oe 60 in '" 04 2 0 03 I ·
,,1/
IiI
/
ol-.L'---+---+---+---t---i--r-I
180 L - - - J . - - - + " - - - j - _ 160 L I t -o z . - J: セ。[ >-::1: --' - 0 <!w Ow x l l . <!(/) ::I:NOVEMBER DECEMBER JANUARY FEBRUARY MARCH APRIL
SNOWFALL NORMAL 342" 1958/59 464" >---'u. :;;: 0 Oil. z::l: <!w wI-:;; u, w oセ (/)J: Q:;(/) ; : ) z 0;:) J:(/)
FIGURE
4(0)SNOW LOAD OBSERVATIONS ON ROOFS
YEAR: 1958/59_ _ _ .... ...,.,.,...t \... _ _ _,..,_·...セMBMᄋNBB ..
1\ ROOF OESCR IPT ION
I 200
1\
I \"
\ V \ 180 \ \ POWDER HOUSE POWDER HOUSE \ Gセ / I -,».
1 -, 160 I I - \ I \r
/ ... I \ • I • 4 • 7 / "-, 1 \ 140 I /"
\ I '\ -I \ / -'!! • 2 • 5 • a I 3 N 120 ,-1\
セ ,-u, /'|セ
i"- 1セW
(/') //
• 3 • 6 · 9 C _oJ < 100 /-,
I.
.1
0 25' ..J //:
t7/
セ
,
1V-I I 80 I
セG
ry
a I I j 2· /1 /, 60 "\
]
J/
Oセ 40 ir
e-:
20I
NOT HEATED 0,
NOVEMBER DECEMBER JANUARY FEBRUARY MARCH APRIL MAY FIGURE 4 (b)
SNOW LOAD OBSERVATIONS ON ROOFS YEAR: 1958/59
I ROOF DESCRIPTION I 180 / I OFFICE I1 1 OFFICE I 160 I N 1
-t-,,--
-
... "...
... 1 / .... 1 / ....'1 140 " I{
., セN I 02 4 • I I • G 6 • ... 120 ... • 5 7 . " 29' " , " " N ,-.-: / 100. / u, セI
I ::IE I I 0 12 C/) D: IL 0,
IL 8·rO
<! I 0 I ! セ D: -.l 80 . !:iIL I I w 0 I ::IE w,.
,IWセ
;J D: .- o rz .-.- z W I '" 0 EXPOSED 60'if
t/
HEATED ILGセ
7 8V
SNOW REMOVED 1 NOT INSULATED I ! FROM ROOF.r>:
VEAVES 40fi
セ
Oセ
セ
l\
20J
!
セ
" - - / CENTRE OFrooセ
I'... セセMMMMセセ
セ
セI
NOVEMBER DECEMBER JANUARY
I
FEBRUARY MARCH APRILI
0 z . _:I: =:0.: >- セ セ 0 <! w Ow .n. x C/) < :2: • \ e >-! セANjNNN " <to s Oil. 1956/59 ! zセ NORMAL ! <t W SNOWFALL 342" 464 " : wI-, セI
i
u, W , 0 2 ! C/):I: FIGURE4
(c)I
ccUl : J ZI
O : J x C / )SNOW LOAD OBSERVATIONS ON ROOFS YEAR: 1958/59
ROOF DESCRIPTION
-I
- ' r - - - " " 80 E-"3 SCHOOL /' I \ I \ -, 60 12 42' セ I I" ---j セ E-3 SCHOOL I 6 P -, ./"
OJ
.6 4.1
I ,, 5 " l ,·
....".... 18' 40·
セ
",--- - , I 2N
• I 3· '" ,,"セ
ALL MAXIMAI-IY
AT #2 (SHELTERED u, HEATED INSULATED) セ 20 セセ --, 0-;0
k:
<;'r-JセH
I <l: E- "3 RESIDENCE'"
° セM セ ..J セ 12 0 <,"
GV
I.. 36'_ _ ' 60UJ
• 6 4 •t
5·
E - 3 RESIDENCE·
18'セ
OMMMセ 2 40 ,--
-
...- ·1 3· I',
...-\
...
(EXPOSED HEATED INSULATED 4")/ ',
... ...
/ /->
-.
20 /;---...セ
セNNNM...!
セセ
ALL MAXIMA AT #2 5セ
5 6 _I-" QJANUARY FEBRUARY MARCH APRIL MAY
0 50 セZゥ セョZ :>-::l: ..J - 0 <l:w 25 Ow
iセ
セ
セ
.a-Xcnセ
<l: ::;: 0 +50 f - -:>- +32 f=..- - - -' - - - -- - - . = ::::!lL f- -1958/59 «.セ
NORMAL oa- f - -z::;: 0 f-セ
; - - - --- SNOWFALL 55" 41" <l:wセイ|aイai
-lJJ I -;:;: II\,
-42 -lL W 12セOヲiャセイ
ャセセセ
セ
-° z f-セaNエiセ|
-(f);c f-ゥセ
- FIGURE5
c:: cnAM
::::> z f - -0::::> f -A -I cn 0SNOW LOAD OBSERVATIONS ON ROOFS YEAR: 1958/59
!
ROOF DESCRIPTION ! (, ! セ -v I ,, , , セI
ADMINISTRATION BLDG. N I \セ
iI
I. I l___セLJ;I
I VPセ II
I
" II •4- 7 • I,
, 40' セ ·2 • 5 fJ·I
ADMINISTRATION BLDG. N • 3.
(, セ.
f- ' -u, セ Ii 0 20 lI=t>A < 0 セM I ...J '"ヲdGセG
セ ,--- - MMMセ eXPOSEO 0--
< : » > ./'0. HeATeO f---60i INSULA TeOI
I
40, _1- SE.CTION.
A.-A'I M!NING STORE SHED
I
2J
!
1 MINING STORE SHED
I
I
I , N \ , I ,' 22セ ru",
01
I ,,--- - MMMMMセ¢'
I .·1
!..
セMMMBL ...セ I ! セ I セMMNMM 17Sf
I •4'5b
2·6"
セ ,I
i セイ 3' '7I
i
I ( SHELTEReO, UNHeATEO BLOG.-1_ 4· J '8 ..-1, セ NOVEMBER DECEMBER JANUARY FEBRUARY MARCH
I 0 401 I N I ti I z:=
wt
E WINDO;Ri:7
セッZ I,
(\
セ
セ ^[セ セ (, ="0n
セ セキ 20 \ C:u.;IIrJ'vV
W
|Iijセ
セ
セ .n..AGiセ
[, セ c/).
.d: , セ 0 1 +50 f- -I >-; -l-32 セMMセflY:!
- - - -セMM
f- - - . = ! セllNNセMMMMMMM
l:TA
n -\ <:;:0 セ on.. -セ -セ 0 - - - V v'-'V
---
- - - NORMAL 1958/59 f - -! ::.: i-- - SNOWFALL 51'0" 43'9 " セ -42; - -, 12l
セセM w-セ
-I
3 Uz i-VVJ"
セセm|AQ
A1AJMJ
-enI FIGURE 6 c:vi i - - , セ ; =>z f --!
! 0:::> f - -::: 01 0 - ,SNOW LOAD OBSERVATIONS ON ROOFS YEAR; 1958/59
LOCATION: EDMONTON, ALTA.
80 ROOF DESCRIPTION 20 iMMMMMMMMMMMエMMMMMMMMMMjセMMMMMMM⦅ャ⦅⦅MMMMMK⦅セMMMM⦅⦅⦅N - --- --- --l----'---I VᄚセャMMM
----314 LAKE CRESCENT 4 0 1 - - - + - - - - ---+---t- -314 LAKE CRESCENT '21:::N
+5032 1- _ セ _ _-, -= -セ_ LL+ I -i]MMMMMセMMMM MMMMセ -_ goa.z::i: O f - - - -I - - - - -M- ---- ---
_ «W I- _ セiM '-- -40 - 1958/59 3111 NORMAL 36"FIGURE 7
38' I' MMMMMセ.
, • 4 7 •]
.2 • 5 e • ·3 ·6 9· seedeセ hNセセセセセQェ ) セ MMセGMMMMMM OUTDOOR TEST,STATION N-t-
., .4 .7]
03
·2 .5 ·e ·3 .6 ·9I.
30.1
DETAIL A(EXPOSED, HEATED, INSULATED)
I 133 - 107!h ST. N
-t-'2-,
3-]
D
-24-3
-s.
• 6 e • セ]Ne[セ N_R_C- LAB(EXPOSED, HEATED, INSULATED) (EXPOSED, HEATED, INSULATED)
SNOWFALL -APRIL ...... ...
---
.... ....,---
..---
... MARCH---
----FEBRUARY / , , ; - - -... , ; -
-
--' JANUARY 11. A IAj 1 IA j I A ---rJ':- -,---
セ[N\M -_.. ----'---... -DECEMBER-OUTDOOR TEST STATION
-+ - -'.
dt---.:.---
'-N.R.C. LAB. 113-107 t h ST. 1 - - - ---+---+---t---l o o 10 lI - 51- I--o 40 20 e----.---l---t----+----i----. LL W o Z (f)I a:: (f) ::>z 0::> I ( f ) 0 40 20 0 40 20 0 50 0 z . _ I ;;:0.; )-::i: ::!o «w 25 Ow .a. セHヲI ::i: (II l-LL s-, o « o ..JSNOW LOAD OBSERVATIONS ON ROOFS
YEAR: 1958/59LOCATION: SASKATOON,
ROOF DESCRIPTION LIBRARY S. WING //// 12' ABOVE ROOF / L1BRARY-S WING 60 I
GjセB
セ
.9 • 4セセ
3 • .e ·5 2·セ
.7 .6 I . 77'-6"EXPOSED, INSULATED. NOT VENTILATED, UNHEATED AIR SPACE
1,---ALL MAXIMA AT'#7 ALL MINIMA ATCセ ""... ,,--- - - - __ --1- ... o 60 AGRICULrURAL ENG. BLDG. 401---+---+----+----+----, o セLGMMMMMMMM'"-
... / , MセMG ----ALL MA XIMA AT #1---..
--AGRICULTURAL ENG. BLDG. ,:'j"
I 46'NOVEMBER DECEMBER JANUARY FEBRUARY MARCH EXPOSED. ATTIC UNHEATED, VENTILATEDINSULATED
o
セ セZセセᄃMM|MMiMセMMMMMセセMMMMMM
セMMMMMカキ
セoァ[
0=---- __ __ __ _
=
セキ _ _wI-
_
::;; r- _ - 40I - NORMAL SNOWFALL 54"FIGURE
1958/59 85It8
SNOW LOAD OBSERVATIONS ON ROOFS
YEAR: 1958/59LOCATION: WI NNfPEG,
["<\
10IALL MAXIMA FOR
--I I
Q
セ
1#1- #9 ARE ZERO -" セMMLO \- i G-22. . .
ROOF DESCRIPTIONHEATED, INSULATED, VENTILATED
3 4 7 8
I V 32'
'.LJ]·[ii: ::
1
9 10
HEATED, INSULATED, NOT VENTILATED
I , >«25' I 6 9 25'>< ... \...
.
.
10 • • 2 -5 -6,--,
, ,---, 1__ - _ , ' \;
-
----I I-
-- ,---"---セセBカMMMMMMM
----40 G-22 20 -0 60 '"to- 40 セ F-2 0 <l: 0 -I 20 0 INOVEMBER DECEMBER JANUARY FEBRUARY MARCH APRIL MAY
セ . 80 _:I: :;=a.: >-:::E :..J <i'fil o UJ 40 -Q.. XV> <l: :E o NORMAL SNOWFALL (NOV_ - APRIL) 40 "
FIGURE 9
(0)1958/59 43 "
60 J-54
I •
ALL MINIMA AT 3 ROOF DESCRIPTION 401--- --- --- --- - --- - - --- ---Mセ ----MMMMMMMMiMMMMMセMM 20 -J-165 ...--.
I , -'---j 3 IDENTICAL ROOFS MセiI
WL-_J_:l
40e l -60 N f--u, セ o « o -J 20 - セN⦅M セ---
セ 0 4 -_... 40 E- 31(HEATED, INSULATED, VENTILATED)
4
---I -I , ,----,' 4 , ---'---- - - ALL MINIMA AT#3
---
-NOVEMBER DECEMBER JANUARY FEBRUARY MARCH
J-54 J-165 E -31 L.. W o セ in z: 0:: en ::J Z o ::J z: en iO -- 51I -oセ NORMAL 40" FIGURE 9 (b) 1958/59 43"
SNOW LOAD OBSERVATIONS ON ROOFS YEAR:
LOCATION:
1958/59
FORT CHURCHILL, MAN.
ROOF DESCRIPTION 60 II DOUGLAS CRES 40 (SHELTERED HEATED INSULATED) II DOUGL AS CRES. MMMMQMMMMMNNNLM|MMMMセイエMM 20 o「NNNM]BBBBMGセK⦅MM]セZNNNNNQZZN⦅K]⦅]セBB]]l 60 N I-U.
v-o <I o ..J 40 21 DOUGLAS CRES. JANUARY 1956/59 66" NORMAL SS· FIGURE 10 SHELTERED BLDG. HEATED ATTIC UNHEATED CEILING INSULATED SNOWFALL APRIL MARCH / ' FEBRUARY 5 - -_/."'--;,' ; ' \ 21 DOUGLAS CRES. DECEMBER o 20 o +50 >- +32 ..Ju. <i • 0 0 . Z セ 0 <fW wI-:=; -40 u. w 10 oセ (J):I: trVl セコ oセ :I:Vl o セ i セ a: >- :=; ..J - 0 <l W 20 Ow xa. <l Vl :=;SNOW LOAD OBSERVATIONS ON ROOFS YEAR: 1958/59
ROOF DESCRIPTION
26 EDGE Hill AVE
60 14 3.
-f
4.7. J31
8 · N I . "-j , セ N, 1958 - 59 91" II .7 ·5 ., EXPOSED INSULATEDATnC NOT VENriLATED ATriC NOT HEATED BLDG HEATED PARAPET 2'6"
T
·1..
7 . 36 .2 ·5 8 •1
H:. 40' ·3 ·6 9 ·iセ
87Liセ --..l FIGURE NORMAL SNOWFALL 57" SHELTERED ATriC NOT HEATED BLDG HEArED INSULATED MCNEil HOUSE APRIL ALL MAXIMA AT 1#, \ \ \ \ \ -,I>..-fl--t>",-I+ - - - -MARCH FEBRUARY JANUARY DECEMBER 5 0セZZNZZZZNZZZNZZNZNZZ]NZNNKNNNNZNZZZZNZNZZNZNNZNZNZNNZNMMイNNZNB]GZGGZGZGGZGG⦅KMBBGGGGイ...
- t - - - - I o セx セッNZ セR - 0 IMMMセMMMMMゥNMMMmMィh|hMmQヲMMィセKiャM|MヲャhQイQ|MMエMセセMMQ セ セ 25セ '0. セcOI セ 40 -4226 EDGE HILL AVE,
o +50 +32 21L <[a 0 0 . 2 セ 0 <[lI.I lI.If-::e IL UJ 12 Oz C / ) x It:C/) :::>z 0:::> :z: C/) a 20 M M M M セ M セ M M '" f-IL
c-.
0 <[ 0 ..J 40 MCNEil HOUSESNOW LOAD OBSERVATIONS ON ROOFS YEAR: 1958/59
LOCATION: KINGSTON, ONT.
_.
,
. 1958/59 to," ·1 ·r..
FAIRHAVEN NORMAL 82"12. /DAV IDSON CRES
NOT.' EXPOSFD
UNHEATEI) AIR SPAf."[
10 :.+' CEIL ING INSUI ArEO (4'1 HEATED 81DG 5' FLAT: /0' TO EAVES hセ 91 6 ' , 10 I ',. 17 '
'.
7' '8 I -!l' ,,, 12. I 15 ',-
13, 16 18,FIGURE 12
'10rrXPOSED, HEATED, INSULATED}
ROOF DESCRIPTION
(SHELTERED, HEATED,INSULATED)
"
YEAR: 1958/59
lOCAT rON: OTTAWA,ONT
12
LL{セ 40 aarkeセMNjャlvd 0'"
qZLZGャセG
n
(EXPOSfD. HFATED, I"'SUI.Ar'D 2")
,',
v
[/-7
72 B I Sf:!Q.':'..JiLYJJU"
I "EI-·"" 5BGSセZ
T. 17,
:i,l :'i .-?- - - . - . セ
! t .,
a-([)(POSFD. H/'ilTflJ, ''''"UIA7FD 2")
SNOWFALL I
GLセlj
....,
- \ -\ / -... ... --MセMMMMMMMM
40 BARKER BLVD.-l-/
7 - - - / 8 DAVIDSON CRES. I ALL MINIMA AT #1 DECEMBER o FAIRHAVEN WAY ALL maxiセa AT #14 o 72 BISHOP BLVD. ALLmiセima
AT"2 20 セM .---.-.-.----20iMMMMMMKMMMMMK⦅セ 40 o 40 o 40 20 40 1 1 -60 N セ セ1 o « a ...JSNOW LOAD OBSERVATIONS ON ROOFS
-40 II. W 10 O! 1IlJ: Q:;1Il ;;)Z 0;;) J: III 0 o エMMMGMKM]UPセMMMMMKMMMMMMKMMMMMKMMMMMKMMMMMMMMi )- +32 -'Ii. 4-Oll. セ セ 0エMMMMMMKMMャッカセCカ⦅⦅K⦅|K]MMM]MM⦅⦅]|i⦅|⦅i⦅セAM⦅vQヲMK⦅MMMM⦅⦅Q キセ ::I