HAL Id: hal-02356722
https://hal.archives-ouvertes.fr/hal-02356722v2
Submitted on 12 Dec 2019
HAL is a multi-disciplinary open access
archive for the deposit and dissemination of
sci-entific research documents, whether they are
pub-lished or not. The documents may come from
teaching and research institutions in France or
abroad, or from public or private research centers.
L’archive ouverte pluridisciplinaire HAL, est
destinée au dépôt et à la diffusion de documents
scientifiques de niveau recherche, publiés ou non,
émanant des établissements d’enseignement et de
recherche français ou étrangers, des laboratoires
publics ou privés.
Constrained Distance Based K-Means Clustering for
Satellite Image Time-Series
Thomas Lampert, Baptiste Lafabregue, Pierre Gançarski
To cite this version:
Thomas Lampert, Baptiste Lafabregue, Pierre Gançarski.
Constrained Distance Based
K-Means Clustering for Satellite Image Time-Series.
Proceedings of the IEEE International
Symposium on Geoscience and Remote Sensing, Jul 2019, Yokohama, Japan.
pp.2419-2422,
CONSTRAINED DISTANCE BASED K-MEANS CLUSTERING FOR SATELLITE IMAGE
TIME-SERIES
Thomas Lampert, Baptiste Lafabregue, Pierre Ganc¸arski
ICube, University of Strasbourg, France
{lampert,lafabregue,gancarski}@unistra.fr
ABSTRACT
The advent of high-resolution instruments for time-series sampling poses added complexity for the formal definition of thematic classes in the remote sensing domain—required by supervised methods—while unsupervised methods ignore expert knowledge and intuition. Constrained clustering is becoming an increasingly popular approach in data mining because it offers a solution to these problems, however, its ap-plication in remote sensing is relatively unknown. This article addresses this divide by adapting publicly available k-Means constrained clustering implementations to use the dynamic time warping (DTW) dissimilarity measure, which is thought to be more appropriate for time-series analysis. Adding con-straints to the clustering problem increases accuracy when compared to unconstrained clustering. The output of such algorithms are homogeneous in spatially defined regions.
Index Terms— Image time-series, constrained cluster-ing, semi-supervised clustercluster-ing, partition clustering.
1. INTRODUCTION
Remote sensing problems are characterised by large volumes of data and a lack of reference data. Time-series are becom-ing more readily available with the introduction of satellite constellations that can capture the same location with increas-ingly regular intervals. This opens up the possibility of moni-toring land use and its evolution. Nevertheless, reference data collection is complicated due to the complexity of thematic classes and their lack of formal specification. As such, unsu-pervised clustering is often used, offering a solution based on the data alone. Expert knowledge and intuition is ignored.
“Intuition” is defined as non-formalised knowledge that may be partial and imperfect. In general an expert has an objective and an intuition of what they are looking for. In a supervised setting it is necessary to express this intuition through examples that sufficiently represent each class and their variance. This is unrealistic in time series image analysis as the data is relatively new and, as such, an expert may only have a vague idea of the classes and their nature. Neverthe-less, the work presented herein allows them to improve upon
CNES and Unistra R&T research grant number 2016-033.
unsupervised clustering in applications that are still not for-malised (i.e. a lack of nomenclature and class descriptions).
Constrained clustering (alias semi-supervised clustering) is the process of introducing background knowledge (alias side information) to guide a clustering algorithm. Back-ground knowledge takes the form of constraints that supple-ment information derived from the data—through a distance metric—for a (generally small) subset of the data. A con-strained algorithm finds a solution that balances the informa-tion derived from both sources. They therefore relieve the burden of collecting vast amounts of reference data needed for supervised methods, which is not possible when dealing with big data and difficult when dealing with time-series.
k-Means based algorithms are simple to apply, intuitive to interpret, and are ubiquitous in remote sensing. This paper therefore focusses on k-Means based semi-supervised algo-rithms adapted to time-series. These approaches offer a new tool for remote sensing researchers that, to the best of our knowledge, has not been applied in the domain with respect to time-series data. Crop classification is taken as an example application although the techniques are general.
2. BACKGROUND
Due to the inherent complexity of clustering optimisation cri-teria, classic algorithms always find a local optimum. Sev-eral optima may exist, some of which may be closer to a user’s requirement. It is therefore important to integrate prior knowledge into the clustering process [1] through constraints. By far the most common are must-link (ML) and cannot-link (CL) constraints as they can be intuitively derived from user input without in-depth knowledge of the clustering process and feature space. More formally, an ML constraint between two instances oiand oj states that they must be in the same
cluster, ∀k ∈ {1, . . . , K}, oi ∈ Ck ⇔ oj ∈ Ck; a CL
con-straint on two instances oiand ojstates that they cannot be in
the same cluster: ∀k ∈ {1, . . . , K}, ¬(oi∈ Ck∧ oj∈ Ck).
2.1. Time-Series Clustering
Time-series increase the complexity of clustering due to the data’s properties. Almost all clustering algorithms use a norm
based distance function. This implies a fixed mapping be-tween points in two time-series and are therefore sensitive to noise and misalignment in time [2], etc. Dynamic time warping (DTW) [3] overcomes these by finding an optimal alignment between two time series by non-linearly warping them. k-Means algorithms calculate centroids during optimi-sation, which can be achieved using DTW barycenter aver-aging (DBA) [4]. As such, classical constrained clustering implementations require modification to use DTW and DBA before application to time-series.
2.2. Constrained Clustering
Constrained clustering algorithms broadly fall into six cate-gories: k-Means, Metric Learning, Spectral Graph Theory, Ensemble, Collaborative, and Declarative. An in-depth re-view of all appraoches is presented in [5]. This work focusses on k-Means approaches, including one example from collab-orative clustering, as they are ubiquitous in remote sensing.
In k-Means approaches, the clustering algorithm or the objective function is modified so that constraints guide the al-gorithm towards a more appropriate data partitioning. The extension is done either by enforcing pairwise constraints, e.g. COP-KMeans [6], or by using pairwise constraints to de-fine penalties in the objective function, e.g. CVQE [7] and LCVQE [8]. Each varies in its optimisation criterion and search strategy, for further detail the reader is referred to [9]. A limitation of COP-KMeans is that it does not guarantee convergence and will fail if a constraint is violated.
The ill-posed nature of the problem explains the abun-dance of clustering methods. Each clustering algorithm is bi-ased by its objective function and different methods, or the same algorithm with different parameters and initialisation, can produce very different results. Collaborative clustering considers this variance as complementary, and forces muilti-ple unconstrained clustering algorithms (agents) to collabo-rate to reach an agreement by sharing information between them [10]. Herein 3 k-Means agents exchange information by performing split/merge/delete operations on clusters to reduce their clustering dissimilarity. Constraints guide the collabora-tive process (i.e. are not necessarily respected) by allowing the relevance of each operation to be measured.
3. EXPERIMENTS AND RESULTS
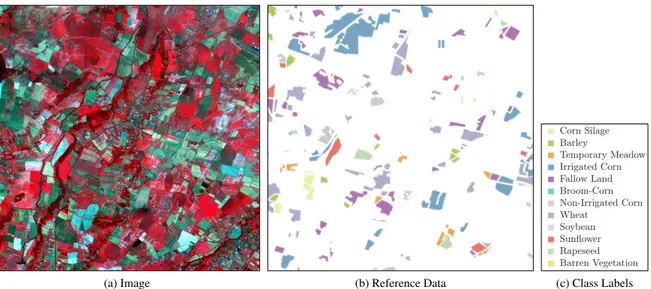
Satellite data offers observations with a high spectral, spatial, and temporal resolution and applications to crop monitoring, identification of agricultural practices, or estimation of yield and crop parameters are numerous [11,12,13]. A dataset that covers cultivated land characterised by mixed farming with a wide variety of irrigated and non-irrigated crops is used herein as an example application. The study area is located
near Toulouse (Southwest France). The dataset1represents 11 multispectral (green, red, and near-infrared) 1000×1000 pixel images non-uniformly sampled from 15/02/07–20/10/07 and captured by the Formosat-2 satellite. One of the images is presented in Fig.1a. A random subset of the images are taken (within annotated locations, see Fig.1b) such that the train-ing and test sets contain 1974 and 9869 pixel time-series re-spectively. The algorithms were evaluated using the test set. Constraints were generated from the training set by randomly sampling pairs and adding an ML or CL constraint depending upon their labels. Reference data is the farmer’s declaration to the EEA’s Common Agricultural Policy.
Ten random repetitions of the following constraint set car-dinalities were generated: 5%, 10%, 15%, and 50% of the training set cardinality N (a very small fraction of the number of possible constraints,12N [N − 1]). Samples are normalised to unit length. Performance is measured with the adjusted Rand index (ARI) and constraint satisfaction (Sat., the frac-tion of satisfied constraints) averaged over the repetifrac-tions.
3.1. Results
The results for the unconstrained and constrained experi-ments2 are presented in Table 1. The Euclidean distance
gives the highest unconstrained performance with two algo-rithms due to the relatively coherent nature of the data. The images are cloud free, meaning that the feature vectors are noise free. The problem also lends itself to the Euclidean dis-tance: the time-series are aligned in the time domain and the AOI is spatially coherent, i.e. crops grow and are harvested in the same time-frame over the image. If these assumptions are broken DTW may offer better performance. SAMARAHsees the largest increase in performance with constraints. Nev-ertheless, adding constraints does not always lead to better performance. Generally the most consistent improvements in ARI (irrespective of distance measure) are observed with SAMARAH, which does not guarantee constraint satisfaction. The constraint satisfaction of those that do (COP-KMeans and MIP-KMeans) improve when constraints are added. This is generally associated with a reduction in ARI as the algorithms struggle to resolve conflicts between the constraints and the distance measure, this explains why ARI improvements are observed with SAMARAHas it can violate constraints.
DTW and DBA’s complexity increases run time compared to Euclidean versions (COP-KMeans with 5% constraints: 19 vs. 1185 seconds). MIP-KMeans takes half the time (DTW with 5% constraints: 660 seconds) but results in lower ARI. SAMARAH and COP-KMeans are comparable (DTW with 5% constraints: 1185 and 1237 seconds respectively).
This poses challenges for big-data. Nevertheless, by clus-tering a subset of the data (as above), out-of-sample data
1Provided by the Centre d’ ´Etudes Spatiales de la Biosph`ere (CESBIO)
Unit´e Mixte de Recherche CNES-CNRS-IRD-UPS, Toulouse, France.
(a) Image (b) Reference Data (c) Class Labels
Fig. 1. An image from the time-series: 12 classes, and 11 time points (t4displayed here).
Table 1. Unconstrained and Constrained ARI and constraint satisfaction. The best performances for each measure, constraint fraction, and distance measure are highlighted in bold. Unconstrained satisfaction was measured using the 50% constraint sets.
Method Distance Unconstrained 5% 10% 15% 50% ARI Sat. ARI Sat. ARI Sat. ARI Sat. ARI Sat. COP-KMeans DTW 0.426 0.812 0.416 1.000 0.398 1.000 0.407 1.000 0.436 1.000 Euclidean 0.420 0.807 0.406 1.000 0.414 1.000 0.443 1.000 0.369 1.000 MIP-KMeans DTW 0.398 0.805 0.381 1.000 0.390 1.000 0.366 1.000 0.433 1.000 Euclidean 0.407 0.803 0.428 1.000 0.416 1.000 0.431 1.000 0.532 1.000 SAMARAH DTW 0.406 0.802 0.597 0.870 0.657 0.876 0.637 0.867 0.681 0.878 Euclidean 0.463 0.817 0.691 0.884 0.682 0.884 0.714 0.890 0.702 0.885
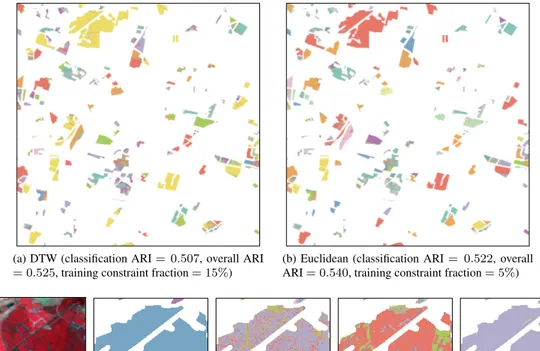
points can be classified using a less expensive method, a k-NN classifier for example. As such, all the labelled points in the image time-series (see Figure1b) are classified using the clusterings calculated above. SAMARAH is used as it achieves the highest performance. The result that represents the median ARI for both distances are taken as they represent a realistic result when using an arbitrary constraint set. These form training sets for a k-NN classifier, where k = 3. The re-sults are presented in Figure2. As expected when classifying unseen data, a reduction in ARI from the original clustering is observed, decreasing by 0.172 (0.154) DTW and 0.191 (0.173) Euclidean (figures in parentheses include the ‘train-ing’ clustering results). The clustering-classifications, how-ever, result in homogeneous regions without including spatial proximity information nor spatial smoothness constraints. Figures2e–2gconfirm this by focusing on one region of a classification trained on the highest ARI clusterings. The dis-tribution of classes within each region is measured (randomly distributed classes give 1/N , N is the number of classes, and homogeneously distributed classes give 1, these are summed over all regions and weighted by region size): COP-KMeans 0.602, MIP-KMeans 0.694, and SAMARAH0.802.
It should be noted that the reference data used is imper-fect, as is common in large scale remote sensing problems. Figures 2c and 2d reveal that although the reference data specifies one homogeneous region, the data does not—what appear to be paths and tracks cross the field. This complicates the clustering algorithm’s objective function and causes a conflict between the constraints and information derived from the distance measure. This is particularly disadvantageous for algorithms that satisfy all constraints (COP-KMeans, and MIP-KMeans), and could have contributed to the low ARI scores (pre-processing to remove conflicting constraints may correct this).
4. CONCLUSIONS
k-means based constrained time-series clustering for remote sensing has been explored. It has been shown that both Eu-clidean and DTW distance measures are effective, however, in this study Euclidean offered the best performance (and low-est run time). SAMARAHimproves upon COP-KMeans and unconstrained clustering with little user input.
(a) DTW (classification ARI = 0.507, overall ARI = 0.525, training constraint fraction = 15%)
(b) Euclidean (classification ARI = 0.522, overall ARI = 0.540, training constraint fraction = 5%)
(c) Image (d) Reference Data (e) COP-KMeans (f) MIP-KMeans (g) SAMARAH
Fig. 2. (a) and (b) SAMARAHout-of-sample classification; (c) and (d) a subset of the data highlighting the noise present in the reference data (see text); and (e)–(g) image classification using maximum ARI (DTW) clusterings.
References
[1] S. Anand et al., “The role of domain knowledge in data mining,” in CIKM, 1995, pp. 37–43.
[2] E. Keogh and S. Kasetty, “On the need for time se-ries data mining benchmarks: a survey and empirical demonstration,” Data Min Knowl Discov., vol. 7, no. 4, pp. 349–371, 2003.
[3] H. Sakoe and S. Chiba, “A dynamic programming ap-proach to continuous speech recognition,” in Interna-tional Congress on Acoustics, 1971, pp. 65–69.
[4] F. Petitjean et al., “A global averaging method for dy-namic time warping, with applications to clustering,” Pattern Recognit., vol. 44, no. 3, pp. 678–693, 2011.
[5] T. Lampert et al., “Constrained distance based clustering for time-series: A comparative and experimental study,” DMKDFD, vol. 32, no. 6, pp. 1663–1707, 2018.
[6] K. Wagstaff, C. Cardie, S. Rogers, and S. Schroedl, “Constrained k-means clustering with background knowledge,” in ICML, 2001, pp. 577–584.
[7] I. Davidson and S. Ravi, “Clustering with constraints:
Feasibility issues and the k-means algorithm,” in Proc SIAM Int Conf Data Min, 2005, pp. 138–149.
[8] D. Pelleg and D. Baras, “K-means with large and noisy constraint sets,” in ECML, 2007, pp. 674–682.
[9] I. Davidson and S. Basu, “A survey of clustering with instance level constraints,” ACM Trans Knowl Discov Data, vol. 77, no. 1, pp. 1–41, 2007.
[10] C. Wemmert, P. Ganc¸arski, and J. Korczak, “A collabo-rative approach to combine multiple learning methods,” Int. J. Artif. Intell. Tools, vol. 9, no. 1, pp. 59–78, 2000.
[11] R. Hadria et al., “Combined use of optical and radar satellite data for the detection of tillage and irrigation operations: Case study in central morocco,” Agric. Wa-ter Manag., vol. 96, no. 7, pp. 1120–1127, 2009.
[12] C. Marais Sicre, F. Baup, and R. Fieuzal, “Determina-tion of the crop row orienta“Determina-tions from formosat-2 multi-temporal and panchromatic images,” ISPRS J Pho-togramm Remote Sens, vol. 94, pp. 127–142, 2014.
[13] B. Duchemin et al., “Impact of sowing date on yield and water-use-efficiency of wheat analyzed through spatial modeling and formosat-2 images,” Remote Sensing, vol. 7, no. 5, pp. 5951–5979, 2015.