HAL Id: hal-00337978
https://hal.archives-ouvertes.fr/hal-00337978
Preprint submitted on 10 Nov 2008
HAL is a multi-disciplinary open access
archive for the deposit and dissemination of
sci-entific research documents, whether they are
pub-lished or not. The documents may come from
teaching and research institutions in France or
abroad, or from public or private research centers.
L’archive ouverte pluridisciplinaire HAL, est
destinée au dépôt et à la diffusion de documents
scientifiques de niveau recherche, publiés ou non,
émanant des établissements d’enseignement et de
recherche français ou étrangers, des laboratoires
publics ou privés.
HCO mapping of the Horsehead : Tracing the
illuminated dense molecular cloud surfaces
Maryvonne Gerin, Javier R. Goicoechea, Jérôme Pety, Pierre Hily-Blant
To cite this version:
Maryvonne Gerin, Javier R. Goicoechea, Jérôme Pety, Pierre Hily-Blant. HCO mapping of the
Horse-head : Tracing the illuminated dense molecular cloud surfaces. 2008. �hal-00337978�
Astronomy & Astrophysicsmanuscript no. hco-gerin.hyper8217 c ESO 2008 November 10, 2008
HCO mapping of the Horsehead :
Tracing the illuminated dense molecular cloud surfaces
⋆
Maryvonne Gerin
1, Javier R. Goicoechea
1 ⋆⋆, Jerome Pety
2,1, and Pierre Hily-Blant
31 LERMA–LRA, UMR 8112, CNRS, Observatoire de Paris and Ecole Normale Sup´erieure, 24 Rue Lhomond, 75231 Paris, France.
e-mail: maryvonne.gerin@lra.ens.fr, jrgoicoechea@fis.ucm.es
2 IRAM, 300 rue de la Piscine, 38406 Grenoble cedex, France.
e-mail: pety@iram.fr
3 Laboratoire d’Astrophysique, Observatoire de Grenoble, BP 53, 38041 Grenoble Cedex 09, France.
e-mail: pierre.hilyblant@obs.ujf-grenoble.fr Received September 2008 ; accepted xxx 2008
ABSTRACT
Context.Far-UV photons strongly affect the physical and chemical state of molecular gas in the vicinity of young massive stars.
Aims.Finding molecular tracers of the presence of FUV radiation fields in the millimeter wavelength domain is desirable, because IR diagnostics (PAHs for instance) are not easily accessible towards high extinction line-of-sights. Furthermore, gas phase diagnostics provide information on the velocity fields.
Methods.We have obtained maps of the HCO and H13CO+ground state lines towards the Horsehead edge at 5′′
angular resolution with a combination of Plateau de Bure Interferometer (PdBI) and the IRAM-30m telescope observations. These maps have been complemented with IRAM-30m observations of several excited transitions at two different positions.
Results.Bright formyl radical emission delineates the illuminated edge of the nebula, with a faint emission remaining towards the shielded molecular core. Viewed from the illuminated star, the HCO emission almost coincides with the PAH and CCH emission. HCO reaches a similar abundance than HCO+in the PDR (≃1-2 ×10⁻⁹with respect to H
2). To our knowledge, this is the highest
HCO abundance ever measured. Pure gas-phase chemistry models fail to reproduce the observed HCO abundance by ∼2 orders of magnitude, except if reactions of atomic oxygen with carbon radicals abundant in the PDR (i.e., CH2) play a significant role in the
HCO formation. Alternatively, HCO could be produced in the PDR by non-thermal processes such as photo-processing of ice mantles and subsequent photo-desorption of either HCO or H2CO, and further gas phase photodissociation.
Conclusions.The measured HCO/H13CO+abundance ratio is large towards the PDR (≃50), and much lower toward the gas shielded
from FUV radiation (.1). We propose that high HCO abundances (&10−10) together with large HCO/H13CO+abundance ratios (&1)
are sensitive diagnostics of the presence of active photochemistry induced by FUV radiation.
Key words.Astrochemistry – ISM clouds – molecules – individual object (Horsehead nebula) – radiative transfer – radio lines: ISM
1. Introduction
Photodissociation region (PDR) models are used to under-stand the evolution of far-UV (FUV; hν <13.6 eV) illumi-nated matter both in our Galaxy and in external galax-ies. These sophisticated models have been benchmarked re-cently (R¨ollig et al. 2007) and are continuously upgraded (e.g., Goicoechea & Le Bourlot 2007; Gonz´alez-Garc´ıa et al. 2008). Given the large number of physical and chemical processes in-cluded in such models, it is necessary to build reference data sets, which can be used to test the predictive accuracy of models. Our team has contributed to this goal by providing a series of high resolution interferometric observations of the Horsehead nebula (see Pety et al. 2007b, for a summary). Indeed, this source is par-ticularly well suited because of its favorable orientation and ge-ometry, and its moderate distance (∼400 pc; Habart et al. 2005). We have previously studied the carbon (Teyssier et al. 2004;
Send offprint requests to: e-mail: maryvonne.gerin@lra.ens.fr
⋆ Based on observations obtained with the IRAM Plateau de Bure
interferometer and 30 m telescope. IRAM is supported by INSU/CNRS (France), MPG (Germany), and IGN (Spain).
⋆⋆ Current address: Departamento de Astrof´ısica. Universidad
Complutense de Madrid, Spain.
Pety et al. 2005) and sulfur chemistry (Goicoechea et al. 2006), and detected the presence of a cold dense core, with active deu-terium fractionation (Pety et al. 2007a).
The formyl radical, HCO, is known to be present in the inter-stellar medium since the late 70’s (Snyder et al. 1976). Snyder et al. (1985) give a detailed description of the HCO struc-ture and discuss the energy diagram for the lowest energy levels. HCO is a bent triatomic asymmetric top with an un-paired electron. a-type and b-type transitions are allowed, with a stronger dipole moment (1.36 Debye) for the a-type tran-sitions (Landsberg et al. 1977), which are therefore more eas-ily detectable. The strongest HCO ground state transitions lie at 86.670, 86.708, 86.777 and 86.805 GHz, very close to the ground state transition of H13CO+and to the first rotationally ex-cited SiO line. Therefore HCO can be observed simultaneously with SiO and H13CO+. HCO ground state lines have been de-tected in the Orion Bar as well as in the dense PDRs NGC 2023, NGC 7023 and S 140 (Schilke et al. 2001). From limited map-ping, they have shown that HCO is sharply peaked in the Orion Bar PDR, confirming earlier suggestions that HCO is a tracer of the cloud illuminated interfaces (de Jong et al. 1980). Garc´ıa-Burillo et al. (2002) have mapped HCO and H13CO+ in the nearby galaxy M82. HCO, CO and the ionized gas present a
Table 1. Observation parameters for the maps shown in Fig. 1 and 5 (Fig. 5 is available on-line only). The projection center of all
the maps is α2000= 05h40m54.27s, δ2000= −02◦28′00′′.
Molecule Transition Frequency Instrument Config. Beam PA Vel. Resol. Int. Timea Tsys Noiseb Obs. date
GHz arcsec ◦ km s−1 hours K K
H13CO+ 1 − 0 86.754288 PdBI C & D 6.76 × 4.65 13 0.2 6.5 150 0.10 2006-2007
HCO 10,13/2, 2 − 00,01/2, 1 86.670760 PdBI C & D 6.69 × 4.39 16 0.2 6.5 150 0.09 2006-2007
CCH 1, 3/2 (2) − 0, 1/2 (1) 87.316925 PdBI C & D 7.24 × 4.99 54 0.2 6.9 130 0.07 2002-2003
aOn-source time computed as if the source were always observed with 6 antennae.bThe noise values quoted here are the noises at the mosaic
phase center (Mosaic noise is inhomogeneous due to primary beam correction; it steeply increases at the mosaic edges).
Molecule Transition Frequency Instrument # Pix. Feff Beff Resol. Resol. Int. Timea T
sys Noise Obs. date
GHz arcsec km s−1 hours K mK H13CO+ J=1–0 86.754288 30m/AB100 2 0.95 0.78 28.4 0.2 2.6/5.0 133 69 2006-2007 HCO 10,13/2, 2 − 00,01/2, 1 86.670760 30m/AB100 2 0.95 0.78 29.9 0.2 2.6/5.0 133 63 2006-2007 HCO 10,13/2, 1 − 00,01/2, 0 86.708360 30m/AB100 2 0.95 0.78 29.9 0.2 2.6/5.0 133 63 2006-2007 HCO 10,11/2, 1 − 00,01/2, 1 86.777460 30m/AB100 2 0.95 0.78 29.9 0.2 2.6/5.0 133 66 2006-2007 HCO 10,11/2, 0 − 00,01/2, 1 86.805780 30m/AB100 2 0.95 0.78 29.9 0.2 2.6/5.0 133 66 2006-2007
aTwo values are given for the integration time: the on-source time and the telescope time.
Table 2. Observation parameters for the HCO deep integrations shown in Fig. 1. Associated transitions can be found in Table 3. The
RA and Dec offsets are computed with reference to α2000= 05h40m54.27s, δ2000= −02◦28′00′′. The positions are also given in the coordinate system used to display the maps in Fig. 1 and 5. In this coordinate system, maps are rotated by 14◦counter–clockwise around the projection center, located at (δx, δy) = (20′′,0′′), to bring the illuminated star direction in the horizontal direction and the horizontal zero has been set at the PDR edge.
Position name (δRA,δDec) (δx, δy)
arcsec arcsec
“DCO+peak” (20′′,22′′) (44.7′′,16.5′′) “HCO peak” (−5, 0′′) (15.1′′,1.2′′)
Position Frequency Line areaa Instrument Feff Beff Resol. Resol. Int. Timeb T
sys Noise Obs. date
GHz K km s−1 arcsec km s−1 hours K mK “DCO+peak” 86.670760 0.23 ± 0.009 30m/B100 0.95 0.78 28.4 0.27 0.75/1.5 134 11 2008 86.708360 0.12 ± 0.009 30m/B100 0.95 0.78 28.4 0.27 0.75/1.5 134 11 2008 “HCO peak” 86.670760 0.52 ± 0.008 30m/B100 0.95 0.78 28.4 0.27 0.75/1.5 127 10 2008 86.708360 0.31 ± 0.007 30m/B100 0.95 0.78 28.4 0.27 0.75/1.5 127 10 2008 173.3773770 0.47 ± 0.023 30m/C150 0.93 0.65 14.2 0.067 2.0/4.0 667 66 2008 173.4060816 0.26 ± 0.018 30m/C150 0.93 0.65 14.2 0.067 2.0/4.0 667 66 2008 173.4430648 0.23 ± 0.020 30m/C150 0.93 0.65 14.2 0.067 2.0/4.0 667 66 2008 260.0603290 0.16 ± 0.019 30m/C270 0.88 0.46 9.5 0.18 3.0/6.0 740 59 2008 260.0821920 0.14 ± 0.020 30m/C270 0.88 0.46 9.5 0.18 3.0/6.0 740 59 2008 260.1335860 0.12 ± 0.017 30m/C270 0.88 0.46 9.5 0.18 3.0/6.0 740 59 2008 260.1557690 0.06 ± 0.016 30m/C270 0.88 0.46 9.5 0.18 3.0/6.0 740 59 2008
aValues obtained from Gaussian fits performed on the spectra using the main beam temperature scale.bTwo values are given for the integration
time: the on-source time and the telescope time.
nested ring morphology, with the HCO peaks being located fur-ther out compared to CO and the ring of H regions. The chem-istry of HCO is not well understood. Schilke et al. (2001) con-cluded that it is extremely difficult to understand the observed HCO abundance in PDRs with gas phase chemistry alone. As a possible way out, they tested the production of HCO by the photodissociation of formaldehyde. In this model, H2CO is pro-duced in grain mantles, and released by non-thermal photo-desorption in the gas phase in the PDR. However, even with this favorable hypothesis, the model can not reproduce the abundance and spatial distribution of HCO because the photo-production is most efficient at an optical depth of a few magni-tudes where the photodissociation becomes less effective.
In this paper, we present maps of the formyl radical ground state lines at high angular resolution towards the Horsehead
neb-ula, and the detection of higher energy level transitions towards two particular lines of sights, one in the PDR region and the other in the associated dense core. These observations enable us to ac-curately study the HCO spatial distribution and abundance. We present the observations and data reduction in section 2, while the results and HCO abundance are given in section 3, and the discussion of HCO chemistry and PDR modeling is given in sec-tion 4.
2. Observations and data reduction
Tables 1 and 2 summarize the observation parameters for the data obtained with the IRAM PdBI and 30m telescopes. The HCO ground state lines were observed simultaneously with H13CO+and SiO. Frequency-switched, on-the-fly maps of the
H13CO+ J=1–0 and HCO ground state lines (see Fig. 5), ob-tained at the IRAM-30m using the A100 and B100 3mm re-ceivers (∼ 7 mm of water vapor) were used to produce the short-spacings needed to complement a 7-field mosaic acquired with the 6 PdBI antennae in the CD configuration (baseline lengths from 24 to 176 m). The whole PdBI data set will be comprehen-sively described in a forthcoming paper studying the fractional ionization across the Horsehead edge (Goicoechea et al. 2009, in prep.). The CCH data shown in Fig. 1 have been extensively de-scribed in Pety et al. 2005. The high resolution HCO 10,1−00,0 data are complemented by observations of the 20,2−10,1 and 30,3−20,2multiplets with the IRAM 30m telescope centered on the PDR and the dense core. To obtain those deep integration spectra, we used the position switching observing mode. The on-off cycle duration was 1 minute and the off-position offsets were (δRA, δDec) = (−100′′,0′′), i.e. the H region ionized by σOri and free of molecular emission. Position accuracy is esti-mated to be about 3′′for the 30m data and less than 0.5′′for the PdBI data.
The data processing was done with the GILDAS1 soft-wares (Pety 2005b). The IRAM-30m data were first calibrated to the T∗
A scale using the chopper wheel method (Penzias & Burrus 1973), and finally converted to main beam temperatures (Tmb) using the forward and main beam efficiencies (Feff & Beff) displayed in Table 2. The result-ing amplitude accuracy is ∼ 10%. Frequency-switched spectra were folded using the standard shift-and-add method, after baseline subtraction. The resulting spectra were finally gridded through convolution by a Gaussian. Position-switched spectra were co-added before baseline subtraction. Interferometric data and short-spacing data were merged before imaging and deconvolution of the mosaic, using standard techniques of GILDAS(see e.g. Pety et al. 2005, for details).
3. Results and Discussion
3.1. Spatial distribution
Fig. 1 shows a map of the integrated intensity of the strongest HCO line at 86.671 GHz, of the H13CO+ J=1–0 line and of the strongest CCH line at 87.317 GHz. Fig. 2 displays high signal-to-noise ratio spectra of several hyperfine components of three HCO rotational transitions towards the HCO and the DCO+ emission peaks.
Most of the formyl radical emission is concentrated in a narrow structure, delineating the edge of the Horsehead nebula. Low level emission is however detected throughout the nebula, including towards the dense core identified by its strong DCO+ and H13CO+ emission (Pety et al. 2007a). The HCO emission is resolved by our PdBI observations. From 2-dimensional Gaussian fits of the image, we estimate that the emission width is ∼13±4′′in the plane of the sky. The H13CO+emission shows a different pattern : most of the signal is associated with the dense core behind the photodissociation front, and faint H13CO+ emis-sion detected in the illuminated edge. The CCH emisemis-sion pattern is less extreme than HCO, but shows a similar enhancement in the PDR.
In summary, the morphology of the HCO emission is reminiscent of the emission of the PDR tracers, either the PAH emission (Abergel et al. 2002) or the small hydro-carbons emission, which is strongly enhanced towards the 1 See http://www.iram.fr/IRAMFR/GILDAS for more
informa-tion about the GILDAS softwares.
Table 3. Einstein coefficients and upper level energies.
Molecule Transition Frequency Ai j Eup J, F − J′ ,F′ GHz (s−1) (K) HCO 101−000 3/2, 2 − 1/2, 1 86.670760 4.69 × 10⁻⁶ 4.2 3/2, 1 − 1/2, 0 86.708360 4.60 × 10⁻⁶ 4.2 1/2, 1, 1/2, 0 86.777460 4.61 × 10⁻⁶ 4.2 1/2, 0 − 1/2, 1 86.805780 4.71 × 10⁻⁶ 4.2 202−101 5/2, 3 − 3/2, 2 173.3773770 4.51 × 10⁻⁵ 12.5 5/2, 2 − 3/2, 1 173.4060816 4.43 × 10⁻⁵ 12.5 3/2, 2 − 1/2, 1 173.4430648 3.39 × 10⁻⁵ 12.5 303−202 7/2, 4 − 5/2, 3 260.0603290 1.63 × 10⁻⁴ 25.0 7/2, 3 − 5/2, 2 260.0821920 1.61 × 10⁻⁴ 25.0 5/2, 3 − 3/2, 2 260.1335860 1.45 × 10⁻⁴ 25.0 5/2, 2 − 3/2, 1 260.1557690 1.37 × 10⁻⁴ 25.0 H13CO+ J=1–0 86.754288 3.2 × 10⁻⁵ 4.2 J=3–2 260.2553390 1.3 × 10⁻³ 25.0
The line frequencies and intensities were extracted from the JPL (Pickett et al. 1998) and CDMS (M¨uller et al. 2001; M¨uller et al. 2005) molecular spectroscopy data bases for HCO and H13CO+respectively.
PDR (Teyssier et al. 2004; Pety et al. 2005). By contrast, the HCO emission becomes strikingly faint where the gas is dense and shielded from FUV radiation. These regions are associated with bright DCO+ and H13CO+ emission (Pety et al. 2007a). Our maps therefore confirm that HCO is a PDR species.
3.2. Column densities and abundances
3.2.1. Radiative transfer models of HCO and H13CO+
Einstein coefficients and upper level energies of the studied HCO and H13CO+lines are given in Table 3. As no collisional cross– sections with H2 nor He have been calculated for HCO so far, we have computed the HCO column densities assuming a sin-gle excitation temperature Tex for all transitions. Nevertheless our calculation takes into account thermal, turbulent and opac-ity broadening as well as the cosmic microwave background and line opacity (Goicoechea et al. 2006). For H13CO+, detailed non-local and non-LTE excitation and radiative transfer calcula-tions have been performed using the same approach as in our previous PdBI CS and C18O line analysis (see Appendix in Goicoechea et al. 2006). H13CO+-H
2collisional rate coefficients were adapted from those of Flower (1999) for HCO+, and spe-cific H13CO+-electron rates where kindly provided by Faure & Tennyson (in prep.).
3.2.2. Structure of the PDR in HCO and H13CO+
To get more insight on the spatial variation of the HCO and H13CO+column densities and abundances, we have analyzed a cut through the PDR, centered on the “HCO peak” at δy=0” (see Fig. 3). The cut clearly shows that HCO is brighter than H13CO+ in the PDR and vice-versa in the dense core. Taking into account the different level degeneracies of both transitions (a factor 2.4) and the fact that the associated Einstein coefficients Ai jdiffer by a factor ∼8 (due to the different permanent dipole moments, see Table 3), N(H13CO+) must be significantly lower than N(HCO) towards the PDR.
Fig. 1. High angular resolution maps of the integrated intensity of H13CO+, HCO, CCH and vibrationally excited H2 emission. H13CO+ and HCO have been observed simultaneously, both with the IRAM-30m and IRAM-PdBI. Maps have been rotated by 14◦ counter–clockwise around the projection center, located at (δx, δy) = (20′′,0′′), to bring the illuminated star direction in the horizontal direction and the horizontal zero has been set at the PDR edge. The emission of all lines is integrated between 10.1 and 11.1 km s−1. Displayed integrated intensities are expressed in the main beam temperature scale. Contour levels are displayed on the grey scale lookup tables. The red vertical line shows the PDR edge and the green crosses show the positions (DCO+and HCO peaks) where deep integrations have been performed at IRAM-30m (see Fig. 2). The H2map is taken from (author?) (Habart et al. 2005).
We modeled the PDR as an edge-on cloud inclined by ∼5◦ relative to the line-of-sight. We have chosen a cloud depth of ∼0.1 pc, which implies an extinction of AV≃20 mag for the considered densities towards the “HCO peak”. These parame-ters are the best geometrical description of the Horsehead PDR-edge (e.g., Habart et al. 2005) and also reproduce the observed 1.2 mm continuum emission intensity. The details of this mod-eling will be presented in Goicoechea et al. (2009). In the fol-lowing, we describe in details the determination of the column densities and abundances for two particular positions, namely the “HCO peak” and the “DCO+peak” (offsets relative to the map center can be found in Table 2).
3.2.3. HCO column densities
We used the three detected rotational transitions of HCO (each with several hyperfine components, see Fig. 2) to estimate the HCO column densities in the direction of the “HCO” peak. We have taken into account the varying beam dilution factors of the HCO emission at the “HCO peak” by modeling the HCO emis-sion as a Gaussian filament of ∼12′′ width in the δx direction, and infinite in the δy direction. The filling factors at 260, 173 and 87 GHz are thus ∼0.8, 0.6 and 0.4, respectively.
A satisfactory fit of the IRAM–30m data towards the “HCO peak” is obtained for Tex≃5 K and a turbulent velocity dis-persion of σ=0.225 km s−1(FWHM= 2.355 × σ). Line profiles are reproduced for N(HCO) = 3.2 × 1013 cm−2 (see red solid curves in Fig. 2). The most intense HCO lines at 86.67 and 173.38 GHz become marginally optically thick at this column density (τ & 1). Therefore, opacity corrections need to be taken into account. We checked that the low value of Tex(subthermal excitation as Tk≃60 K) is consistent with detailed excitation cal-culations carried for H13CO+ in the PDR which are described below.
Because the HCO signals are weaker towards the “DCO+peak”, we only detected 2 hyperfine components of the 101−000 transition. Assuming extended emission and the same excitation temperature as for the “HCO peak”, 5 K, we fit the ob-served lines with a column density of 4.6 ×1012 cm−2(blue solid lines in Fig. 2). Both HCO lines are optically thin at this posi-tion. This simple analysis shows that the HCO column density
Table 4. Inferred column densities and abundances with respect
to molecular hydrogen, e.g. χ(X) = N(X)/N(H2).
Molecule Method HCO peak DCO+peak
N(H2) [ cm−2] 1.2 mm cont. 1.9 × 10²² 2.9 × 10²² N(HCO) [ cm−2] T ex= 5 K 3.2 × 10¹³ 4.6 × 10¹² N(H13CO+) [ cm−2] Full excitation 5.8 × 10¹¹ 5.0 × 10¹² ∗ N(HCO+) [ cm−2] 12C/13C=60 3.5 × 10¹³ 3.0 × 10¹⁴ χ(HCO) 1.7 × 10⁻⁹ 1.6 × 10⁻¹⁰ † χ(H13CO+) 3.1 × 10⁻¹¹ 1.7 × 10⁻¹⁰ χ(HCO+) 1.8 × 10⁻⁹ 1.0 × 10⁻⁸ ∗
Pety et al. (2007a) †
1.7 × 10⁻⁹ if HCO arises only from the cloud
surface (AV≃3).
is ∼ 7 times larger at the “HCO peak” in the PDR, than towards the dense cold core.
3.2.4. H13CO+column densities
Both the H13CO+J=3-2 and 1-0 line profiles at the “HCO peak”
are fitted with n(H2) ≃5×104cm−3, Tk≃60 K and e−/H ≃5×10⁻⁵ (as predicted by the PDR models below). The required column density is N(H13CO+)=5.8×1011 cm−2. For those conditions, the excitation temperature, Tex, of the J=3-2 transition varies from ≃4 to 6 K, which supports the single-Texmodels of HCO. Both H13CO+lines are optically thin towards the “HCO peak”.
The H13CO+ line emission towards the “DCO+ peak” has been studied by Pety et al. (2007a). Both H13CO+lines are mod-erately optically thick towards the core, and the H13CO+column density is N(H13CO+)≃ 5.0×1012 cm−2, which represents an en-hancement of nearly one order of magnitude relative to the PDR. According to our 1.2 mm continuum map, the extinction towards the core is AV&30 mag compared to 20 mag in the PDR. The H13CO+column density enhancement therefore corresponds to a true abundance enhancement.
3.2.5. Comparison of HCO and H13CO+abundances
Table 4 summarizes the inferred HCO and H13CO+column den-sities and abundances towards the 2 selected positions : the
Fig. 2. IRAM-30m observations (histograms) of several HCO hyperfine components of the 101-000, 202-101and 303-202rotational transitions towards the PDR (“HCO peak”) and towards the dense core (“DCO+peak”) (Pety et al. 2007a). Solid lines are
single-Texradiative transfer models of the PDR-filament (red curves) and line-of-sight cloud surface (blue curves). A sketch of the HCO rotational energy levels is also shown (right corner).
“HCO peak” in the PDR and the “DCO+ peak” in the FUV-shielded core. Both species exhibit strong variations of their column densities and abundances relative to H2 between the PDR and the shielded region. In the PDR, we found that both the HCO abundance relative to H2 (χ(HCO)≃1-2 ×10⁻⁹) and the HCO/H13CO+ column density ratio (≈50) are high. These figures are higher than all previously published measurements (at lower angular resolution). Besides, the formyl radical and
HCO+reach similar abundances in the PDR.
The situation is reversed towards the “DCO+peak”, i.e. the observed HCO/H13CO+column density ratio is lower (≈1) than towards the “HCO peak” . Nevertheless, while the bulk of the observed H13CO+emission arises from cold and shielded gas, the origin of HCO emission is less clear. HCO could either (i) coexist with H13CO+or (ii) arise predominantly from the line-of-sight cloud surface. In the former case, our observations show that the HCO abundance drops by one order of magnitude be-tween the PDR and the dense core environment. However, it is possible that the abundance variation is even more pronounced, if the detected HCO emission arises from the line of sight cloud surface. We have estimated the depth of the cloud layer, assum-ing that HCO keeps the “PDR abundance” in this foreground layer : a cloud surface layer of AV≃3 (illuminated by the mean FUV radiation field around the region) also reproduces the ob-served HCO lines towards the cold dense core (blue solid lines in Fig. 2).
In this case, both the HCO abundance and the HCO/H13CO+ abundance ratio in the dense core itself will be even lower than listed in table 4. We have tried to discriminate both scenar-ios by comparing the HCO 101 −000 (J=3/2-1/2, F=2-1) and H13CO+ J=1-0 line profiles towards this position. Both lines have been observed simultaneously with the IRAM-30m tele-scope. Because of their very similar frequencies (∼86.7 GHz), the beam profile and angular resolution is effectively the same.
Fig. 3. Observations along a horizontal cut through “the HCO
peak” (histograms). The H13CO+ J=1-0 and HCO 1 01 −000 lines were mapped with the PdBI at an angular resolution of 6.8′′, whereas the H13CO+J=3-2 line was mapped with HERA-30m (and smoothed to a spatial resolution of 13.5′′). Radiative transfer models of an edge-on cloud with a line of sight ex-tinction of AV=20, inclined 5◦ relative to the line of sight for HCO (red curve), and H13CO+ (blue curves) are shown. The single-Tex HCO model assumes a 12′′ width filament with a column density of 3.2 × 1013 cm−2, while N(HCO) is 4.6 × 1012 cm−2 behind the filament. The H13CO+ model assumes a constant density of n(H2)=5×104cm−3 with Tk=60 K and
N(H13CO+)=5.8 × 1011 cm−2 for δx <35′′; and T
k=10 K and
N(H13CO+)=7.6 × 1011 cm−2for δx >35′′. Modeled line profiles have been convolved with an appropriate Gaussian beam cor-responding to each PdBI synthesized beam or 30m main beam resolution.
In this situation, any difference in the measured linewidths re-flects real differences in the gas kinematics and turbulence of
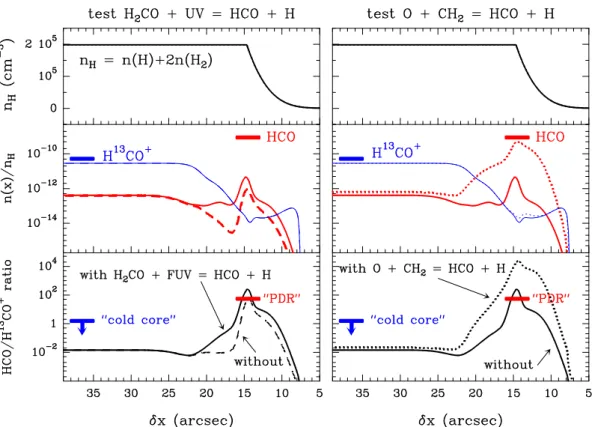
Fig. 4. Photochemical models of a unidimensional PDR. Upper panels show the density gradient (nH= n(H) + 2n(H2) in cm−3) used in the calculation. Middle panels show the predicted HCO and H13CO+abundances (relative to n
H). The H13CO+abundance inferred from observations in the cold core (“the DCO+ peak”, see the offsets in Table 2) is shown with blue lines. The HCO abundance inferred from observations in the PDR (“the HCO peak”, see the offsets in Table 2) is shown with red lines. Lower panels show the HCO/H13CO+abundance ratio predicted by the models whereas the HCO/H13CO+column density ratio inferred from observations is shown as blue arrows and red lines (for the cold core and PDR respectively). Every panel compares two different models:
Left-side models show a standard chemistry (dashed curves) versus the same network upgraded with the addition of the H2CO + photon
→HCO + H photodissociation (solid curves). Right-side models show the previous upgraded standard model (solid curves) versus a chemistry that adds the O + CH2→HCO + H reaction with a rate of 5.01×10⁻¹¹ cm3s−1(dotted curves). The inclusion of the O + CH2reaction has almost no effect on H13CO+for the physical conditions prevailing in the Horsehead, but triggers an increases of the HCO abundance in the PDR by two orders of magnitude.
the regions where the line profiles are formed. Gaussian fits of the HCO and H13CO+lines towards “the DCO+peak” provides line widths of ∆v(HCO) = 0.81±0.06 km s−1 and ∆v(H13CO+) = 0.60±0.01 km s−1. Therefore, even if the H13CO+ J=1-0 line
are slightly broadened by opacity and do not represent the true line of sight velocity dispersion, HCO lines are broader at the 3σ level of confidence. This remarkable difference supports sce-nario (ii) where the H13CO+ line emission towards the “the DCO+ peak” arises from the quiescent, cold and dense core, whereas HCO, in the same line of sight, arises predominantly from the warmer and more turbulent outer cloud layers. We note that the presence of a foreground layer of more diffuse mate-rial (AV∼2 mag) was already introduced by Goicoechea et al. (2006), to fit the CS J=2-1 scattered line emission. The anal-ysis of CO J=4–3 and CI 3P1 −3P0 maps led also (author?) (Philipp et al. 2006) to propose the presence of a diffuse enve-lope, with AV∼2 mag, and which contributes to roughly the about half the mass of the dense filament traced by C18O and the dust continuum emission. The hypothesis of a surface layer of HCO is therefore consistent with previous modeling of molec-ular emission of the horsehead.
We conclude 1) that HCO and HCO+ have similar abun-dances in the PDR, and 2) that the HCO abundance drops by at least one order of magnitude between the dense and warm PDR region and the cold and shielded DCO+core.
4. HCO chemistry
4.1. Gas-phase formation: PDR models
In order to understand the HCO and H13CO+ abundances and HCO/H13CO+column density ratio inferred from observations, we have modeled the steady state gas phase chemistry in the Horsehead edge. The density distribution in the PDR is well represented by a density gradient nH(δx) ∝ δx4, where δx is the distance from the edge towards the cloud interior and nH = n(H) + 2n(H2) (see the top panels of Fig. 4). The density reaches a constant nH value of 2×105cm−3 in an equivalent length of ∼10′′(Habart et al. 2005; Goicoechea et al. 2006). The cloud edge is illuminated by a FUV field 60 times the mean interstellar radiation field (G0 = 60 in Draine units). We used the Meudon PDR code2, a photochemical model of a unidi-mensional PDR (see Le Bourlot et al. 1993; Le Petit et al. 2006; Goicoechea & Le Bourlot 2007, for a detailed description). Our standard chemical network is based on a modified version of
Ohio State University (osu) gas–phase network, updated for
photochemical studies (see Goicoechea et al. 2006). It also in-cludes13C fractionation reactions (Graedel et al. 1982) and spe-cific computation of the13CO photodissociation rate as a func-tion of depth. The ionizafunc-tion rate due to cosmic rays in the
models is ζ=5×10⁻¹⁷s−1. Following our previous works, we chose the following elemental gas phase abundances: He/H=0.1, O/H=3×10−4, C/H=1.4×10−4, N/H=8×10−5, S/H=3.5×10−6, 13C/H=2.3×10−6, Si/H=1.7×10−8and Fe/H=1.0×10−9.
In Fig. 4, we investigate the main gas-phase formation routes for HCO in a series of models ”testing” different pathways lead-ing to the formation of HCO. HCO and H13CO+ predictions are shown in Figure 4 (middle panels). As a first result, note that in all models the HCO abundance peaks near the cloud surface at AV≃1.5 (δx ≃14′′) where the ionization fraction is high (e−/H∼5×10−5). Due to the low abundance of metals in the model (as represented by the low abundance of Fe), the ioniza-tion fracioniza-tion in the shielded regions is low (e−/H .10−8), and therefore the H13CO+predictions matches the observed values (Goicoechea et al. 2009). Besides, a low metalicity reduces the efficiency of charge exchange reactions of HCO+ with metals, e.g.,
Fe + HCO+→HCO + Fe+ (1)
which are the main gas-phase formation route of HCO in the FUV-shielded gas in our models. Hence, the HCO abundance re-mains low inside the core. Nevertheless, despite that such mod-els do reproduce the observed HCO distribution, which clearly peaks at the PDR position, the predicted absolute HCO abun-dances can vary by orders of magnitude depending of the domi-nant formation route.
In our standard model (left-side models : dashed curves), the formation of HCO in the PDR is dominated by the disso-ciative recombination of H2CO+, while its destruction is domi-nated by photodissociation. Even if the predicted HCO/H13CO+ abundance ratio satisfactorily reproduces the value inferred from observations, the predicted HCO abundance peak is ∼3 orders of magnitude lower than observed. In order to increase the gas-phase formation of the HCO in the PDR we have added a new channel in the photodissociation of formaldehyde, the produc-tion HCO, in addiproduc-tion to the normal channel producing CO :
H2CO + photon → HCO + H (2)
This channel is generally not included in standard chemical net-works but very likely exists (Troe 2007; Yin et al. 2007). We included this process with an unattenuated photodissociation rate of κdiss(H2CO)=10−9s−1and a depth dependence given by exp(−1.74 AV). This is the same rate as the one given by van Dishoeck (1988) for the photodissociation of H2CO producing CO, which is explicitly calculated for the Draine (1978) radia-tion field. Model results are shown in Fig. 4 (left-side models: solid curves). The inclusion of Reaction 2, which becomes the dominant HCO formation route, increases the HCO abundance in the PDR by a factor ∼5. But the HCO production rate is still too low to reproduce the abundance determined from observa-tions.
Another plausible possibility to increase the HCO abundance in the PDR by pure gas-phase processes is to include additional reactions of atomic oxygen with carbon radicals that reach high abundances only in the PDR. Among the investigated reactions, the most critical one,
O + CH2→HCO + H (3)
is known to proceed with a relatively fast rate at high tem-peratures (5.01×10⁻¹¹cm3s−1 at T
k=1200-1800 K; Tsuboi & Hashimoto 1981). This is the rate recommended by NIST (Mallard et al. 1994) and UMIST2006 (Woodall et al. 2007) and that we adopt for our lower temperature domain (∼10-200 K).
Model predictions are shown in Fig. 4 (right-side models: dotted curves). Whereas the predicted HCO abundance in the shielded gas remains almost the same, the HCO abundance is dramati-cally increased in the PDR (by a factor of ∼125) and the O + CH2 reaction becomes the HCO dominant production reaction. Therefore, such a pure gas–phase model adding reactions 2 and 3 not only reproduces the H13CO+ abundance in shielded core, but also reproduces the observed HCO absolute abundances in the PDR. In this picture, the enhanced HCO abundance that we observe in the Horsehead PDR edge would be fully determined by the gas-phase chemical path :
C+ →−H2 CH
+
2 →−H2 CH
+
3 →−e− CH2 →−O HCO (4)
The validity of the rate of Reaction 3 used in our PDR model remains, of course, to be confirmed theoretically or experimen-tally at the typical ISM temperatures (10 to 200 K).
4.2. Other routes for HCO formation: Grain photodesorption
If Reaction 3 is not included in the chemical network, the pre-dicted HCO abundance is ∼2 orders of magnitude below the ob-served value towards the PDR. As a consequence, the presence of HCO in the gas-phase should be linked to grain mantles for-mation routes, and subsequent desorption processes (not taken into account in our modeling). In particular, Schilke et al. (2001) proposed that HCO could result from H2CO photodissociation, if large quantities of formaldehyde are formed on grain man-tles and then released in the gas phase. Even with this assump-tion, their model could not reproduce the observed HCO abun-dance in highly illuminated PDRs such as the Orion Bar. The weaker FUV-radiation field in the Horsehead, but large density, prevent dust grains to acquire high temperatures over large spa-tial scales. In fact, both gas and grains cool down below ∼30 K in ≃10′′-20′′ (or A
V≃1-2) as the FUV-radiation field is attenu-ated. Therefore, thermal desorption of dust ice-mantles (presum-ably formed before σ-Orionis ignited and started to illuminate the nebula) should play a negligible role. Hence a non-thermal desorption mechanism should be considered to produce the high abundance of HCO observed in the gas phase. This mechanism could either produce HCO directly or a precursor molecule such as formaldehyde.
Since high HCO abundances are only observed in the PDR, FUV induced ice-mantle photo-desorption (with rates that roughly scales with the FUV-radiation field strength) seems the best candidate (e.g., Willacy & Williams 1993; Bergin et al. 1995). Laboratory experiments have shown that HCO radicals are produced in irradiated, methanol con-taining, ice mantles (Bernstein et al. 1995; Moore et al. 2001; Bennett & Kaiser 2007). The formyl radical could be formed through the hydrogenation of CO in the solid phase. It is an important intermediate radical in the synthesis of more com-plex organic molecules such as methyl formate or glycolalde-hyde (Bennett & Kaiser 2007). However, the efficiency of the production of radicals in FUV irradiated ices remains uncer-tain, and very likely depends on the ice-mantle composition. The formation of species like formaldehyde and methanol in CO-ice exposed to H-atom bombardment has been reported by different groups (Hiraoka et al. 1994; Watanabe et al. 2002; Linnartz et al. 2007), further confirming the importance of HCO as an intermediate product in the synthesis of organic molecules in ices. Indeed, hydrogenation reactions of CO-ice, which form HCO, H2CO, CH3O and CH3OH in grain mantles (e.g., Tielens & Whittet 1997; Charnley et al. 1997), are one impor-tant path which warrants further studies.
To compare with our observations, we further need to un-derstand how the radicals are released in the gas phase, either directly during the photo-processing, or following FUV induced photo-desorption. Recent laboratory measurements have started to shed light on the efficiency of photo-desorption, which de-pends on the ice composition and molecule to be desorbed. For species such as CO, the rate of photo-desorbed molecules per FUV photon is much larger than previously thought (e.g.,
¨
Oberg et al. 2007). Similar experiments are required to constrain the formation rate of the various species that can form in inter-stellar ices and to determine their photo-desorption rates.
We can use the measured gas phase abundance of HCO to constrain the efficiency of photo-desorption. We assume that the PDR is at steady state, and that the main HCO formation mecha-nism is non thermal photo-desorption from grain mantles (with a
FHCOrate), while the main destruction mechanism is gas–phase photodissociation (with a DHCOrate), therefore :
DHCO= G0κdiss(HCO) χ(HCO) n(H2) [cm−3s−1] (5)
FHCO= G0κpd(HCO) χ(HCOice)
n(H2Oice) n(H2)
n(H2)[cm−3s−1] (6) where χ(HCO) is the gas phase abundance of HCO relative to H2, χ(HCOice) is the solid phase abundance relative to water ice, and n(H2Oice)/n(H2) is the fraction of water in the solid phase relative to the total gas density. κdiss(HCO) and κpd(HCO) are the HCO photodissociation and photo-desorption rates respectively.
By equaling the formation and destruction rates, we get :
κpd(HCO) = κdiss(HCO)
χ(HCO) χ(HCOice) n(H2) n(H2Oice) [s−1] (7) or κpd(HCO) s−1 ≈10 −12κdiss(HCO) 10−9 χ(HCO)/10−9 χ(HCOice)/10−2 10−4n(H2) n(H2Oice) (8) where we have used typical figures for the HCO abundance in the gas phase (∼10−9, see above) and solid phase (∼10−2see e.g. Bennet & Kaiser 2007) and for the amount of oxygen present as water ice in grain mantles.
Assuming standard ISM grains with a radius of 0.1 µm the required photodesorption efficiency (or yield) Ypd(HCO): Ypd(HCO) ≃
κpd(HCO)
G0exp(−2AV) πa2
[molecules photon−1] (9) (see e.g., d’Hendecourt et al. 1985; Bergin et al. 1995) converts to Ypd(HCO) ≈ 10−4molecules per photon (for the FUV radi-ation field in the Horsehead and AV≃1.5, where HCO peaks). Therefore, the production of HCO in the gas phase from photo-desorption of formyl radicals could be a valid alternative to gas phase production, if the photo-desorption efficiency is high and HCO abundant in the ice mantles. This mechanism also requires further laboratory and theoretical studies.
Because the formyl radical is closely related to formalde-hyde and methanol and the three species are likely to coexist in the ice mantles, a combined analysis of the H2CO, CH3OH and HCO line emissions towards the Horsehead nebula (PDR and cores) is needed to provide more information on the relative effi-ciencies of gas-phase and solid-phase routes in the formation of complex organic molecules in environments dominated by FUV-radiation. This will be the subject of a future paper.
5. Summary and conclusions
We have presented interferometric and single-dish data showing the spatial distribution of the formyl radical rotational lines in the Horsehead PDR and associated dense core. The HCO emis-sion delineates the illuminated edge of the nebula and coincides with the PAH and hydrocarbon emission. HCO and HCO+reach similar abundances (≃1-2 ×10⁻⁹) in these PDR regions where the chemistry is dominated by the presence of FUV photons. For the physical conditions prevailing in the Horsehead edge, pure gas-phase chemistry is able to reproduce the observed HCO abundances (high in the PDR, low in the shielded core) if the O + CH2→HCO + H reaction is included in the models. This reaction connects the high abundance of HCO, through its for-mation from carbon radicals, with the availability of C+ in the PDR.
The different linewidths of HCO and H13CO+in the line of sight towards the “DCO+ peak” suggest that the H13CO+ line emission arises from the quiescent, cold and dense gas com-pletely shielded from the FUV radiation, whereas HCO predom-inantly arises from the outer surface of the cloud (its illuminated
skin). As a result we propose the HCO/H13CO+ abundance ra-tio, and the HCO abundance itself (if &10−10), as sensitive di-agnostics of the presence of FUV radiation fields. In particular, regions where the HCO/H13CO+ abundance ratio (or intensity ratio if lines are optically thin) is greater than ≃1 should reflect ongoing FUV-photochemistry.
Given the rich HCO spectrum and the possibility to map its bright millimeter line emission with interferometers, we propose HCO-H2as a very interesting molecular system for calculations of the ab initio inelastic collisional rates.
Acknowledgements. We thank the IRAM PdBI and 30m staff for their
sup-port during the observations. We thank A. Faure and J. Tennyson for sending us the H13CO+-e−collisional rates prior to publication, B. Godard for use-ful discussions on the chemistry of carbon ions in the diffuse ISM, and A. Bergeat and A. Canosa for interesting discussions on radical-atom chemical re-actions. JRG is supported by a Ram ´on y Cajal research contract from the Spanish MICINN and co-financed by the European Social Fund. This research has ben-efitted from the financial support of the CNRS/INSU research programme, PCMI. We acknowledge the use of the JPL (Pickett et al. 1998) and Cologne (M¨uller et al. 2001; M¨uller et al. 2005) spectroscopic data bases, as well as the UMIST chemical reaction data base (Woodall et al. 2007).
References
Abergel A., Bernard J. P., Boulanger F., et al., 2002, A&A, 389, 239 Bennett, C.J., and Kaiser,R.I., 2007, ApJ 661, 899
Bergin, E.A., Langer, W.D. & Goldsmith, P.F. 1995, ApJ, 441, 222.
Bernstein M.P., Sandford,S.A., Allamandola, L.J., Chang S., and Scharberg M. A., 1995, ApJ 454, 327
Charnley, S.B., Tielens, A.G.G.M, & Rodgers, S.D. 1997, ApJ, 482, L203 d’Hendecourt, L. B., Allamandola, L. J. & Greenberg, J. M. 1985, A&A, 152 130
Draine, B. T. 1978, ApJS, 36, 595.
de Jong, T., Boland, W., Dalgarno, A. 1980, A&A, 91, 68 Flower, D.R., 1999, MNRAS, 305, 651
Garc´ıa-Burillo, S., Mart´ın-Pintado, J., Fuente, A., Usero, A. & Neri, R. 2002, ApJ, 575, L55
Goicoechea, J. R., Pety, J., Gerin, M., Teyssier, D., Roueff, E., Hily-Blant, P. & Baek, S. 2006, A&A, 456, 565.
Goicoechea, J. R. & Le Bourlot, J. 2007, A&A, 467, 1.
Gonz´alez-Garc´ıa, M, Le Bourlot, J., Le Petit, F. & Roueff, E. 2008, A&A, 485, 127.
Graedel, T. E., Langer, W. D., & Frerking, M. A. 1982, ApJS, 48, 321. Habart, E., Abergel, A., Walmsley, C. M., Teyssier, D. & Pety, J. 2005, A&A, 437, 177-188.
Hiraoka, K., Ohashi, N., Kihara, N., Yamamoto,K., Sato, T. & Yamashita, A. 1994, Chem. Phys. Lett., 229, 408
Le Bourlot, J., Pineau Des Forets, G., Roueff, E., & Flower, D. R. 1993, A&A, 267, 233
Le Petit, F., Nehm´e, C, Le Bourlot, J. & Roueff, E. 2006, ApJS, 64, 506 Linnartz, H., Acharyya, K., Awad, Z. et al. 2007, Molecules in Space and
Laboratory, J.L. Lemaire & F. Combes (eds)
Mallard et al., 1994, NIST Chemical Kinetics Database, NIST, Gaithersburg, MD.
M¨uller H.S.P., Thorwirth S., Roth D.A., and Winnewisser W., A&A 370, L49. M¨uller H.S.P., Schl¨oder F., Stutzki J., and Winnewisser W., J. Mol. Struct. 742, 215.
¨
Oberg, K.I., Fuchs, G.W., Awad, Z., Fraser, H.J., Schlemmer, S., van Dishoeck, E.F., Linnartz, H., 2007, ApJ, 662, L23.
Moore M.H., Hudson R.L., Gerakines P.A., 2001, Spec. Acta part A, 57, 843. Penzias, A.A. & Burrus, C.A. 1973, ARA&A, 11, 51.
Pety, J., Teyssier, D., Foss´e, D., Gerin, M., Roueff, E., Abergel, A., Habart, E. & Cernicharo, J. 2005, A&A, 435, 885-899
Pety, J. SF2A-2005: Semaine de l’Astrophysique Francaise, meeting held in Strasbourg, France, 2005, Edited by F. Casoli, T. Contini, J.M. Hameury and L. Pagani. Published by EdP-Sciences, Conference Series, 2005, p. 721. Pety, J., Goicoechea, J. R., Hily-Blant, P., Gerin, M. Teyssier, D. 2007, A&A, 464, L41
Pety J., Goicoechea, J. R., Gerin, M., et al ., 2007, Proceedings of the Molecules
in Space and Laboratory conference, , J.L. Lemaire & F. Combes (eds).
Philipp S. D., Lis D. C., G´’usten R., Kasemann C., Klein T., Phillips T. G., 2006, A&A 454, 213
Pickett H.M., Poynter R.L., Cohen E.A., et al. , J. Quant. Spectrosc. & Rad. Transfer 60, 883.
R¨ollig, M. et al. 2007, A&A, 467, 187.
Schilke, P., Pineau des Forets, G., Walmsley, C. M. & Mart´ın-Pintado, J. 2001, A&A, 372, 291
Snyder, L. E., Hollis, J. M. & Ulich, B. L. 1976, ApJ, 208, L91 Snyder, L. E., Schenewerk, M. S. & Hollis, J. M. 1985, ApJ, 298, 360 Tielens, A.G.G.M. & Whittet, D.C.B. 1997, in Molecules in astrophysics:
probe and processes, ed. E.F. van Dishoeck (Dordrecht, Kluwer), 45
Troe, J. 2007, J. Phys. Chem., 111, 3868
Teyssier, D., Foss´e, D., Gerin, M., Pety, J., Abergel, A. & Roueff, E. 2004, A&A, 417, 135.
Tsuboi, T. & Hashimoto, K. 1981, J. Combust. Flame, 42
van Dishoeck, E. F. 1988, Rate Coefficients in Astrochemistry. Editors, T.J. Millar, D.A. Williams; Publisher, Kluwer Academic Publishers, Dordrecht, Boston, 49.
Watanabe, N. & Kouchi, A. 2002, ApJ, 571, L173, Willacy, K., & Williams, D.A. 1993, MNRAS, 260, 635.
Woodall, J., Ag´undez, M., Markwick-Kemper, A. J. & Millar, T. J. 2007, A&A, 466, 1197
Maryvonne Gerin et al.: HCO mapping of the Horsehead : Tracing the illuminated dense molecular cloud surfaces, Online Material p 2
Fig. 5. Medium angular resolution maps of the integrated intensity of the 4 hyperfine components of the fundamental transition of
HCO. These lines have been observed simultaneously at IRAM-30m. Maps have been rotated by 14◦counter–clockwise around the projection center, located at (δx, δy) = (20′′,0′′), to bring the illuminated star direction in the horizontal direction and the horizontal zero has been set at the PDR edge. The emission of all lines is integrated between 9.6 and 11.4 km s−1. Displayed integrated intensities are expressed in the main beam temperature scale. Contour levels are displayed on the grey scale lookup tables. The red vertical line shows the PDR edge and the green crosses show the positions (DCO+and HCO peaks) where deep integrations have been performed at IRAM-30m (see Fig. 2).