HAL Id: hal-01654750
https://hal.uca.fr/hal-01654750
Submitted on 7 Dec 2018
HAL is a multi-disciplinary open access
archive for the deposit and dissemination of sci-entific research documents, whether they are pub-lished or not. The documents may come from teaching and research institutions in France or abroad, or from public or private research centers.
L’archive ouverte pluridisciplinaire HAL, est destinée au dépôt et à la diffusion de documents scientifiques de niveau recherche, publiés ou non, émanant des établissements d’enseignement et de recherche français ou étrangers, des laboratoires publics ou privés.
Time-course of myelination and atrophy on cerebral
imaging in 35 patients with PLP1 -related disorders
Catherine Sarret, Jean-Jacques Lemaire, Davide Tonduti, Anna Sontheimer,
Jérôme Coste, Bruno Pereira, Fabien Feschet, Basile Roche, Odile
Boespflug-Tanguy
To cite this version:
Catherine Sarret, Jean-Jacques Lemaire, Davide Tonduti, Anna Sontheimer, Jérôme Coste, et al.. Time-course of myelination and atrophy on cerebral imaging in 35 patients with PLP1 -related dis-orders. Developmental Medicine and Child Neurology, Wiley-Blackwell, 2016, 58 (7), pp.706-713. �10.1111/dmcn.13025�. �hal-01654750�
Time-course of myelination and atrophy on cerebral imaging
in 35 patients with PLP1-related disorders
Catherine SARRET1,2 , Jean-Jacques LEMAIRE1,3 , Davide TONDUTI4,5 ,
Anna SONTHEIMER1 , Jérôme COSTE1 , Bruno PEREIRA1,6 , Fabien FESCHET1 ,
Basile ROCHE1 et Odile BOESPFLUG-TANGUY4,7
1 Image-Guided Clinical Neuroscience and Connectomics (IGCNC), Clermont University, University of Auvergne;
2 Department of Paediatrics, Clermont-Ferrand, University Hospital;
3 Department of Neurosurgery, Clermont-Ferrand University Hospital, Clermont-Ferrand; 4 Inserm U1141 Paris Diderot Sorbonne University–Paris, Cite DHU PROTECT, Robert Debre Hospital, Paris, France.
5 Department of Child Neurology, Neurological Institute C. Besta Foundation IRCCS, Milan, Italy.
6 Biostatistics Unit (DRCI), Clermont-Ferrand University Hospital, Clermont-Ferrand;
7 Department of Child Neurology and Metabolic Diseases; Leukodystrophies Reference Centre, Robert Debre Hospital, Paris, France.
Correspondence to Catherine Sarret at IGCNC, EA7282, Clermont-Ferrand University Hospital, 58 rue Montalembert, 63003 Clermont-Ferrand Cedex, France.
E-mail: csarret@chu-clermontferrand.fr.
Aim: Brain magnetic resonance imaging (MRI) motor development score (MDS) correlations
were used to analyze the natural time-course of hypomyelinating PLP1-related disorders (Pelizaeus-Merzbacher disease [PMD] and spastic paraplegia type 2).
Method: Thirty-five male patients (ranging from 0.7–43.5y at the first MRI) with PLP1-related
disorder were prospectively followed over 7 years. Patients were classified according to best motor function acquired before 5 years (MDS) into five categories (from PMD0 without motor acquisition to PMD4 with autonomous walking). We determined myelination and atrophy scores and measured corpus callosum area, volume of cerebellum, white matter and grey matter on 63 MRI.
Results: Age-adjusted multivariate analysis revealed that patients with PMD0-1 had
higherseverity atrophy scores and smaller corpus callosum area than did patients with PMD2 and PMD3-4. Myelination score increased until 12 years. There was evidence that the mean myelination differed in frontal white matter, arcuate fibres, and internal capsules among the groups. Most patients showed worsening atrophy (brain, cerebellum, corpus callosum), whereas grey matter and white matter proportions did not change.
Interpretation: Brain atrophy and myelination of anterior cerebral regions appear to be
pertinent biomarkers of motor development. The time-course of inter- and intra-individual cerebral white matter and grey matter atrophy suggests that both oligodendrocytes and neurons are involved in the physiopathology of PLP1-related disorders
INTRODUCTION
Pelizaeus-Merzbacher disease (PMD; OMIM 312080) and spastic paraplegia type 2 (SPG2; OMIM 312920) are prototypic inherited defects of central nervous system (CNS) myelin formation. This X-linked form of hypomyelinating leukodystrophy (HLD1, OMIM 312080) is caused by mutations of the proteolipid protein 1 gene (PLP1), which encodes the two major myelin proteins of the CNS, PLP and its spliced isoform DM20 in oligodendrocytes. The clinical findings associated with PLP1 mutations span a wide-spectrum continuum extending from severe congenital PMD forms to relatively mild late-onset SPG2 leading to the concept of PLP1-related disorders.1
PMD in males is characterized by early (<6mo) impairment of psychomotor development. In the first years of active myelination, hypotonia is associated with neurological signs gradually modifying as the CNS matures (nystagmus, choreoathetotic movements, ataxia). The large majority of patients improve during childhood. We classify them according to the best motor function achieved between the ages of 2 years and 5 years (motor developmental score, MDS) to demonstrate a genotype-phenotype correlation.1 PMD1 (head control) and PMD2 (sitting
position) are the most common forms and are usually associated with PLP1 duplications. Missense mutations are rare but usually cause the most severe forms without motor acquisitions and dystonia (PMD0 form, also named ‘congenital’ forms). PLP1 loss-of-function (null mutations and large deletions) leads to the mildest PMD3/PMD4 (or SPG2) forms with acquisition of walking capacities with/ without aid. Cognitive and behavioural development is also better preserved in mild forms.
The defect in CNS myelin formation is demonstrated by both dramatic and extensive abnormalities of multimodal evoked potentials in the CNS and a diffuse hypomyelinated pattern of the supratentorial white matter on magnetic resonance imaging (MRI).2 This ‘hypomyelinated’ pattern is characterized by a diffuse hypersignal of the white matter on T2-weighted and fluid-attenuated inversion recovery (FLAIR) sequences contrasting with a normal hypersignal or isosignal on T1-weighted sequences in comparison with grey matter. Clinical severity appears to correlate with degree of hypomyelination, and slow progression of myelination has been reported in the youngest patients.3–6 In parallel, local improvement of myelination was reported on MRIs of two out of four children classified with severe PMD after intra-cerebral grafting of neural stem cells, particularly at injection points.7
Progressive spastic paraplegia with pyramidal tract signs is subsequently observed in patients with both PMD and SPG2, leading to severe quadriplegia, amyotrophia, and optic atrophia at the end of the second–fourth decade and accompanied by the development of
cortico-subcortical atrophy on MRI and late cognitive decline.8 A recent large series of 50 males with PMD/SPG2 and 11 heterozygous females found a correlation between clinical severity and white matter atrophy of the whole brain and corpus callosum.9
However, there is still a dearth of MRI data on the natural time-course of PMD/SPG2. To address this gap, we set out to identify pertinent MRI biomarkers of disease evolution, through a prospective analysis of clinical exams and MRIs of 35 PLP1-mutated males with variable forms of PMD/SPG2, followed over 7 years.
METHOD
Patients
Thirty-five males from 32 families with PLP1 mutations were enrolled from January 2002 to December 2009 for prospective follow-up. MDS was determined according to the best motor development observed between 2 years and 5 years, adapted from Cailloux et al. and Inoue, as: no motor acquisition (PMD0), only head control (PMD1), sitting (PMD2), walking with aid (PMD3), or autonomous walking (PMD4).1,10 Clinical follow-up was carried out by an experienced neuropaediatrician (OB-T) at each visit to our medical centre . All patients had at least one MRI (named MRI-1), and 17 patients had repeat MRIs (nine patients twice, five patients three times, and three patients four times) at a minimal interval of 1 year using the same MRI protocol at the same medical centre.
MRI data, image processing, and biomarkers
Images were acquired on a 1.5-Tesla Siemens MR scanner, as follows: axial, sagittal, and coronal slices; T1-weighted, T2-weighted, and FLAIR sequences (Fig. 1). Anonymized series were co-registered and aligned with the anterior commissure-posterior commissure (ACPC) line (Iplan 3.0; Brainlab, Feldkirchen, Germany). Biomarkers explored across MRI data were atrophy and myelination scores, quantitative evaluation of corpus callosum area, volumes of cerebellum and white matter/grey matter compartments.
Atrophy and myelination scores: Myelination score (Table I) was determined by an adaptation
of Plecko et al.’s scheme.6 White matter signal was qualified in different regions-of-interest as hyper-, iso-, or hypointense compared with grey matter signal, on T1-weighted, T2weighted, and FLAIR images. Myelination scores were determined from all MRI and expressed as percentage of expected myelination according to age. Atrophy score (Table I) is a
semi-quantitative score obtained on classical MRI interpretation by radiologists. To limit subjectivity in interpretation, the atrophy scores were determined in a blind way by two neuropaediatricians (CS and DT).
CNS segmentation, surface and volume measurements: These were performed using Iplan 3.0
on FLAIR slices as white matter-grey matter signal contrast was visually maximal. Corpus callosum and cerebellum segmentation was determined manually (Fig. 1). Total intracranial volume (TIV) was determined instead of strict brain volume to take into account the brain growth in young patients and the predictable white as well as grey matter atrophy. TIV, white matter and grey matter compartments were determined and extracted automatically (Statistical Parametric Mapping 8, Wellcome Trust Centre for Neuroimaging, London, UK; Matlab 7.0, Mathworks, Sherborn, MA, USA). Grey matter and white matter maps (dicomizer AVIZO software, Visualization Sciences Group, FEI, US) were co-registered with ACPC-aligned MRI series. Corpus callosum area/TIV ratio, cerebellum volume/TIV ratio, white matter compartment/ TIV ratio and grey matter compartment/TIV ratio were calculated, to account for brain growth over time.
Statistical analysis
Statistical analysis was performed using Stata 13 (StataCorp, College Station, TX, USA). The tests were twosided, with a type-I error set at a=0.05. Quantitative data, expressed as mean and standard deviation or median and interquartile range according to statistical distribution, were compared between independent groups (PMD0-1, PMD2, and PMD3-4) using a Kruskal– Wallis test followed by the appropriate post-hoc Dunn’s test. An ANCOVA (analysis of covariance) was performed with age as the adjustment covariate. The assumption of the normality of residuals was also studied using the Shapiro–Wilk test. Our data not exhibiting normal distributions, a log-transformation was proposed to achieve normality of several variables and to allow the correct use of these analyses. As proposed by some statisticians, we chose to report all the individual p-values without doing any mathematical correc tion for distinct tests comparing groups.11 A particular focus was given to the magnitude of improvement and to the clinical relevance.12
A longitudinal descriptive survey was led over a maximum of 7 years according to availability of MRI and biomarker data.
The study secured written informed consent from all parents and was approved by the relevant French institutional review boards (CPP Sud-Est VI No. AU788, CNIL No. 1406552, AFSSAPS No. B90298-60).
Figure 1: Magnetic resonance imaging of patients with Pelizaeus-Merzbaher disease
(PMD)/spastic paraplegia type 2 (SPG2); severe (PMD0; top row), intermediate (PMD2; intermediate row), and mild (PMD4; bottom row) forms. T1-weighted (a–c), T2-weighted (d–f), and fluid-attenuated inversion recovery (FLAIR) (g–i) axial slices, anterior commissure-posterior commissure aligned, showing different degrees of hypomyelination according to motor development score. Corpus callosum manual segmentation on midline FLAIR (j–k) and T1-weighted (l) sagittal slices. Manual segmentation of cerebel lum on FLAIR axial slices (m– o) through the middle cerebellar peduncle.
RESULTS
Table II summarizes patient MDS, genotype, and age at MRI acquisition. The population consisted of 19 duplicated patients and 16 patients with point mutation (Table II). In total, we had 63 structural MRI available in 35 patients. Mean age at MRI-1 was 11.77.8 years (median 10.9y; range 0.7–43.5y). Table III gives mean and median ages in each group.
Myelination and atrophy scores
Myelination (on 62 MRIs) and atrophy scores (on 63 MRIs) were calculated from 35 patients. The results of 35 MRI-1 were analyzed according to MDS using three groups PMD0-1, PMD2, and PMD3-4. There was no evidence of a difference in mean gross total myelination scores between the three groups, whereas the mean atrophy scores were more severe in
Patient 10 at 8.5y Patient 21 at 9.5y Patient 22 at 16.2y (a) (b) ) c ( (d) (e) f () (g) h) ( (i) ) j ( k) ( (l) ) m ( (n) (o)
patients with PMD0-1 than in patients with PMD2 and PMD3-4 (PMD2, p=0.033; PMD3-4, p=0.040) (Table III).
CNS, central nervous system; FLAIR, fluid-attenuated inversion recovery.
Analysis led on the subgroup of 17 patients who had successive MRIs revealed that atrophy scores increased over time in 82% of patients (14/17) (Fig. 2a). Progressive atrophy was never observed before 5 years and was only present between 5 years and 7 years in two patients with PMD2 and one patient with PMD3. For the remaining patients, atrophy increased by 8.72% between 10 years and 20 years. In contrast, total myelination score clearly improved for 7/17 patients after the expected age of 2 years of complete myelination in normal children (Fig. 2b). This increase was observed in the four patients with PMD2 and one patient with
Table I: Atrophy and myelination scoring
Atrophy score Myelination score CNS regions and characterization CNS regions
Corpus callosum atrophy Subcortical white matter (Arcuate fibres)
Lobar (deep) white matter atrophy Lobar (deep) white matter Frontal
Lateral ventricule enlargement Temporal
Subarachnoid space enlargement Parietal
Cerebellar hemisphere atrophy Occiptal
Pons atrophy Corpus callosum Fourth ventricule enlargement Internal capsule
Cerebellar white matter Pons
Anterior limb Posterior limb
Quantitative score for each region Quantitative score for each region
No atrophy or enlargement 0 Characterization of white matter signal versus grey matter signal
Moderate atrophy or enlargement 1 T1-weighted T2-weighted FLAIR
Intermediate atrophy or enlargement 2 hypo hyper hyper 0
Severe atrophy or enlargement 3 iso hyper hyper 1
hyper hyper hyper 2
hyper iso hyper 3
hyper hypo hyper 4
hyper hypo iso 5
hyper hypo hypo 6
Total score Total score
Minimal score (no atrophy) 0 Minimal score (no myelination) 0 Maximal score (maximal atrophy) 21 Maximal score (achieved myelination) 60
PMD3 analysed between 3 years and 7 years, but also for two patients (one PMD2 and one PMD3) between 7 years and 12 years. In the 10 remaining patients analysed after 7 years, myelination score remained stable except in one patient with PMD3 whose myelination score decreased during adolescence over a period of 6.5 years. Inter-individual variability was particularly visible in the PMD3-4 group (10 patients).
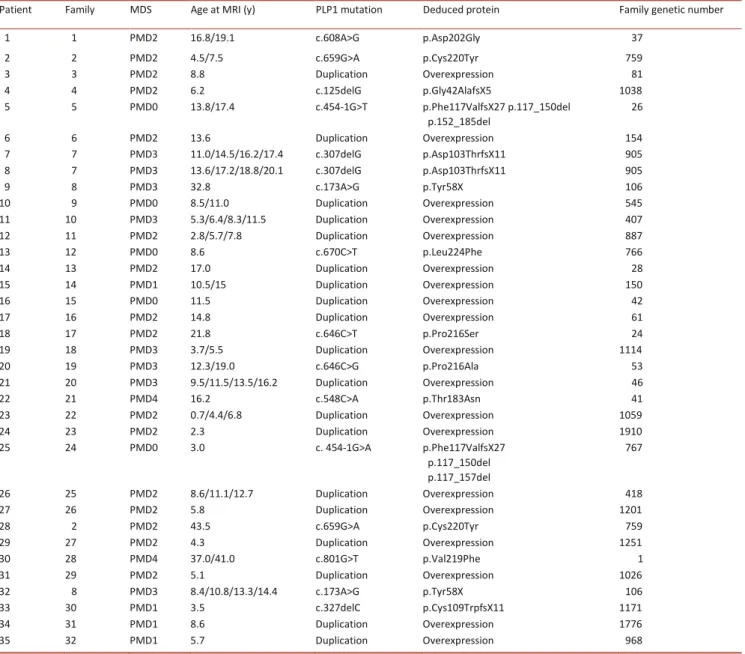
Motor developmental score (MDS), age (y) at magnetic resonance imaging (MRI), genotype (at the DNA level) and deduced protein. Family genetic number corresponds to our laboratory family number and refers to previous publication.1
We then considered the myelination score of the 10 individual white matter regions determined at MRI-1 in the different groups of patients. After adjusting for age, there was evidence that the mean myelination differed in only three regions. The frontal white matter
Table II: List of patients and families with Pelizaeus-Merzbacher disease (PMD)/spastic paraplegia type 2
Patient Family MDS Age at MRI (y) PLP1 mutation Deduced protein Family genetic number
1 1 PMD2 16.8/19.1 c.608A>G p.Asp202Gly 37 2 2 PMD2 4.5/7.5 c.659G>A p.Cys220Tyr 759 3 3 PMD2 8.8 Duplication Overexpression 81 4 4 PMD2 6.2 c.125delG p.Gly42AlafsX5 1038 5 5 PMD0 13.8/17.4 c.454-1G>T p.Phe117ValfsX27 p.117_150del p.152_185del 26 6 6 PMD2 13.6 Duplication Overexpression 154 7 7 PMD3 11.0/14.5/16.2/17.4 c.307delG p.Asp103ThrfsX11 905 8 7 PMD3 13.6/17.2/18.8/20.1 c.307delG p.Asp103ThrfsX11 905 9 8 PMD3 32.8 c.173A>G p.Tyr58X 106 10 9 PMD0 8.5/11.0 Duplication Overexpression 545 11 10 PMD3 5.3/6.4/8.3/11.5 Duplication Overexpression 407 12 11 PMD2 2.8/5.7/7.8 Duplication Overexpression 887 13 12 PMD0 8.6 c.670C>T p.Leu224Phe 766 14 13 PMD2 17.0 Duplication Overexpression 28 15 14 PMD1 10.5/15 Duplication Overexpression 150 16 15 PMD0 11.5 Duplication Overexpression 42 17 16 PMD2 14.8 Duplication Overexpression 61 18 17 PMD2 21.8 c.646C>T p.Pro216Ser 24 19 18 PMD3 3.7/5.5 Duplication Overexpression 1114 20 19 PMD3 12.3/19.0 c.646C>G p.Pro216Ala 53 21 20 PMD3 9.5/11.5/13.5/16.2 Duplication Overexpression 46 22 21 PMD4 16.2 c.548C>A p.Thr183Asn 41 23 22 PMD2 0.7/4.4/6.8 Duplication Overexpression 1059 24 23 PMD2 2.3 Duplication Overexpression 1910 25 24 PMD0 3.0 c. 454-1G>A p.Phe117ValfsX27 p.117_150del p.117_157del 767 26 25 PMD2 8.6/11.1/12.7 Duplication Overexpression 418 27 26 PMD2 5.8 Duplication Overexpression 1201 28 2 PMD2 43.5 c.659G>A p.Cys220Tyr 759 29 27 PMD2 4.3 Duplication Overexpression 1251 30 28 PMD4 37.0/41.0 c.801G>T p.Val219Phe 1 31 29 PMD2 5.1 Duplication Overexpression 1026 32 8 PMD3 8.4/10.8/13.3/14.4 c.173A>G p.Tyr58X 106 33 30 PMD1 3.5 c.327delC p.Cys109TrpfsX11 1171 34 31 PMD1 8.6 Duplication Overexpression 1776 35 32 PMD1 5.7 Duplication Overexpression 968
(p=0.029) and anterior limb of the internal capsule (p=0.045) appeared less achieved in patients with PMD0-1 than patients with PMD3-4. Myelination of arcuate fibres (U fibres) was less achieved in patients with PMD0-1 (p=0.046) and PMD2 (p=0.045) than in patients with PMD3-4 (Table III) despite very poor U-fibre myelination scores in all groups. Interindividual variability in the regional myelination scores was particularly visible in the PMD3-4 group.
These results showed that in PLP1-related disorders, the MDS that we had previously used to demonstrate a genotype-phenotype correlation is strongly correlated with the MRI atrophy score used here. Myelination scores for frontal white matter and to a lesser extent the anterior limb of the internal capsule and U-fibres partially segregated the different severity groups. Follow-up MRIs performed in 50% of our 35 patients demonstrated that myelination scores can improve actively between 3 years and 7 years and more rarely and to a lesser extent between 7 years and at least 12 years. During adolescence, myelination scores remain stable whereas atrophy scores clearly increase. We then quantified different white matter and grey matter structures to better assess this atrophic process.
Quantification of white matter and grey matter structures
We first quantified the area/volume ratios of two structures known to change during the active phase of myelin development: the corpus callosum, a pure white matter structure, and the cerebellum including white matter and grey matter (Fig. 1). Considering the 35 MRI-1, we found that mean corpus callosum area/TIV ratio was statistically smaller in patients with PMD0-1 than in patients with PMD3-4 after adjustment for age (p=0.017; Table III). However, both corpus callosum area/TIV ratio and cerebellum volume/TIV ratio decreased in 88% (n=15) and 76% (n=13), respectively, of the 17 patients that underwent successive MRI (Fig. 2c, d).
Automated segmentation of white matter and grey matter on FLAIR sequences was effective for 27 MRI in 22 patients, including all groups of patients. There was no evidence of a difference in mean white matter and grey matter compartments between the different severity groups (Table III). The grey matter compartment was usually twice as large as the white matter compartment. Two successive MRIs were interpretable in 5/22 analyzable patients. White matter and grey matter compartments remained stable over time except in two patients (one patient with PMD0 and one patient with PMD2) who underwent two successive MRI at adolescence, in whom white matter compartment/TIV ratio decreased.
These results suggest that in PLP1-mutated patients, corpus callosum area, but not its myelination level, is correlated with severity of impairment of motor milestones. Interestingly, cerebellum atrophy tends to occur over time in parallel with the corpus callosum atrophy,
whereas the white matter compartment, despite its severe defect, tends to remain stable compared to the grey matter compartment, at least until adolescence.
Table III: Results of statistical analyses for the different biomarkers
PMD0–1 PMD2 PMD3–4 Omnibus p-value
Number of patients 9 16 10
Mean age in years (SD) 8.19 (3.59)10.96 (10.67)14.98 (11.17)0.29 Median age in years (interquartile range) 8.60 (4.8) 7.4 (11–4)11.65 (7–8) Percentage of myelination score according to agea 29.44 (16.27)35.12 (12.98)41.40 (20.91)0.36
Versus PMD0-1 (p-value) 0.366 0.074
Versus PMD2 (p-value) 0.290
Atrophy scorea 7.77 (4.06) 5.62 (3.99) 6.50 (4.48) 0.34
Versus PMD0-1 (p-value) 0.033 0.040
Versus PMD2 (p-value) 0.830
Corpus callosum area/TIV (104)a 5.36 (2.11) 6.50 (2.22) 7.31 (3.05) 0.11
Versus PMD0-1 (p-value) 0.136 0.017
Versus PMD2 (p-value) 0.180
Cerebellum volume/TIV (102)a 8.14 (1.19) 8.06 (1.54) 8.17 (1.22) 0.98
Versus PMD0-1 (p-value) 0.650 0.145
Versus PMD2 (p-value) 0.210
Percentage of expected myelination – frontal white mattera 15.89 (18.69)24.93 (24.26)36.60 (29.17)0.16
Versus PMD0-1 (p-value) 0.270 0.029
Versus PMD2 (p-value) 0.140
Percentage of expected myelination – temporal white mattera 24.11 (14.54)32.25 (20.50)40.00 (25.02)0.25
Versus PMD0-1 (p-value) 0.281 0.060
Versus PMD2 (p-value) 0.260
Percentage of expected myelination – parietal white mattera 29.44 (7.06)33.13 (20.15)31.60 (12.14)0.92
Versus PMD0-1 (p-value) 0.491 0.566
Versus PMD2 (p-value) 0.970
Percentage of expected myelination – occipital white mattera 20.22 (16.02)26.94 (24.18)31.40 (22.74)0.50
Versus PMD0-1 (p-value) 0.326 0.113
Percentage of expected myelination – arcuate fibresa 1.00 (1.00) 1.06 (0.85) 2.10 (1.73)0.16
Versus PMD0-1 (p-value) 0.840 0.046
Versus PMD2 (p-value) 0.035
Percentage of expected myelination – ant limb internal capsulea 24.22 (11.89)32.44 (16.46)43.40 (24.99)0.13
Versus PMD0-1 (p-value) 0.318 0.045
Versus PMD2 (p-value) 0.180
Percentage of expected myelination – post limb internal capsulea 35.00 (35.74)35.25 (19.26)38.10 (22.32)0.83
Versus PMD0-1 (p-value) 0.985 0.808
Versus PMD2 (p-value) 0.790
Percentage of expected myelination – corpus callosuma 31.56 (25.43)44.81 (24.04)45.10 (26.04)0.33
Versus PMD0-1 (p-value) 0.225 0.276
Versus PMD2 (p-value) 0.980
Percentage of expected myelination – cerebellar white mattera 31.67 (17.39)50.00 (30.16)45.10 (33.14)0.36
Versus PMD0-1 (p-value) 0.081 0.146
Versus PMD2 (p-value) 0.910
Percentage of expected myelination – pons white mattera 64.78 (35.67)70.75 (26.11)68.20 (31.84)0.96
Versus PMD0-1 (p-value) 0.638 0.793
Versus PMD2 (p-value) 0.860
Sample size for grey matter and white matter evaluation 3 11 3
Grey matter compartment/TIVa 0.41 (0.12) 0.36 (0.04) 0.42 (0.14) 0.74
Versus PMD0-1 (p-value) 0.349 0.826
Versus PMD2 (p-value) 0.240
White matter compartment/TIVa 0.19 (0.06) 0.17 (0.03) 0.24 (0.11) 0.55
Versus PMD0-1 (p-value) 0.621 0.297
Versus PMD2 (p-value) 0.070
a Results are expressed as mean values (SD); bold face for p<0.05; ant, anterior; post,
posterior. Omnibus p-value obtained without age adjustment (Kruskall–Wallis test) whereas other p-values were performed using ANCOVA (analysis of covariance) with age as the adjustment covariate. Effect sizes with 95% confidence interval are given in Table SI. PMD, Pelizaeus-Merzbacher disease; TIV, total intracranial volume.
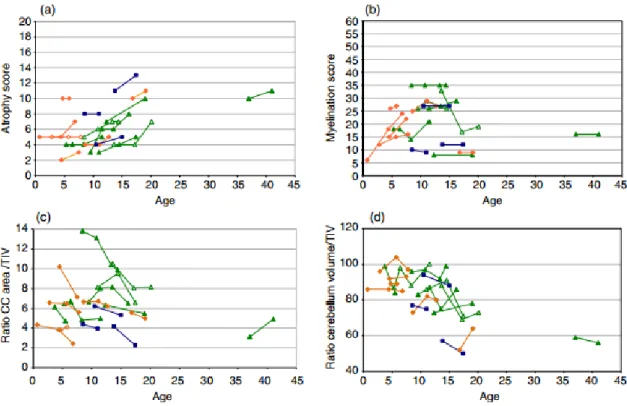
Figure 2: Inter- and intra-individual magnetic resonance imaging (MRI) evolution over time
in the subgroup of 17 patients with successive MRIs. Atrophy scores (a; y-axis; from 0, no atrophy, to 21, maximal atrophy) and myelination score (b; y-axis; from 0, no myelination to 60, achieved myelination) according to age (x-axis; years); atrophy tends to increase over time, and myelination tends to increase until 12 years before stabilizing as patients get older. Corpus callosum area/total intracranial volume (TIV) ratios (c; y-axis) according to the age (x-axis; years); note inter- and intra-individual progressive corpus callosum atrophy over time. Cerebellum volume/TIV ratios (d; y-axis) according to age (x-axis; years); note inter- and intra-individual progressive cerebellum atrophy over time. Blue squares: Pelizaeus-Merzbacher disease (PMD)0-1 orange diamonds: PMD2; green triangles: PMD3-4.
Several patients are represented with empty symbols for visibility.
DISCUSSION
We analyzed cerebral MRIs performed at the same medical centre at a mean age of 12 years on a large cohort of PLP1-mutated male patients. The 35 patients included were representative of the broad clinical spectrum of severity usually described in the PMD/SPG2 phenotype. We used MDS that we had previously demonstrated to correlate to the genotype.1 MRI follow-up was possible in half of them, with 45 successive MRIs.
Our results show that MDS is more correlated to gross atrophy score than to gross myelination score. Looking at the frontal and anterior capsule, atrophy score seems to increase over time, which is consistent with results from a small series of patients with PMD,13,14 as well as a recent large series made up of male patients with PMD and
pauci-symptomatic heterozygous females.9
We found that atrophy in patients with PMD0-1 affects the corpus callosum, a pure white matter myelinated anatomic neuron body-free structure. This is in agreement with Laukka et al., suggesting a link between clinical severity and abnormal corpus callosum development.9
We also found intra-individual change in atrophy over time, which would make the corpus callosum a potentially good morphological marker both for motor development and for disease progression with age. Corpus callosum atrophy of the most severe patients is also suggestive of global white matter loss in patients with PMD/SPG2.9 However, we were unable to find a correlation between MDS and white matter fraction despite a segmentation of 43% of the MRI, including all groups of patients. This might be because of the sample size. FLAIR sequences on MRI were well contrasted in all patients. The difficulties to segment white matter using SPM were more related to the quality of the FLAIR sequences during the MRI acquisition, particularly because of artefact movements of the head in link with patients’ ataxia. Laukka et al.9 also struggled with automated segmentation in patients with PMD and so had to perform meticulous manual segmentation of the white matter, which might be particularly impracticable in routine. Another hypothesis would be that proportions of white matter and grey matter compartments remain stable whatever the global brain atrophy, suggesting a mechanism of both neuronal and myelin atrophy in PMD/SPG2. This hypothesis is coherent with neuropathological data in patients with PMD/SPG2,15 clinical data in patients with SPG2 with length-dependent axonal degeneration,16 and data in animal models17,18 that have already shown a clear involvement of neurons in the physiopathology of PLP1related disorders. It has been suggested that the underlying process could be a secondary axonal suffering19 or a direct neuronal PLP1 pathological expression in neurons.20,21 Two patients had an apparent loss of white matter after 15 years of age. This white matter loss was simultaneously associated with severe global atrophy, severe corpus callosum atrophy, and a mild increase in global and cerebellar atrophy over time. This result suggests there could be a delay in global white matter atrophy compared with the corpus callosum atrophy. The corpus callosum is known to be an early myelinated and very compacted structure. Global white matter atrophy may follow the corpus callosum atrophy in the time-course of the disease.
The absence of correlation between cerebellum volume and developmental score in our series argues against the cerebellum as a biomarker for motor development. However, cerebellum atrophy has been reported in severe PMD.16 In addition, neuronal loss affecting particularly thalamic, hippocampal, and cerebellar neurons (Purkinje cells and neurons of the dentate nuclei) was reported on brain examination in different forms of PMD/SPG2, suggesting that
cerebellum atrophy would be caused not only by white matter injury but also by grey matter loss.15
Nevertheless, we found that cerebellum atrophy could increase over time. Interestingly, cerebellum volume decreased not only in an inter-individual manner from 5 years old but also in an intra-individual manner on the MRI follow-up. A recent study in children with typical development reported that cerebellum volume increases until the beginning of adolescence and then tends to decrease slightly thereafter.22 These results point to cerebellum volume as
a good marker for progressive grey matter and white matter injury with age in PMD/SPG2. We failed to find a relationship between developmental score and global hypomyelination at the first MRI with adjustment to age, even though hypomyelination is the main neuropathological feature in PMD15 and orientates the diagnosis on cerebral MRI.2 This lack
of relationship may be because of lack of power in our study, but either way, this putative link remains controversial.4–6 Nevertheless, hypomyelination of frontal white matter, anterior limb of the internal capsule, and arcuate fibres was correlated to MDS, showing that the most anterior and late-myelinated regions are more affected in PMD/SPG2. Furthermore, intra-individual MRI follow-up revealed slight myelination progression until 12 years in five patients with classical and mild PMD, whereas no progression was observed in older patients. To confirm myelination progression in the earliest MRIs, we also analysed MRIs performed before (n=10 patients) and later than (n=7 patients) our study in patients including all severity scores (Fig. S1). We again found a slow progression of myelination until 12 years even in the most severe patients, whereas there was no global change in myelination in older patients. These findings are in agreement with MRI data already reported in young patients with classical and mild PMD.6 This spontaneous progression of myelination during the first years of life might be
of utmost importance for future therapeutic trials. For instance, the interpretation of patchy progression of brain myelination in young patients with PMD after local injections of neural stem cells warrants extreme caution.7
In conclusion, this study highlights that not just hypomyelination but also brain atrophy are major features on MRI in PMD/SPG2. Myelination progression may be informative during the early years of life, but motor development score was more correlated to markers of atrophy. Corpus callosum and cerebellum volumes may be good intra-individual markers of disease progression with age.
These findings could well be important for PMD/SPG2 patient follow-up in future therapeutic trials.
ACKNOWLEDGEMENTS
The authors thank the members of the Leukotreat European Consortium. The authors have stated that they had no interests that might be perceived as posing a conflict or bias.
SUPPORTING INFORMATION
The following additional material may be found online:
Table SI: Additional results of statistical analyses for the different biomarkers.
Figure S1: Evolution of myelination score in PMD and SPG2 patients considering previous and
later MRI.
References
1. Cailloux F, Gauthier-Barichard F, Mimault C, et al.Genotype-phenotype correlation in inherited brain
myelination defects due to proteolipid protein gene mutations. Clinical European Network on Brain Dysmyelinating Disease. Eur J Hum Genet 2000; 8: 837–45.
2. Steenweg ME, Vanderver A, Blaser S, et al. Magneticresonance imaging pattern recognition in hypomyelinating
disorders. Brain 2010; 133: 2971–82.
3. van der Knaap MS, Valk J. Myelination and retardedmyelination. In: van der Knaap MS, Valk J, editors.
Magnetic Resonance of Myelin, Myelination, and Myelin Disorders. Berlin: Springer-Verlag, 1995: 31–52.
4. Nezu A, Kimura S, Takeshita S, et al. An MRI andMRS study of Pelizaeus-Merzbacher disease. Pediatr Neurol
1998; 18: 334–37.
5. Takanashi J, Sugita K, Tanabe Y, et al. MR-revealedmyelination in the cerebral corticospinal tract as a marker
for Pelizaeus-Merzbacher’s disease with proteolipid protein gene duplication. Am J Neuroradiol 1999; 20: 1822–28.
6. Plecko B, Stockler-Ipsiroglu S, Gruber S, et al. Degree€ of hypomyelination and magnetic resonance
spectroscopy findings in patients with Pelizaeus-Merzbacher phenotype. Neuropediatrics 2003; 34: 127–36.
7. Gupta N, Henry RG, Strober J, et al. Neural stem cellengraftment and myelination in the human brain. Sci
Transl Med 2012; 4: 155ra137.
8. Boespflug-Tanguy O, Labauge P, Fogli A, Vaurs-BarriereC. Genes involved in leukodystrophies: a glance at
glial functions. Curr Neurol Neurosci Rep 2008; 8: 217–29.
9. Laukka JJ, Stanley JA, Garbern JY, et al. Neuroradio-logic correlates of clinical disability and progression in
the X-linked leukodystrophy Pelizaeus-Merzbacher disease. J Neurol Sci 2013; 335: 75–81.
10. Inoue K. PLP1-related inherited dysmyelinating disor-ders: Pelizaeus-Merzbacher disease and spastic
paraplegia type 2. Neurogenetics 2005; 6: 1–16.
11. Rothman KJ. No adjustments are needed for multiplecomparisons. Epidemiology 1990; 1: 43–46.
12. Feise RJ. Do multiple outcome measures require p-valueadjustment? BMC Med Res Methodol 2002; 2: 8. 13. Wang PJ, Young C, Liu HM, et al. Neurophysiologicstudies and MRI in Pelizaeus-Merzbacher disease:
comparison of classic and connatal forms. Pediatr Neurol 1995; 12: 47–53.
14. Biancheri R, Grossi S, Regis S, et al. Further genotype-phenotype correlation emerging from two families with
15. Sima AA, Pierson CR, Woltjer RL, et al. Neuronal lossin Pelizaeus-Merzbacher disease differs in various
mutations of the proteolipid protein 1. Acta Neuropathol 2009; 118: 531–39.
16. Garbern JY, Yool DA, Moore GJ, et al. Patients lackingthe major CNS myelin protein, proteolipid protein 1,
develop length-dependent axonal degeneration in the absence of demyelination and inflammation. Brain 2002; 125: 551–61.
17. Miller MJ, Haxhiu MA, Georgiadis P, et al. Proteolipidprotein gene mutation induces altered ventilatory response
to hypoxia in the myelin-deficient rat. J Neurosci 2003; 23: 2265–73.
18. McLaughlin M, Barrie JA, Karim S, et al. Processing ofPLP in a model of Pelizaeus-Merzbacher disease/SPG2
due to the rumpshaker mutation. Glia 2006; 53: 715–22.
19. Anderson TJ, Schneider A, Barrie JA, et al. Late-onsetneurodegeneration in mice with increased dosage of the
proteolipid protein gene. J Comp Neurol 1998; 394: 506– 19.
20. Bongarzone ER, Campagnoni CW, Kampf K, et al.Identification of a new exon in the myelin proteolipid protein
gene encoding novel protein isoforms that are restricted to the somata of oligodendrocytes and neurons. J Neurosci 1999; 19: 8349–57.
21. Sarret C, Combes P, Micheau P, et al. Novel neuronalproteolipid protein isoforms encoded by the human myelin
proteolipid protein 1 gene. Neuroscience 2010; 166: 522–38.
22. Kosar MI, Karacan K, Otag I, et al. Determination ofcerebellar volume in children and adolescents with magnetic