HAL Id: hal-00001739
https://hal.archives-ouvertes.fr/hal-00001739v2
Preprint submitted on 25 Oct 2004
HAL is a multi-disciplinary open access archive for the deposit and dissemination of sci-entific research documents, whether they are pub-lished or not. The documents may come from teaching and research institutions in France or abroad, or from public or private research centers.
L’archive ouverte pluridisciplinaire HAL, est destinée au dépôt et à la diffusion de documents scientifiques de niveau recherche, publiés ou non, émanant des établissements d’enseignement et de recherche français ou étrangers, des laboratoires publics ou privés.
A spectral line shape analysis of motional stark effect
spectra
L. Godbert-Mouret, M. Koubiti, Yannick Marandet, J. Rosato, F. Rosmej, R.
Stamm, P. Lotte, C. Fenzi, H. Capes, L. Bureyeva, et al.
To cite this version:
L. Godbert-Mouret, M. Koubiti, Yannick Marandet, J. Rosato, F. Rosmej, et al.. A spectral line shape analysis of motional stark effect spectra. 2004. �hal-00001739v2�
A spectral line shape analysis of Motional Stark Effect spectra
L. Godbert-Mouret(1), M. Koubiti(1), Y. Marandet(1), J. Rosato(1), F. Rosmej(1), R. Stamm(1) P. Lotte(2), C. Fenzi(2), H.Capes(2)
L. Bureyeva(3), V. Lisitsa(4)
1 Physique des Interactions Ioniques et Moléculaires, UMR 6633 CNRS-Aix Marseille 1, Centre de Saint-Jérôme, F-13397 Marseille, France
2 Département de Recherches sur la Fusion Contrôlée, Association EURATOM-CEA Cadarache, 13108 Saint Paul lez Durance Cedex, France
3 Institute of Spectroscopy of the RAS, Troitsk, Moscow Region, 142190, Russia 4 Russian Research Center “Kurchatov Institute”, 123182 Moscow, Russia
Abstract
Recent observations of MSE spectra carried out on Tore-Supra show discrepancies between experimental and theoretical intensities calculated at equilibrium. We present here a kinetic model, based on the selectivity of excitation cross sections of Stark states in the parabolic basis. Redistribution due to ion-atom collisions among Stark states of level n=3 allow to calculate the population of Stark states. This model permits to improve significantly the agreement between measured and calculated MSE spectra.
1. Introduction
The Motional Stark Effect is a well established technique for measuring the direction of the magnetic field profile in magnetized plasma devices equipped with neutral beams. Polarimetry measurements of the direction of the linearly polarized π and/or σ components have been used on different tokamaks [1,2,3] to obtain the magnetic field pitch angle and hence the safety factor or the current density profiles. Alternative analyses consist either in combining the polarization with other spectral information [4], or in exploiting the full observed spectra by a comparison to a theoretical line shape model including the main processes dominating the line formation. Discrepancies between the observed and calculated intensity ratios of π and σ lines have however sometimes been observed [1]. In this work we analyze different phenomena which have to be taken into account for a precise evaluation of the spectra. For some beam or plasma conditions, the spectral line shapes may indeed be affected by population effects, and thus perhaps also the π and σ ratio. We propose in the following a simple model for the excitation and collisional mechanisms populating the upper atomic level from which the observed radiation is emitted. Comparisons with spectra recently observed on the Tore-Supra tokamak will be discussed.
2. Line formation of H
αααα
in a Motional Stark Effect Experiment
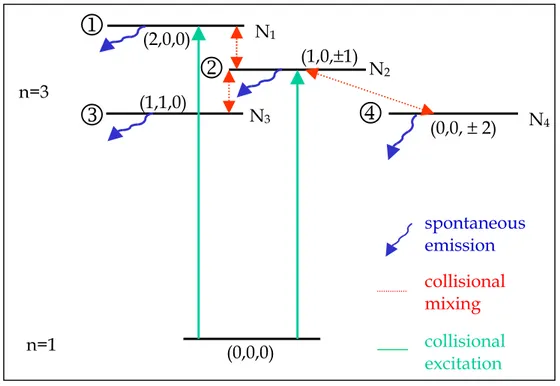
A motional Stark effect experiment uses the propagation of a typically 25-100 keV neutral hydrogen (or deuterium) beam injected in the plasma core. Beam neutrals are excited by collisions with the background plasma ions and electrons to higher levels whose de-excitation leads in particular to the emission of the Balmer-α line. In a magnetically confined plasma, observed Balmer-α spectra exhibit a strong Stark effect resulting from the Lorentz electric field |E|=|vbeamxB| experienced by the beam particles in their own frame. A realistic analysis of the collisional and radiative processes populating the atomic levels has to be done by using atomic states modified by the Lorentz electric field. An adequate description of such atomic states is provided by the parabolic quantum numbers n1,n2,m describing accurately the hydrogen atom in an electric field for cases where fine structure effects are negligible [5]. Parabolic numbers satisfy n1≥0, n2≥0, and n=n1+n2+|m|+1 where n and m are the usual principal and magnetic quantum numbers. Using this parabolic representation, we will evaluate the collisional excitation rates of hydrogen atoms from the ground state n=1, to the different states of the upper level n=3 from which the Balmer-α line is emitted. For this evaluation, we consider only collisions between beam neutrals and plasma ions [1], and we will assume that this excitation cross sections may be calculated in a first order Born approximation. We retain in our calculation the effect of the Lorentz field on the neutral, and consider that the dominant interaction is between the atomic dipole and the ion field. This model results in excitation cross sections which are proportional to the oscillator strengths of transitions between states of the ground and upper atomic levels. This means that the excitation rates are proportional to the intensities of the Stark transitions between the ground state n=1 and states of level n=3. It is well known that Stark transitions are strongly selective with regard to the value of the parabolic quantum number. If we look for instance to the excitation of the unshifted states (1,1,0) and (0,0,±2) of n=3, we find that the rates of their collisional excitation from the ground state are strictly equal to zero [1]. These states are thus only accessible by cascade from levels higher than n=3, or by a collisional redistribution: cf. figure 1. The rates of collisional redistribution between the states of level n=3 may be estimated by the following impact operator:
= Φ W D e r r m ρ ρ π ln . v N 3 4 h 2rr (1)
In this expression N and v are the ion density and relative velocity, rris the position operator of the atomic electron expressed in atomic units while ρD and ρW are respectively the Debye length and a strong collision radius [6,7]. For tokamak plasmas, typical values of the coulomb logarithm ln(ρD/ρW)are ~10. The matrix elements of the operator rr.rr may be expressed in parabolic coordinates [7] for the level n=3. Non zero matrix elements of this operator determine the dominant collisional coupling between states of the same level (n=3), and lead to a simple kinetic model for their populations.
Figure 1. Excitation and de-excitation processes of Stark states of level n=3. The populations Ni
of these states are described in section 3.
3. Kinetic modeling of the Stark state populations
To illustrate the effect of state mixing by ion collisions on the intensities of the Hα components, let us consider the atomic system shown in figure 1. As levels n=3 and n=2 split respectively into 5 and 3 distinct states (distinct energies) in the presence of an electric field, the Hα line splits into 15 components but only 9 have significant intensities to be observed: an unshifted σ0 component together with one σ and three π components (π2, π3 and π4) on its both sides [1]. Note that the system shown in figure 1 contains only the states involved in the blue shifted Stark components of Hα, the red shifted components being symmetric to the blue shifted ones.
Let us for simplicity approximate the rr.rr operator matrix elements in Eq. (1) by n4 with n=3. Then the non diagonal matrix elements of the collision operator Φ are all equal to a parameter γ for any couple of Stark states (n1,n2,m) and (n'1,n'2,m'). Consequently, the populations of the Stark states within level n=1 can be described by the following set of equations: = + = + + + + = + + = + γ γ γ γ γ γ γ γ 2 4 4 2 3 3 2 3 2 1 2 2 1 2 1 1 ) ( ) ( ) ( ) 3 ( ) ( N A N N A N q N N N A N q N A N (2)
where the Ai’srepresent the total spontaneous emission rates from the four states, while q1 and q2 stand for excitation rates by ion collisions from the ground state (0,0,0), to the shifted states (2,0,0) and (1,0, ±1).
n=1 n=3 N3 (2,0,0) (1,0,±1) (1,1,0) (0,0,0) (0,0, ± 2)
1
N1 N2 N42
3
4
collisional mixing collisional excitation spontaneous emissionAccording to this model, the state populations depend strongly on the mixing parameter γ which is linearly dependent on the ion density as:
) /ρ ln(ρ v n N 3 4π γ D W 4 = (3)
Increasing the ion density (hence γ) results in a simultaneous increase of unshifted state (i.e., states (1,1,0) and (0,0, ±2)) populations and a decrease of shifted state populations. This population transfer is shown in figure 2 which represents the populations as a function of a new parameter g=γ/A1 (A1 is the Einstein coefficient of state (2,0,0)). For sufficiently high ion densities (high g values), the population of each state reaches its statistical value. A vertical line indicates a g-value corresponding to Tore-Supra typical conditions, i.e., N~3.1013 cm-3 and a hydrogenbeam energy of 50 keV. For this value of ~3, the population redistribution by ion impacts is not complete and the statistical equilibrium is not reached. It follows that for such plasma conditions, one expects discrepancies to occur between measured MSE intensity ratios and those calculated with a statistical distribution of the state populations within level n=3.
0 2 4 6 8
2 4 6
g value for Tore Supra conditions
g N 1 N2 N 3 N 4 Ni ( a rb it ra ry u n it s )
Figure 2. State populations Ni versus g. For Tore Supra conditions, populations are not
statistically distributed.
4. Results and discussion
The profile shown in figure 3 has been calculated using state populations derived from the model. The profile is compared to a typical MSE spectrum measured in Tore Supra with a line of sight nearly parallel to the toroïdal magnetic field, the neutral beam being injected in the equatorial plane. We did not plot the blue shifted π components, since they are blended with MSE contributions from the ½ and 1/3 energy components of the beam. On figure 3, the experimental spectrum (solid/
) is compared to a profile calculated assuming a statistical equilibrium of the populations (dot/….), and a profile obtained with our model (dash/---). To understand the anomalously low σ0 intensity of the experimentalprofile compared to the theoretical value at equilibrium, we have explored several ways. The first one was a possible problem with the reflection on the mirror which can be selective with respect to polarization, but its calibration has shown that it can only induce a maximum error of 10% on intensity measurement. We have also checked for the existence of underlying impurity line which could have increased the π component intensities. But the measured profile with and without neutral beam shows no evidence about the existence of such lines at the π positions. At this stage, it remained the possibility of a non equilibrium population situation which we have treated with a simple kinetic model. Our kinetic model helped us to understand why the measured intensities of MSE σ components (in Tore-Supra) are lower than the expected values at statistical equilibrium. The progresses in understanding the intensities of the experimental MSE spectra are encouraging and stimulating further work. To improve the model, the next step is to do more accurate calculations of collisional rate coefficients and to make a more complete collisional-radiative model including energy levels higher than n=3.
6602 6604 6606 6608 6610 6612 6614 6616 6618 6620 -500 0 500 1000 1500 2000 2500 3000 σ− 1 σ0 π + 2 π + 3 σ+ 1
Shot #30323 of Tore Supra statistical populations model
E
beam= 50 keV, Tbeam=12 eV Ne=3. 1013 cm-3, B=2.8 T In te n s it y wavelength (Å) π+4
Figure 3. Fit of a Tore-Supra Hα MSE spectrum with a profile calculated with non statistical populations of level n=3.
Acknowledgments
This work is part of a collaboration (LRC DSM 99-14) between the Laboratory of Physique des Interactions Ioniques et Moléculaires and the Département de Recherches sur la Fusion Contrôlée, CEA Cadarache.
References
1
A. Boileau et al, J. Phys. B:At. Mol. Opt. Phys. 22, L145 (1989) 2
F. Levinton et al, Phys. Rev. Lett. 63, 2060 (1989) 3
M. Von Hellerman et al, Rev. Sci. Instrum. 61, 3479 (1990) 4
R. Jaspers et al, Rev. Sci. Instrum. 72, 1018 (2001) 5
H. Bethe and E. Salpeter, Quantum mechanics of one- and two-electron atoms (Springer-Verlag, Berlin 1957)
6
H.R. Griem, Spectral line broadening by plasmas (Academic Press, New York, 1974) 7