HAL Id: halshs-02540036
https://halshs.archives-ouvertes.fr/halshs-02540036
Preprint submitted on 10 Apr 2020
HAL is a multi-disciplinary open access archive for the deposit and dissemination of sci-entific research documents, whether they are pub-lished or not. The documents may come from teaching and research institutions in France or abroad, or from public or private research centers.
L’archive ouverte pluridisciplinaire HAL, est destinée au dépôt et à la diffusion de documents scientifiques de niveau recherche, publiés ou non, émanant des établissements d’enseignement et de recherche français ou étrangers, des laboratoires publics ou privés.
A Natural Experiment on Job Insecurity and Fertility in
France
Andrew E. Clark, Anthony Lepinteur
To cite this version:
Andrew E. Clark, Anthony Lepinteur. A Natural Experiment on Job Insecurity and Fertility in France. 2020. �halshs-02540036�
WORKING PAPER N° 2020 – 16
A Natural Experiment on Job Insecurity and Fertility in France
Andrew E. Clark Anthony Lepinteur
JEL Codes: I38, J13, J18
Keywords: Employment Protection; Layoff tax; Perceived Job Security; Difference-in-Differences; Fertility.
1
A Natural Experiment on Job Insecurity and
Fertility in France
*
A
NDREWE.
C
LARK Paris School of Economics - CNRSandrew.clark@ens.fr
A
NTHONYL
EPINTEUR University of Luxembourganthony.lepinteur@uni.lu
This version: April 2020
Abstract
Job insecurity can have wide-ranging consequences outside of the labour market. We here argue that it reduces fertility amongst the employed. The 1999 rise in the French Delalande tax, paid by large private firms when they laid off workers aged over 50, produced an exogenous rise in job insecurity for younger workers in these firms. A difference-in-differences analysis of French ECHP data reveals that this greater job insecurity for these under-50s significantly reduced their probability of having a new child by 3.9 percentage points. Reduced fertility is only found at the intensive margin: job insecurity reduces family size but not the probability of parenthood itself. Our results also suggest negative selection into parenthood, as this fertility effect does not appear for low-income and less-educated workers.
Keywords: Employment Protection; Layoff tax; Perceived Job Security;
Difference-in-Differences; Fertility.
JEL Classification Codes: I38, J13, J18.
* We gratefully acknowledge financial support from the Fonds National de la Recherche Luxembourg (Grant C18/SC/12677653). We thank Conchita D’Ambrosio, Anne-Celia Disdier and Kenneth Houngbedji for useful discussions. The Editor (Rema Hanna) and two anonymous referees provided very helpful comments.
2
1. Introduction
The second demographic transition has produced sharply lower fertility rates. In OECD countries this fertility drop has been from 2.7 children per woman in 1970 to 1.7 in 2014; the fertility rate has been below the replacement level of 2.1 children per woman since 1983 (OECD, 2016). Without any change in immigration, a lower fertility rate reduces the long-run supply of labour in the economy and therefore the tax base (Bloom et al., 2010). Low fertility rates also pose public-finance problems, particularly in the context of rising life expectancy, with retirement income and medical care being partially financed by taxes on the (smaller) younger working population.
An extensive literature addresses the demographic and socioeconomic factors that lie behind fertility decisions. Kohler et al. (2006) split these into three categories: the socioeconomic incentives to delay childbearing (the role of financial incentives on fertility, as in Cohen et al., 2013, and Laroque and Salanié, 2014, and investment in education that provides insurance in the labour market but delays fertility), the social context (such as others’ fertility), and institutions. These latter include, among others, labour-market rigidities, the quality of child-care support and gender roles. As shown in Del Boca (2002), less child-care support and a limited number of part-time jobs may explain both the low fertility and female participation rates in Italy between 1991 and 1995; in Costa-Font et al. (2018) parental-leave benefits and the regional availability of childcare facilities predict fertility.1
It is equally well-known that fertility responds sharply to major exogenous events such as civil wars and famines. In Agadjanian and Prata (2002) fertility in Angola in the 1990s fell during wartime but rebounded post-war, while Lindstrom and Berhanu (1999) note short-run falls in fertility in periods of famine and political instability in Ethiopia over the same period.
1 A separate literature has underlined the role of subjective well-being as a determinant of fertility. In Margolis
and Myrskylä (2015) the well-being around the birth of the first child predicts future fertility, while Cetre et al. (2016) use long-run German SOEP data to show that life satisfaction prior to first birth predicts the probability of being a parent by the age of 45.
3
Nobles et al. (2018) use individual-level Indonesian data to show that the probability of having a new child rose between 2006 and 2009, after the 2004 Indian Ocean tsunami, both for mothers who lost a child in the tsunami and for women who were childless in 2004.
It is widely argued that the long-run fall in fertility is a response to the first demographic transition, that of declining mortality (see Kirk, 1996, for a detailed description of the demographic transition theory): lower perinatal and child mortality rates led to fewer births. In this sense, insecurity in terms of survival produced more children. A recent example is Wilde
et al. (2019), who find that antimalarial nets led to lower fertility in South Africa.
We here relate fertility to an individual’s feelings of economic insecurity about their future, rather than their past exposure to a negative shock: our insecurity here is thus forward-looking. There is by now widespread agreement that economic insecurity has a considerable effect on individuals. Existing work in this area has considered the links between insecurity and obesity (Smith et al., 2013), suicide rates (Reeves et al., 2014), mental health (Rohde et al., 2016), gun violence in US schools (Pah et al., 2017), health (Caroli and Godard, 2016; Lepinteur, 2018) and voting behaviour and political preferences (Bossert et al., 2019).
Rajan (1999) and Sommer (2016) both propose theoretical models of fertility and economic insecurity. The birth of a child implies irreversible expenditures and is more likely to be abandoned or postponed by (potential) parents when they face economic uncertainty. A body of empirical work has uncovered a negative correlation between fertility and aggregate measures that arguably reflect insecurity: the OECD country-level unemployment rate, unemployment benefits and maternity benefits in Adsera (2004); country-level unemployment rates and production volatility in Hondroyiannis (2010); the US State unemployment rate in Schneider (2015); the regional unemployment and redundancy rates after the fall of the Berlin Wall in Chevalier and Marie (2017); and the State-cohort volatility of income growth in Chabé-Ferret and Gobbi (2018).
4
At the individual level, fertility has also been shown to fall with subjective measures of insecurity (perceived job security in Scherer, 2009, and worries about own economic situation in Kreyenfeld, 2015) as well as objective individual measures of insecurity such as persistent joblessness in Busetta et al. (2019) and being on a fixed-term contract in Adsera (2004), De la Rica and Iza (2005), Kind and Kleibrink (2013), Modena et al. (2014), Auer and Danzer (2016), Guner et al. (2019) and Lopes (2020).
We here make use of an exogenous rise in job insecurity following a change in employment-protection legislation uncovered by Georgieff and Lepinteur (2018). We share some similarities with Bignon and García Peñalosa (2018), who link a rise in Agricultural protection in 19th Century France (via a tariff on imported grain) to subsequent lower education but higher fertility. Their analysis is at the regional level, and their exogenous intensity of treatment is the importance of cereal production at the regional level. However, the channel they emphasise is the sharp rise in Agricultural wages relative to those in Manufacturing, and its consequences on the trade-off between the quality (education) and quantity of children; they do not link protectionism to employment or income insecurity. The only individual-level causal analyses of which we are aware both use German data. Hofmann and Hohmeyer (2013) argue that the introduction of the Hartz 4 reforms in 2004 in Germany produced greater worries about the individual’s own economic situation and so reduced fertility between 2000 and 2005. Klemm (2012) appeals to the introduction of German civil-service jobs, with their associated security, in the former East Germany: women who become civil servants there were more likely to have a (new) child.2
We propose what we believe to be the first difference-in-differences analysis of a quasi-natural experiment to establish a causal effect of individual job insecurity on fertility. While
2 Although this fertility effect was also found in West Germany (and thus could reflect selection). Klemm’s
5
most of the literature cited above has related fertility (or other) outcomes to objective measures of insecurity (e.g. unemployment benefits or income-growth volatility) or past life events (e.g. unemployment), we consider a pure forward-looking effect of insecurity (here related to the job) on future fertility: our analysis sample consists only of workers, some of whom were more threatened than others by the probability of future job loss following a French labour-market reform.3
We follow the method described in Georgieff and Lepinteur (2018), and use 1994-2001 French data from the European Household Community Panel (ECHP) to show that the 1999 rise in the French Delalande tax on layoffs of the over-50s increased job insecurity for the under-50s in large firms (as compared to the under-50s in small firms, where the Delalande tax did not change in 1999). We consider respondents who are married and cohabiting, and find that this greater job insecurity in turn reduced the probability of having a new child in this group by four percentage points. We check the robustness of our estimates by ruling out potential confounding factors such as macroeconomic trends or the 35-hour workweek that was introduced in France in 2000. We also show that our estimates are not qualitatively sensitive to the estimation method and to changes in the sample. Last, the fall in fertility due to job insecurity is the same by gender and age, but is only found for workers with relatively high wages, higher education and those who were already parents before the reform. These results are in line with negative selection into parenthood during periods of uncertainty (as in Chevalier and Marie, 2017).
The remainder of the paper is organised as follows. Section 2 describes the institutional background and the identification strategy for our analysis of individual-level insecurity, and
3 Most measures of (in)security seem to be backward-looking, in that they are based on past or current outcomes
(rather than the uncertainty associated with future ones). This is also the case for the index of food security proposed by the Food and Agriculture Organization (FAO), which is based on food availability and the household’s economic resources. In OECD (1997) job insecurity is rather expressed as a function of the expected
loss that would result from losing one’s current job; across countries subjective reported job insecurity is indeed
6
Section 3 the ECHP data. The main results then appear in Section 4, and the robustness checks and heterogeneity analysis in Section 5. Last, Section 6 concludes.
2. Institutional Background and identification strategy
The Delalande tax was introduced into French Law in 1987 to help restore financial balance to the unemployment-insurance system and reduce the rise in the layoffs of older workers. Despite a number of changes over time, the experience-rating principle of the tax has remained unchanged: firms that lay off workers of over a certain age have to pay the Delalande tax to the unemployment-insurance system. This tax is proportional to the laid-off worker's gross wage and is applied to private-sector workers with permanent contracts. From its introduction in 1987 up to 1992, this tax was three months of gross wages for all workers aged 55 and over who were laid off.
The first major changes to this tax were introduced in July 1992. Table 1 shows how the Delalande tax has changed over time as a function of the age of the worker who is laid-off and the size of the firm. While the initial 1987-1992 tax applied to firms of all sizes, in July 1992 the tax became differentiated by firm size. In addition, the age at which the tax started to apply fell from 55 to 50, and the maximum tax amount rose to six months of gross wages. However, workers who were hired after age 50 and who had been unemployed for at least three months were exempt from the tax. Additional changes to the tax scheme were made in January 1993 and January 1999. From 1993 to December 1998, the tax was a function only of worker age and not of firm size. In January 1999, the tax was increased, but only for firms with over 50 employees. This increase was announced by the French government one year beforehand. The Delalande tax was finally abolished in 2008.
Behaghel (2007) proposes a stochastic job-matching model to predict the impact of the changes to the Delalande tax; this shows that a rise in the Delalande tax will reduce the
7
separation rate of those workers covered by the reform but will increase that of the younger workers in the same firms. Georgieff and Lepinteur (2018) use the same ECHP data as we do here, and confirm empirically that the 1999 rise in the Delalande tax had perverse effects on younger (aged under 50) workers in larger French firms by increasing both their perceived job insecurity and their actual risk of layoff (relative to the covered older workers).
Our main goal here is to assess the causal effect of these exogenous changes in job security from the tax reform on worker's fertility decisions. To do so, we exploit the firm-size discontinuity and the perverse effects on younger workers induced by the 1999 Delalande tax reform: the layoff tax paid to the unemployment-insurance system rose for firms with 50 or more employees but remained unchanged for firms with under 50 employees. This reform then provides a natural quasi-experimental design for difference-in-differences (D-i-D) estimation, in which younger workers in large firms are the treatment group and younger workers in smaller firms are the control group.
The 1999 rise in the Delalande tax was announced by the French government one year beforehand (in early 1998), and the reintroduction of the firm-size discontinuity was also public knowledge by the end of 1998 (ECHP interviews took place in November and December of each year). As such, employers may have been able to strategically adjust their labour demand before the change in the Law. Georgieff and Lepinteur (2018) do identify anticipation effects, in that employers in treated firms laid off relatively more workers just after the announcement of the reform but prior to its implementation. This spike in layoffs is seen for the over-50s, but also for younger workers: the forthcoming higher layoff tax seems to have provoked some restructuring in larger firms. As such, job insecurity for the under-50s may well have started to rise even before the official implementation of the reform. We account for a potential announcement effect by estimating the following difference-in-differences equation, where we allow for a post-1998 treatment effect as well as an announcement effect of the reform in 1998:
8
𝑌𝑖𝑡 = 𝛼1𝑇𝑟𝑒𝑎𝑡𝑖𝑡+ 𝛼2𝑇𝑟𝑒𝑎𝑡𝑖𝑡∗ 𝜆1998+ 𝛼3𝑇𝑟𝑒𝑎𝑡𝑖𝑡∗ 𝑃𝑜𝑠𝑡1998𝑡+ 𝛼4𝑋𝑖𝑡+ 𝜇𝑖+ 𝜆𝑡+ ε𝑖𝑡 (1)
Here 𝑌𝑖𝑡 first represents the subjective job security of worker i in year t: in the spirit of Georgieff and Lepinteur (2018), we will show that the 1999 rise in the Delalande tax significantly reduced the job security of younger workers in treated firms (here concentrating on the married and cohabiting only). Second, 𝑌𝑖𝑡 will be a dummy for worker i having had a new child during year t. The variable Treatit is the treatment dummy, and is one if the worker is in a large firm (50+ employees) and zero in smaller firms. The variable Post1998t is a dummy for observations after January 1999 (the implementation date of the higher Delalande tax), λt are year fixed effects (so that λ1998 refers to the policy-announcement year of 1998) and Xit is a vector of standard individual socio-demographic controls. This includes age dummies (in five-year bands), past fertility (as measured by a dummy for the (lagged) presence of children in the household),4 self-reported health status (on a one to five scale), weekly working hours, the log of the (nominal) monthly wage, and occupation and region dummies. This equation also controls for individual fixed effects µi. The year dummies in equation (1) entirely subsume the main effects of λ1998 and Post1998t. The coefficients of interest in the above equation are α2 and α3, which respectively capture the effects of the reform’s announcement in 1998 and its implementation starting in 1999 on first job security and then fertility.
As we expect the effect of the reform’s announcement and implementation to be of the same sign, we also estimate the following difference-in-differences regression:
𝑌𝑖𝑡 = 𝛽1𝑇𝑟𝑒𝑎𝑡𝑖𝑡+ 𝛽2𝑇𝑟𝑒𝑎𝑡𝑖𝑡∗ 𝑃𝑜𝑠𝑡1997𝑡+ 𝛽3𝑋𝑖𝑡+ 𝜇𝑖 + 𝜆𝑡+ ε𝑖𝑡 (2)
4 Not controlling for the lagged presence of children in the household does not affect our estimates. These results
9
where the variable Post1997t is a dummy for observations after January 1998 (the date of the announcement of the higher Delalande tax). In this specification the coefficient β2 will capture what we call the total effect of the reform, starting from its announcement (and thus corresponds to the regression in equation (1) with α2 = α3).
3. Data and Estimation Sample
Our data come from the European Community Household Panel (ECHP), which is a longitudinal survey covering 15 European countries, including France. A nationally-representative sample of household and individuals was interviewed each year between 1994 and 2001 in each country. In France, an average of 15,000 individuals were surveyed per wave. The interviews mainly took place between November and December.
The ECHP contains detailed information on respondents’ socio-economic characteristics, income, employment conditions, social relations and so on.5 At each wave respondents reported
the number of new-born children in their household since the last survey wave. This will be our fertility measure.
The 1999 rise in the Delalande tax only applied to firms with over 50 employees. The size of the firm in which the respondent works, measured by the number of employees in the firm, is recorded in the following categories: “None”, “1 to 4”, “5 to 19”, “20 to 49”, “50 to 99”, “100 to 499” and “500 or more”. The ECHP also contains a number of questions on satisfaction with various job domains. Our measure of perceived job security comes from the following question:
“How satisfied are you with your present job in terms of job security?”
10
The answers were given on a 6-point scale, with 1 referring to “Not Satisfied” and 6 “Fully
Satisfied”.This measure of perceived job security is a strong predictor of individual choices such as future job quits (Clark, 2001) and reflects objective changes in layoff and hiring rates (Böckerman et al., 2011). It has also been shown to be related to permanent contracts,
unemployment-insurance benefits and employment protection legislation (Clark and Postel-Vinay, 2009).
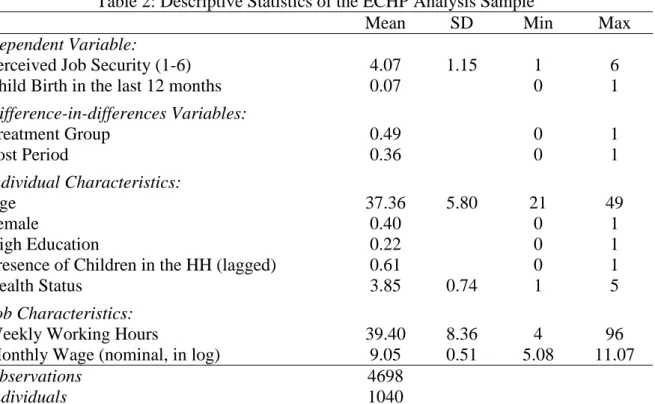
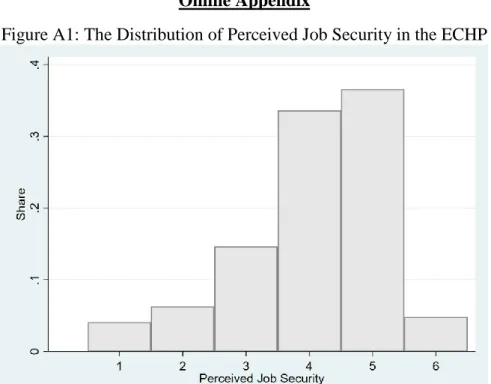
We consider adult respondents working in the private sector with permanent contracts, and with valid information on the sociodemographic variables, job characteristics and perceived job security. We in addition restrict the sample to married workers under age 50 who live in the same household as their partner, both before and after the reform. This leaves us with 4,698 observations on 1,040 different individuals from 1995 to 2001 (we cannot use the first 1994 wave of ECHP here as the number of new-borns in the household is missing). The descriptive statistics for our final analysis sample appear in Table 2. The split into the treated and control groups is almost exactly 50:50. With respect to our two dependent variables, a little under seven percent of our under-50 married workers had a new child over the past year and average job security on the one-to-six scale is just over four. Figure A1 in the Online Appendix shows the distribution of subjective job security. It can be seen that 70% of responses were 4 or 5. This negative skewness is common for satisfaction measures.
4. Main Results
We set the scene by considering the relationship between fertility and employment protection legislation (EPL) over time in OECD countries. Figure 1 shows the trends in fertility in OECD countries, and in France in particular. The OECD fertility rate has dropped spectacularly, from over three in the early 1960s to two in the mid-1980s, and has hovered
11
around the 1.7 level for the past 20 years. The French fertility rate also fell sharply from 1960 up to a low of 1.7 in the mid-1990s, but has since recovered to a figure of 2.
We relate fertility to Employment Protection Legislation (EPL) in a panel of 34 OECD countries from 1985 to 2014.6 The OECD EPL measure is a synthetic indicator that accounts for the strictness of regulation on dismissals for regular contracts. For more information and a complete description of the method, see www.oecd.org/employment/protection.7
Table 3 shows the correlation coefficients between OECD employment protection in t and the fertility rates in t+1 and t+2. The top part of this table refers to the association between the fertility rate in t+1 and employment protection legislation (EPL) in t. This is first calculated without any controls in column (1). We then add year fixed-effects and country fixed-effects in columns (2) and (3) respectively, and finally both at the same time in the last column. There is no significant relationship between EPL and fertility in the first two columns. However, controlling for country fixed effects produces positive and very significant estimates (so that there is an omitted country-level variable that is correlated in opposite directions with EPL and fertility). The estimates in columns (3) and (4) thus suggest that, within country, greater EPL today is associated with higher fertility one year later. The bottom part of Table 3 carries out the same analysis for the fertility rate at t+2, which produces very similar results (fertility rates being highly serially-correlated).
The country-level correlations in Table 3 are not causal. While we have checked that the fertility rate in t-1 does not predict EPL values in t (these results are available upon request), we cannot rule out within-country time-varying omitted factors that are correlated in the same direction with both fertility and EPL. As such, we will now turn to the fertility effect of an
6 This EPL time-series is complete for only 21 out of 34 countries, as some countries (e.g. Korea and Israel) joined
the OECD after 1985. Excluding these “new-joiner” countries from the analysis does not affect our estimates.
7 A related literature has used cross-country data to look at the relationship between policies that are designed to
protect individuals against labour-market insecurity and subjective well-being. Some examples are Carr and Chung (2014), Di Tella et al. (2003) and Easterlin (2013).
12
exogenous change in employment protection (and therefore job security) following the 1999 rise in the Delalande tax in France.
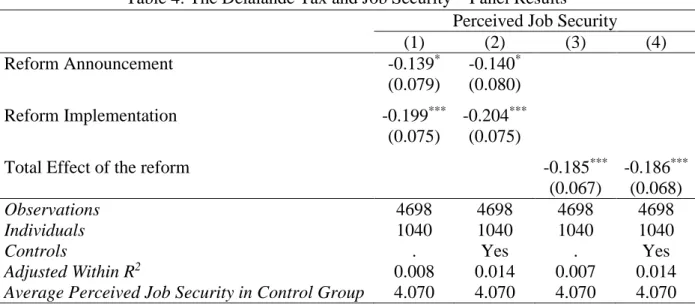
Table 4 first shows how reported job security changes with employment protection in the French sample of married and cohabiting workers in the ECHP panel data. This is based on the estimation sample described in Table 2. Job security is measured on a one-to-six scale. Columns (1) and (2) of this table refer to the difference-in-differences estimates of equation (1), where we allow for a post-1998 treatment effect as well as an announcement effect of the reform in 1998; the results in columns (3) and (4) come from the estimation of equation (2), where the announcement and implementation dummies are combined into a “total” effect. Columns (1) and (3) of Table 4 show the results without controls, and columns (2) and (4) those with controls. The introduction of controls makes almost no difference to the estimates. The 1999 rise in the layoff tax for older workers in larger firms significantly reduced the perceived job security of younger workers in larger firms (as compared to younger workers in smaller firms, where there was no change in the layoff tax). This lower job security for the married and cohabiting younger workers is seen both after the announcement and the implementation of the rise in the Delalande tax (as was the case for the sample of workers of all marital statuses in Georgieff and Lepinteur, 2018). Pairwise Wald-tests confirm that the estimated announcement and implementation effects of the reform in rows 1 and 2 are not statistically different from each other. Columns (3) and (4) then combine these into the total effect of the reform, which is naturally negative and significant and of a similar size to the figures in columns (1) and (2). We estimate that the higher Delalande tax reduced the perceived job security of younger workers in treated firms by around one-sixth of a standard deviation.8
8 We also looked at the effect of the announcement and implementation of the 1999 rise on the Delalande tax on
the actual layoff probabilities of married and cohabiting workers using data from the French Labour Survey. As for all marital statuses in Georgieff and Lepinteur (2018), we find positive and significant estimates from 1998 onwards (see Figure A2).
13
Table 5 then estimates the relationship between job insecurity and fertility (the probability of having had a new child over the past year) using the same estimation sample.9 Columns (1)
to (4) reproduce the specifications in Table 4. All of the estimated coefficients in columns (1) and (2) are negative. Those for the reform implementation are significantly so at the five per cent level, while those for reform announcement (as they are measured over only one year) have higher standard errors. The pairwise Wald-tests again reveal that the anticipation and implementation effects of the reform are statistically identical. The results when these are combined in columns (3) and (4) show that the higher Delalande tax reduced the probability of having a new child by just under four percentage points. This is sizeable, representing around 60% of the mean probability of a new birth in the estimation sample (see Table 2). As in Table 4, the introduction of sociodemographic controls makes barely any difference. This is to be expected: if the assignment to the treatment is random, the inclusion of additional controls will not affect the coefficients but should increase the precision of the estimates.
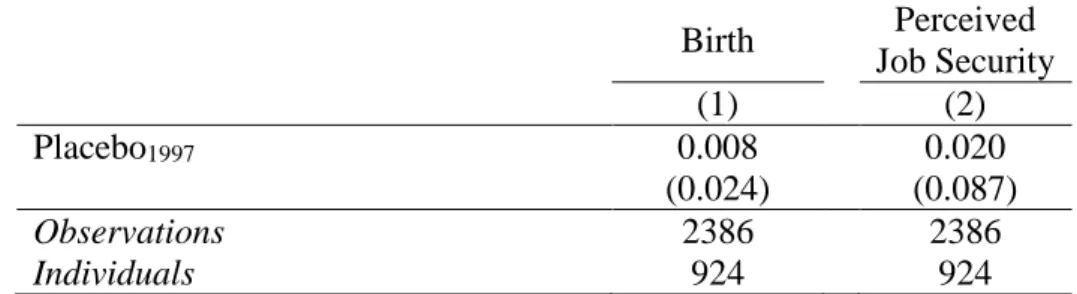
One of the requirements for D-i-D estimation to produce causal effects is that of a common trend in the dependent variable (here the probability of a new birth) in the control and treatment groups prior to the policy change. Figure 2 plots the mean birth probability over time for the two groups. The probability trends in the treatment and control groups are similar pre-treatment (as is indeed the level), supporting the common-trend assumption. We have also carried out a placebo regression to test the common-trend assumption. In the placebo experiment we only look at the pre-announcement years and assume that the rise in the Delalande tax came into force one year earlier (i.e. in 1997), and so compare fertility in 1995 and 1996 to that in 1997.
9 The full set of results, including the estimated coefficients on all of the control variables, appears in Appendix
14
The point estimate in column (1) of Table A2 is not statistically significant, supporting the common-trend assumption in fertility.10
The estimates in Table 4 and the first four columns of Table 5 then show that higher layoff taxes for older workers reduced both the perceived job security and birth probability of younger workers in the affected firms. It can however be argued that this fall in fertility might not result from greater job insecurity but rather changes in other individual characteristics. We address this concern in two ways. We first show in Table A3 that the differences in observable characteristics between the control and treatment groups remain the same before and after the announcement of the 1999 rise in the Delalande tax. Second, we re-estimate the regressions in columns (2) and (4) of Table 5 adding perceived job security as an additional control. If the fall in fertility from the higher Delalande tax is due only to greater feelings of job insecurity, controlling for the latter should render the treatment effects equal to zero. These new estimates appear in columns (5) and (6) of Table 5. It is indeed the case that holding job insecurity constant, the reform did not change fertility: lower fertility then seems to result from exogenously-higher job insecurity.
Our preferred treatment effect, that in column (4) of Table 5, is -0.040, which represents a reduction of 57% from the pre-reform fertility rate in our estimation sample. We will carry out a series of robustness checks in the next sub-section in which the lowest value of the treatment effect is -0.030. Our estimated effect of the 1999 rise in the Delalande tax then lies between 42% and 57% of the average pre-reform fertility rate. This figure might seem large, but is comparable to the estimated magnitudes of arguably similar variables. In Modena et al. (2014), the effects of unemployment and job instability respectively reduce the average fertility rate by
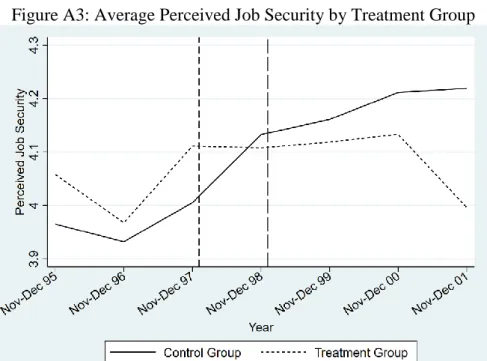
10 Figure A3 in the Online Appendix plots the time profile of average perceived job security in the treatment and
control group, providing supporting evidence for the parallel-trend assumption here as well. The right-hand part of Table A2 also shows the same placebo experiment as discussed in the text for job security. Both Figure A3 and Table A2 reveal parallel job-security trends pre-reform.
15
40% and 60%. In Hofmann and Hohmeyer (2013), “strong” perceived economic uncertainty was estimated to reduce fertility by between 25% and 50% of the average rate. The fall of the Berlin Wall in Chevalier and Marie (2017) reduced the annual crude birth rate by almost 50%. In Klemm (2012), being a civil servant has a somewhat lower impact, increasing the average fertility rate by 26%. We can also benchmark our insecurity effect using the other estimated coefficients in our fertility regressions. The estimated reform effect is 60% smaller than that of already having at least one child in the household. Equally, the drop in perceived job security due to the 1999 rise in the Delalande tax is half of that due to being in a small firm (with under 50 employees).
5. Robustness Checks and Heterogeneity
The results in Tables 4 and 5 referred to the effect of the reform on job security and fertility for the whole analysis sample of married and cohabiting workers. We here present a number of robustness and heterogeneity tests, and also ask whether the fertility effects of job insecurity are more pronounced for certain types of workers. All of our analysis refers to the total effect of the reform, as in equation (2).11 All of these robustness and heterogeneity tests will also be carried out for the estimated reform effect on perceived job security, with the results appearing in Appendix Tables A4 and A5.
a. Robustness Checks
i. Ruling out confounding shocks
One potential issue in our estimation is the French reform of the hours in the mandatory work week. In 1998, the French Ministry of Labour announced a reduction in the standard
11 The results of the robustness and heterogeneity analyses when we split the reform up into announcement and
16
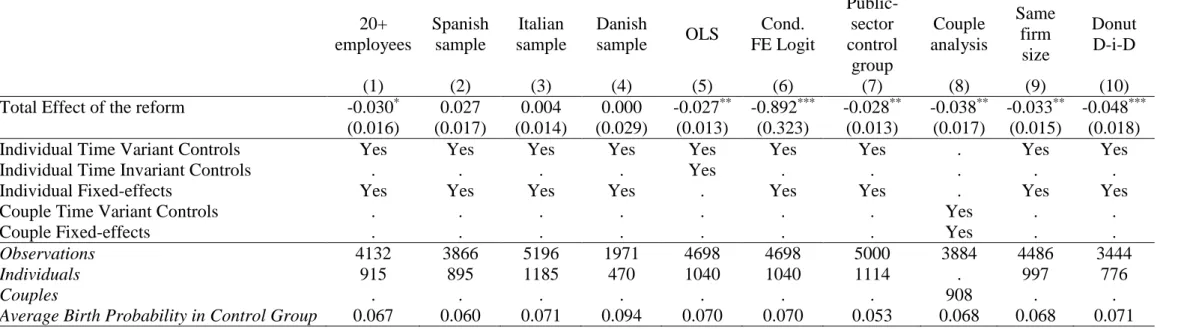
workweek from 39 to 35 hours in companies with more than 20 employees. This could potentially have affected the perceived job security of workers in those firms. To ensure that the lower job security following the Delalande tax does not pick up the 35-hour week, we re-run the baseline regression excluding workers in firms with under 20 employees (so that all of the individuals in our estimation sample are equally-affected by the 35-hour week). This restriction drops 566 observations (12% of the initial estimation sample). The estimated reform coefficient in column (1) of Table 6 is somewhat smaller than that in the baseline (in column (4) of Table 5). It may be that this smaller coefficient reflects a change in the composition of working time in the restricted sample. Table A3 shows that the differences in working time and in the probability of working part-time between the treatment and control groups were the same before and after the reform’s announcement. When we replicate this exercise for the sample excluding workers in firms with under 20 employees, the same conclusion holds (these results are available upon request). The treatment effects in column (1) of Table 6 and column (4) of Table 5 are then unlikely to reflect confounding changes in working time. Last, although the estimate in Table 6 is smaller, the difference from the baseline treatment effect is not statistically significant.
We would also like to ensure that our results reflect the effect of the French layoff-tax reforms, rather than some broader macro-economic developments. We test for the latter by re-running our baseline regressions on similar samples of workers in neighbouring countries, as the ECHP is harmonised across European countries. Data limitations restrict this comparison to Spain and Italy.12 The analogous difference-in-difference estimates in these two countries appear in columns (2) and (3) of Table 6. The estimated coefficients here are positive or essentially zero (rather than significantly negative, as in France) and neither is significant. We
12 The information in the last waves of the ECHP in Belgium and Germany does not allow us to accurately
17
also carry out this exercise for Denmark, which had both fertility rates and an EPL index that were comparable to those in France between 1995 and 2001. The D-i-D estimate in column (4) is zero. Macroeconomic trends do not then seem to lie behind our result of greater insecurity reducing fertility.
ii. Estimation method
We now ask how the use of individual fixed effects in the above analyses affects our results. Fixed-effects and OLS estimates can differ for two main reasons. First, fixed-effects models introduce attenuation bias in the case of measurement error, so that the OLS estimates are larger than their FE counterparts in absolute terms. There is also omitted-variable bias: the OLS estimates will be biased if the treatment is correlated with unobserved individual time-invariant characteristics. The baseline results without fixed effects in column (5) of Table 6 are somewhat smaller in absolute terms than the baseline fixed-effect estimates, but not significantly so.
We then consider whether these results are affected by the treatment of the dependent fertility variable. Our baseline regressions treat fertility as a cardinal variable (and are thus fixed-effect linear-probability models). As the dependent variable is a dummy, non-linear models may be more appropriate. The results in column (6) of Table 6 come from the re-estimation of our main regression via a conditional fixed-effect logit model, which continues to produce a negative significant estimated coefficient, so that job insecurity reduces fertility.
iii. Alternative control groups
We above used workers in smaller firms (under 50 employees), who were not affected by the change in the layoff tax, as the control group to establish the effect of the reform on the treated workers in larger firms. We can check our findings using public-sector employees as controls: as they were not covered by the Delalande tax, we assume that their perceived job
18
security was unaffected. Column (7) of Table 6 shows that the resulting estimated coefficient is very similar to the baseline estimate.
iv. Sample composition
The coefficients in Table 5 are estimated using a sample of married and cohabiting workers aged below 50 living in the same household as their partner. It may be thought to be more appropriate to run our analysis at the couple level in order to avoid double-counting. We therefore re-estimate the treatment effect in column (8) using only one observation per couple per year and controlling for both partners’ demographic variables (we here use the Missing Indicator method if there are missing values for a variable). We consider a couple to be treated if at least one of its members was affected by the reform. The estimate in column (8) is very similar in size to that from our baseline regressions.13
As the reform was announced months before its implementation, we may suspect that firms strategically adjusted their workforce. To rule out concerns regarding self-selection into the treatment, column (9) retains only workers who did not report any change in their firm’s size from 1997 onwards. This ends up dropping only around five per cent of the baseline sample, and the resulting estimated coefficient on the effect of job insecurity on fertility is only little changed.14
13 A different assignment rule to the treatment group at the couple level could potentially affect these results.
However, assuming that a couple is treated only if both partners are treated yields results that are qualitatively similar: the point estimate for the treatment is -0.036 and its standard error is 0.032. The smaller t-statistic here comes almost entirely from the higher standard error, as there are fewer treated couples in which “both parents are treated” as compared to “at least one parent is treated”.
14 The selection into firms of different sizes of workers with different links between fertility and perceived job
security could also be a problem, especially if fertility is more sensitive to perceived job security in the treatment group. To formally test for a different link between perceived job security and fertility by firm size we use the
pre-reform years and estimate the following empirical model: 𝐵𝑖𝑟𝑡ℎ𝑖𝑡 = 𝛼1𝐽𝑆𝑖𝑡+ 𝛼2𝑇𝑟𝑒𝑎𝑡𝑖𝑡+ 𝛼3𝐽𝑆𝑖𝑡∗
𝑇𝑟𝑒𝑎𝑡𝑖𝑡+ 𝜖𝑖𝑡. A significant α3 here would suggest a difference in the link between job security and fertility by
firm size. None of the estimates of α3 in a variety of models (with and without controls, with and without fixed
19
A related issue is that firm size is self-reported and may be inaccurate (so that we mistakenly assign some individuals to the control or treatment groups). This firm-size misreporting will not be a problem if it is random; however, if it is not our treatment effects might be biased. We address this issue via a test inspired by the donut regression-discontinuity design: we exclude workers who say they work in firms with “20 to 49 employees” or “50 to 99 employees” and re-estimate the treatment effect. While workers may mis-judge the size of their firm at the discontinuity (at 50 employees), it is probably much less likely that they would say that they work in a firm with under 20 employees when the firm actually has over 100 employees (and vice versa). The baseline and “donut” estimates in the last column of Table 6 below are the same, alleviating worries about the mis-reporting of firm size.
We last address the issue of attrition. From the announcement of the reform onwards, 12% of our treatment group leaves the estimation sample before the last wave (this figure is the same in the control group). We may worry that the probability of leaving the sample is not independent of the reform’s implementation and that our fertility estimates might be biased, especially if the birth probability of leavers rises after they leave the sample. A first point is that the ECHP does supply two weights, both of which are called attrition weights (our main regression results do not use weights). Applying these attrition weights does not change the nature of our results.
Along the same lines as Georgieff and Lepinteur (2018), we can also calibrate the “unobserved” difference-in-difference that would be required in the attrition group in order to produce a main estimate of zero: this is 0.29 (= 0.04*88%/12%). Our main result is that the gap in fertility between workers in large and small firms fell by 4 percentage points after the reform. For those who attrit to cancel this figure out, we would need the fertility gap between workers in large and small firms in this group to rather rise by 29 percentage points after the
20
reform. With an average observed birth probability in our estimation sample of only 0.07, this seems implausible.
b. Heterogeneity
The D-i-D estimates in Table 5 show the average treatment effect for all workers in large firms: Table 7 then asks whether these effects differ across groups. We first interact the total reform effect with a dummy for women and for workers born before 1959. The resulting estimates appear respectively in columns (1) and (2) of Table 7: neither interaction term is significant.15
Along the same lines, we then interact the effect of the reform with “High-wage” and “High-education” dummies, corresponding respectively to workers with above-median pre-reform wages and with post-secondary education before the pre-reform. The estimates in columns (3) and (4) of Table 7 underline that the fertility effect of job insecurity is concentrated among workers with high wages and high education.16
Our last interactions concern the family before the reform. Column (5) shows the estimated coefficient on the interaction with a dummy for the treated workers having children before the announcement of the higher Delalande tax. This coefficient is negative and significant: the effect of job insecurity on fertility is thus stronger at the intensive margin (for those who were already parents before the reform was introduced) than at the extensive margin. The reform effect for those without children in the first row is not statistically different from zero. The 1999 rise in the Delalande tax, with its concomitant effect on job insecurity for younger workers
15 1959 is the median birth year in our estimation sample. The interaction terms from different birth-year thresholds
continue to be insignificant. We also considered age (rather than birth year) as a type of heterogeneity, as fertility rates are lower for those over 40, but found no differences in treatment effects across age groups.
16 We also considered an interaction between the treatment and different measures of wages (a continuous measure
of monthly log wages and a set of dummies for wage quartiles), which produced similar results; the same applies if we use pre-reform household income. We found no evidence of heterogeneity in the negative significant effect of the reform on fertility according to other types of pre-reform income (non-work private income, total household capital income and total household rental/property income).
21
in larger firms, did not then reduce the likelihood of becoming a parent but did produce smaller families for existing parents. This also implies that the reform did not affect the parent’s age at first birth.
Our dummy variable “Parent beforehand” is one if we observe at least one child living in the household before the reform announcement. We may face measurement error here, in that our older workers could have children who were no longer living in the household at the time of the survey. We see whether this is an issue by re-estimating the treatment effects using only workers who are arguably less likely to be wrongly-assigned to our “Parent beforehand” group: those under the age of 40 at the time of the reform announcement. The results, available upon request, are qualitatively similar. Last, column (6) shows the interactions with the number of children that the respondent had at the time of the reform. The reduced fertility from job insecurity is more evident in larger families.17
Why does fertility react more in some groups than others? One possibility is that the strength of the relationship between the layoff tax and job insecurity may be more pronounced for high-wage and better-educated workers, and for those who already have children. We consider this in the heterogeneity analysis in Appendix Table A5, where the dependent variable is now perceived job security. None of the interaction terms in this table are significantly different from zero. All of the different groups of employees in this table then react similarly in terms of their perceived job security.
Alternatively, the link between perceived job security and fertility may differ across groups. Using the fall of the Berlin Wall as a natural experiment, Chevalier and Marie (2017) show that the fertility decisions of mothers with relatively high education and who are more attached to the labour market are more sensitive to economic uncertainty. As such, not only
17 We also considered heterogeneity by spouse’s labour-force status and employment characteristics (if working),
22
was the cohort of children born after the fall of Berlin Wall smaller, but it also changed in composition: the children born during this period performed worse according to a range of educational outcomes measured between ages 10 and 17. Chevalier and Marie (2017) interpret these findings as revealing negative selection into parenthood during periods of uncertainty. Our results in Table 7 are in line with this conclusion. Only better-educated and high-wage employees had fewer children after the rise in the Delalande tax. Along the same lines, we may expect workers who were already parents pre-reform to be more sensitive to uncertainty, as they already face the cost of raising children and may be reluctant to face potential financial difficulty by having more children in times of greater uncertainty.
6. Conclusion
Economic uncertainty reduces fertility amongst workers. The 1999 layoff-tax reform in the French labour market protected older workers, but to the detriment of younger workers. As this reform only applied in larger firms we can carry out a difference-in-differences analysis. The exogenous change in the future probability of job loss affected perceived job security; greater job insecurity in turn produced a robust significant fall in the probability of having a new child. The identification strategy that we use here allows us to identify the fertility effect of job insecurity for workers who were employed both before and after the reform, which is what most people will understand by insecurity. If at the same time the reform led to job loss, which itself is known to be associated with lower fertility, then our estimates above will actually be lower bounds for the total effect of the Delalande tax on fertility in France.
Job insecurity was found to reduce fertility only at the intensive margin and not at the extensive margin. In other words, greater job insecurity does not affect the probability of parenthood but does produce smaller families in the short-run. Our data allows us to show lower fertility over the period 1999-2001; we do not know whether we would find reduced
23
fertility or delayed fertility in the longer-run. While we find no significant differences in this fertility effect by gender or age, greater insecurity does affect the composition of the cohorts born after the reform, as only high-income and better-educated individuals reduced their fertility.
Last, we have here underlined a negative effect of job insecurity on fertility. Are smaller families then necessarily the price to pay for a more flexible labour market? The probability of future job loss, which was the source of variation here, is undoubtedly only part of the security story: unemployment benefits, the length of the unemployment spell and the quality of the next job all matter too. It would be useful to identify whether changes in these latter can mitigate the effect of job loss on fertility, so that something like flexicurity can allow both the labour market and fertility to work in a way that contributes to sustainable social welfare.
24
References
Adsera, A. (2004). “Changing fertility rates in developed countries. The impact of labor market institutions.” Journal of Population Economics, 17, 17-43.
Agadjanian, V., and Prata, N. (2002). “War, peace, and fertility in Angola.” Demography, 39, 215-231.
Auer, W., and Danzer, N. (2016). “Fixed-term employment and fertility: evidence from German micro data.” CESifo Economic Studies, 62, 595-623.
Ayllón, S. (2019). “Job insecurity and fertility in Europe.” Review of Economics of the
Household, 17, 1321–1347.
Behaghel, L. (2007). “La protection de l'emploi des travailleurs âgés en France : une évaluation ex ante de la contribution Delalande.” Annales d'économie et de statistique, 85, 41-80. Bignon, V., and García Peñalosa, C. (2018). “The toll of tariffs: protectionism, education and
fertility in late 19th century France.” Banque de France Working Paper No. 690.
Bloom, D. E., Canning, D., Fink, G., and Finlay, J. E. (2010). “The cost of low fertility in Europe.” European Journal of Population, 26, 141-158.
Böckerman, P., Ilmakunnas, P., and Johansson, E. (2011). Job security and employee well-being: Evidence from matched survey and register data. Labour Economics, 18, 547-554. Bossert, W., Clark A.E., D’Ambrosio, C., and Lepinteur, A. (2019), “Economic insecurity and
the rise of the Right.” PSE Working Paper No. 2019-55.
Busetta, A., Mendola, D., and Vignoli, D. (2019). “Persistent joblessness and fertility intentions.” Demographic Research, 40, 185-218.
Caroli, E., and Godard, M. (2016). “Does job insecurity deteriorate health?” Health Economics,
25, 131-147.
Carr, E., and Chung, H. (2014). “Employment insecurity and life satisfaction: The moderating influence of labour market policies across Europe”. Journal of European Social Policy,
25
Cetre, S., Clark, A.E., and Senik, C. (2016). “Happy people have children: choice and self-selection into parenthood.” European Journal of Population, 32, 445–473.
Chabé-Ferret, B., and Gobbi, P. (2018). “Economic uncertainty and fertility cycles: the case of the post-WWII baby boom.” ECARES Working Paper No. 2018-19.
Chevalier, A., and Marie, O. (2017). “Economic uncertainty, parental selection, and children’s educational outcomes.” Journal of Political Economy, 125, 393-430
Clark, A.E. (2001). What really matters in a job? Hedonic measurement using quit data. Labour
Economics, 8, 223-242.
Clark, A., and Postel-Vinay, F. (2009). Job security and job protection. Oxford Economic
Papers, 61, 207-239.
Cohen, A., Dehejia, R., and Romanov, D. (2013). “Financial incentives and fertility.” Review
of Economics and Statistics, 95, 1-20.
Costa-Font, J., Flèche, S., and Pagan, R. (2018). “Parental leave, fertility and well-being.” LSE, mimeo.
De la Rica, S., and Iza, A. (2005). “Career planning in Spain: Do fixed-term contracts delay marriage and parenthood?.” Review of Economics of the Household, 3, 49-73.
Del Boca, D. (2002). “The effect of childcare and part time opportunities on participation and fertility decisions in Italy.” Journal of Population Economics, 15, 549-573.
Di Tella, R., MacCulloch, R.J., and Oswald, A.J. (2003). “The macroeconomics of happiness”.
Review of Economics and Statistics, 85, 809-827.
Easterlin, R. (2013). “Happiness, growth, and public policy”. Economic Inquiry, 51, 1-15. Georgieff, A., and Lepinteur, A. (2018). “Partial employment protection and perceived job
security: evidence from France.” Oxford Economic Papers, 70, 846-867.
Guner, N., Kaya, E., and Sánchez-Marcos, V. (2019). “Labor market frictions and lowest low fertility.” IZA Discussion Paper No. 12771.
26
Hofmann, B., and Hohmeyer, K. (2013). “Perceived economic uncertainty and fertility: Evidence from a labor market reform.” Journal of Marriage and Family, 75, 503-521. Hondroyiannis, G. (2010). “Fertility determinants and economic uncertainty: An assessment
using European panel data.” Journal of Family and Economic Issues, 31, 33-50.
Kind, M., and Kleibrink, J. (2013). “Sooner or later–economic insecurity and the timing of first birth.” Ruhr Economic Paper No. 422.
Kirk, D. (1996). “Demographic transition theory.” Population Studies, 50, 361-387.
Klemm, M. (2012). “Job security and fertility: evidence from German Reunification”. Ruhr Economic Papers No. 379
Kohler, H. P., Billari, F. C., and Ortega, J. A. (2006). “Low fertility in Europe: causes, implications and policy options.” In Harris, F. (Ed.), The Baby Bust, Rowman & Littlefield, 48-109.
Kreyenfeld, M. (2009). “Uncertainties in female employment careers and the postponement of parenthood in Germany.” European Sociological Review, 26, 351-366.
Laroque, G., and Salanié, B. (2014). “Identifying the Response of fertility to financial incentives.” Journal of Applied Econometrics, 29, 314-332.
Lepinteur, A. (2018). “The asymmetric experience of gains and losses in job security on health.” CREA Working Paper No. 18-16.
Lopes, M. (2020). “Job security and fertility decisions.” Mimeo.
Lindstrom, D. P., and Berhanu, B. (1999). “The impact of war, famine, and economic decline on marital fertility in Ethiopia.” Demography, 36, 247-261.
Margolis, R., and Myrskylä, M. (2015). “Parental well-being surrounding first birth as a determinant of further parity progression.” Demography, 52, 1147–1166.
Modena, F., Rondinelli, C., and Sabatini, F. (2014). “Economic insecurity and fertility intentions: The case of Italy.” Review of Income and Wealth, 60, S233-S255.
27
Nobles, J., Frankenberg, E., and Thomas, D. (2015). “The effects of mortality on fertility: population dynamics after a natural disaster.” Demography, 52, 15-38.
OECD. (1997). “Is job insecurity on the rise in OECD countries?” OECD Employment
Outlook, OECD Publishing, Paris.
OECD. (2016). Society at a Glance 2016: OECD Social Indicators, OECD Publishing, Paris. Pah, A. R., Hagan, J., Jennings, A. L., Jain, A., Albrecht, K., Hockenberry, A. J., and Amaral,
L. A. N. (2017). “Economic insecurity and the rise in gun violence at US schools.” Nature
Human Behaviour, 1, Article 0040.
Ranjan, P. (1999). “Fertility behaviour under income uncertainty.” European Journal of
Population, 15, 25-43.
Reeves, A., McKee, M., and Stuckler, D. (2014). “Economic suicides in the great recession in Europe and North America.” The British Journal of Psychiatry, 205, 246-247.
Rohde, N., Tang, K. K., Osberg, L., and Rao, P. (2016). “The effect of economic insecurity on mental health: Recent evidence from Australian panel data.” Social Science and Medicine,
151, 250-258.
Scherer, S. (2009). “The social consequences of insecure jobs.” Social Indicators Research,
93, 527-547.
Schneider, D. (2015). “The great recession, fertility, and uncertainty: Evidence from the United States.” Journal of Marriage and Family, 77, 1144-1156.
Sommer, K. (2016). “Fertility choice in a life cycle model with idiosyncratic uninsurable earnings risk.” Journal of Monetary Economics, 83, 27-38.
Smith, T., S. Stillman and S. Craig (2013), “The U.S. obesity epidemic: new evidence from the economic security index,” Paper No. 151419, presented at the Annual Meeting of the Agricultural and Applied Economics Association.
Wilde, J., Apouey, B., Coleman, J., and Picone, G. (2019). “The effect of antimalarial campaigns on child mortality and fertility in sub-Saharan Africa”. PSE Working Paper No. 2019–49.
28
Figures and Tables
Figure 1: Fertility Rates in France and the OECD: 1960 to 2014
Notes: The fertility rate is the ratio of the number of children to the number of women of
child-bearing age and comes from the OECD. For more details, see https://data.oecd.org/pop/fertility-rates.htm#indicator-chart.
Figure 2: Average Birth Probability by Treatment Group
Notes: The short-dashed vertical line indicates the date at which the rise in the Delalande tax was
announced, while the long-dashed line indicates the date of its implementation. The points on the horizontal axis refer to the time of data collection of each ECHP wave (in November to December of each year).
29
Table 1: The Delalande Layoff Tax over Time
Worker’s age
50 51 52 53 54 55 56-57 58 59
July 1987-June 1992 All firm sizes 3 3 3 3
July 1992 - Dec. 1992 20 or more employees 1 1 2 2 4 5 6 6 6
Under 20 employees 0.5 0.5 1 1 2 2.5 3 3 3
Jan 1993-Dec 1998 All firm sizes 1 1 2 2 4 5 6 6 6
January 1999-2008 50 or more employees 2 3 5 6 8 10 12 10 8
Under 50 employees 1 1 2 2 4 5 6 6 6
Source: Legislative texts.
Note: For each age group, the table shows the tax to be paid by the firm to the unemployment-insurance system if it lays off a worker
of that age. The tax is a function of the worker’s wages, and is stated in months of gross wage.
Table 2: Descriptive Statistics of the ECHP Analysis Sample
Mean SD Min Max
Dependent Variable:
Perceived Job Security (1-6) 4.07 1.15 1 6
Child Birth in the last 12 months 0.07 0 1
Difference-in-differences Variables: Treatment Group 0.49 0 1 Post Period 0.36 0 1 Individual Characteristics: Age 37.36 5.80 21 49 Female 0.40 0 1 High Education 0.22 0 1
Presence of Children in the HH (lagged) 0.61 0 1
Health Status 3.85 0.74 1 5
Job Characteristics:
Weekly Working Hours 39.40 8.36 4 96
Monthly Wage (nominal, in log) 9.05 0.51 5.08 11.07
Observations 4698
Individuals 1040
Notes: These numbers refer to French married and cohabiting private-sector workers under the age of 50 without
30
Table 3: Employment Protection Legislation and Fertility at the Country Level – OLS results Fertility Rate in t+1 (1) (2) (3) (4) EPL in t 0.077 0.011 0.197*** 0.152*** (0.056) (0.029) (0.035) (0.041) Observations 735 735 735 735 Adjusted R2 0.029 0.192 0.919 0.927
Time FE . Yes . Yes
Country FE . . Yes Yes
Fertility Rate in t+2 (1) (2) (3) (4) EPL in t 0.095 0.026 0.238*** 0.190*** (0.059) (0.033) (0.039) (0.045) Observations 735 735 735 735 Adjusted R2 0.040 0.203 0.917 0.925
Time FE . Yes . Yes
Country FE . . Yes Yes
Notes: The data here comes from an unbalanced panel of 34 OECD countries (Australia,
Austria, Belgium, Canada, Chile, the Czech Republic, Denmark, Estonia, Finland, France, Germany, Greece, Hungary, Iceland, Ireland, Israel, Italy, Japan, South Korea, Luxembourg, Mexico, the Netherlands, New Zealand, Norway, Poland, Portugal, Slovakia, Slovenia, Spain, Sweden, Switzerland, Turkey, the United Kingdom and the United States) over the 1985-2014 period. All observations are weighted by population size. The measure of EPL is the synthetic indicator of the strictness of regulation on dismissals for regular contracts produced by the OECD. For more information and the full method, see www.oecd.org/employment/protection. The fertility rate is the ratio of the number of children to the number of women of child-bearing age produced by the OECD. For more details, see https://data.oecd.org/pop/fertility-rates.htm#indicator-chart. *, ** and *** indicate significance at the 10%, 5% and 1% levels respectively.
Table 4: The Delalande Tax and Job Security – Panel Results Perceived Job Security
(1) (2) (3) (4)
Reform Announcement -0.139* -0.140*
(0.079) (0.080)
Reform Implementation -0.199*** -0.204***
(0.075) (0.075)
Total Effect of the reform -0.185*** -0.186***
(0.067) (0.068)
Observations 4698 4698 4698 4698
Individuals 1040 1040 1040 1040
Controls . Yes . Yes
Adjusted Within R2 0.008 0.014 0.007 0.014
Average Perceived Job Security in Control Group 4.070 4.070 4.070 4.070 Notes: The sample here is married and cohabiting private-sector workers in the French ECHP between the ages of
21 and 49. The announcement effect of the reform considers the treatment from the beginning of 1998, when the
reform to the Delalande tax was announced, up to its implementation on January 1st 1999; the reform-implementation
effect considers the implementation treatment starting on January 1st 1999. These two effects correspond to α
2 and
α3 in equation (1). Standard errors in parentheses are clustered at the individual level. All of the regressions include
individual and year fixed-effects. The controls include age dummies (in five-year bands),a dummy for the (lagged)
presence of children in the household,health status, weekly working hours, the log of the monthly wage, and
31
Table 5: The Delalande Tax and Fertility – Panel Results Birth (1) (2) (3) (4) (5) (6) Reform Announcement -0.035 -0.038* -0.006 (0.022) (0.022) (0.063) Reform Implementation -0.037** -0.041** -0.009 (0.016) (0.016) (0.062)
Total Effect of the reform -0.037** -0.040** -0.008
(0.015) (0.015) (0.062)
Observations 4698 4698 4698 4698 4698 4698
Individuals 1040 1040 1040 1040 1040 1040
Controls . Yes . Yes Yes Yes
Controlling for Perceived Job Security . . . . Yes Yes
Adjusted Within R2 0.007 0.023 0.007 0.023 0.024 0.024
Average Birth Probability in Control Group 0.070 0.070 0.070 0.070 0.070 0.070 Notes: The sample here is married and cohabiting private-sector workers in the French ECHP between the ages of 21 and 49. The
announcement effect of the reform considers the treatment from the beginning of 1998, when the reform to the Delalande tax was
announced, up to its implementation on January 1st 1999; the reform-implementation effect considers the implementation treatment
starting on January 1st 1999. These two effects correspond to α
2 and α3 in equation (1). Standard errors in parentheses are clustered at the
individual level. All of the regressions include individual and year fixed-effects. The controls include age dummies (in five-year bands),
a dummy for the (lagged) presence of children in the household,health status, weekly working hours, the log of the monthly wage, and
32
Table 6: The Rise in the Delalande Tax and Fertility – Robustness Checks 20+ employees Spanish sample Italian sample Danish sample OLS Cond. FE Logit Public-sector control group Couple analysis Same firm size Donut D-i-D (1) (2) (3) (4) (5) (6) (7) (8) (9) (10)
Total Effect of the reform -0.030* 0.027 0.004 0.000 -0.027** -0.892*** -0.028** -0.038** -0.033** -0.048***
(0.016) (0.017) (0.014) (0.029) (0.013) (0.323) (0.013) (0.017) (0.015) (0.018)
Individual Time Variant Controls Yes Yes Yes Yes Yes Yes Yes . Yes Yes
Individual Time Invariant Controls . . . . Yes . . . . .
Individual Fixed-effects Yes Yes Yes Yes . Yes Yes . Yes Yes
Couple Time Variant Controls . . . Yes . .
Couple Fixed-effects . . . Yes . .
Observations 4132 3866 5196 1971 4698 4698 5000 3884 4486 3444
Individuals 915 895 1185 470 1040 1040 1114 . 997 776
Couples . . . 908 . .
Average Birth Probability in Control Group 0.067 0.060 0.071 0.094 0.070 0.070 0.053 0.068 0.068 0.071 Notes: The sample here is married and cohabiting private-sector workers in the French ECHP between the ages of 21 and 49 (except in columns (2) to (4), where it is their Spanish, Italian and Danish
counterparts). Standard errors in parentheses are clustered at the individual level, except in columns (6) and (8); the latter is clustered at the couple level. The conditional FE logit results in column (6) refer to the log of the odds ratio. All of the regressions include year fixed effects. The controls include age dummies (in five-year bands), a dummy for the (lagged) presence of children in the
household,health status, weekly working hours, the log of the monthly wage, and occupation and region dummies. The individual time-invariant controls in column (5) are gender and a dummy for
post-secondary education. The couple time-varying controls in columns (8) include the individual time-varying controls for both the husband and the wife. *, ** and *** indicate significance at the 10%, 5% and 1% levels respectively.
33
Table 7: The Rise in the Delalande Tax and Fertility – Heterogeneity Birth
(1) (2) (3) (4) (5) (6)
Total Effect of the reform -0.046** -0.048** -0.011 -0.021 0.007 0.028
(0.018) (0.023) (0.017) (0.015) (0.017) (0.026) Interaction with: Female 0.018 (0.019) Born before 1959 0.017 (0.023)
High Wage beforehand -0.044**
(0.019)
High Education beforehand -0.082***
(0.029) Parent beforehand -0.062*** (0.018) 1 child beforehand -0.041 (0.028) 2 children beforehand -0.091*** (0.029) 3+ children beforehand -0.094*** (0.033) Observations 4698 4698 4698 4698 4698 4698 Individuals 1040 1040 1040 1040 1040 1040
Average Birth Probability in Control Group 0.070 0.070 0.070 0.070 0.070 0.070 Notes: The sample here is married and cohabiting private-sector workers in the French ECHP between the ages of 21 and 49. Standard
errors in parentheses are clustered at the individual level. All of the regressions include individual and year fixed-effects. The controls
include age dummies (in five-year bands),a dummy for the (lagged) presence of children in the household,health status, weekly working
hours, the log of the monthly wage, and occupation and region dummies. *, ** and *** indicate significance at the 10%, 5% and 1% levels respectively.
34
Online Appendix
Figure A1: The Distribution of Perceived Job Security in the ECHP
Note: This figure refers to French married and cohabiting private-sector workers
under the age of 50 without missing values in the ECHP 1995-2001.
Figure A2: The Delalande Tax and the Probability of Layoff – OLS Results
Notes: The sample here is married and cohabiting private-sector workers in the
French Labour Force Survey between the ages of 21 and 49. The number of observations is 136,836. Standard errors in parentheses are clustered at the individual level. All of the regressions include year fixed-effects. The controls
include age dummies (in five-year bands),a dummy for the presence of children
in the household,the log of the monthly wage, and département dummies. The
35
Figure A3: Average Perceived Job Security by Treatment Group
Notes: The short-dashed vertical line indicates the date at which the rise in the
Delalande tax was announced while the long-dashed line indicates the date of its implementation. The points on the horizontal axis refer to the time of data collection of each ECHP wave (in November to December of each year).