N A N O M A T E R I A L S Copyright © 2017 The Authors, some rights reserved; exclusive licensee American Association for the Advancement of Science. No claim to original U.S. Government Works. Distributed under a Creative Commons Attribution NonCommercial License 4.0 (CC BY-NC).
Jamming and overpacking fuzzy microgels:
Deformation, interpenetration, and compression
Gaurasundar M. Conley,1Philippe Aebischer,1Sofi Nöjd,2Peter Schurtenberger,2Frank Scheffold1*
Tuning the solubility of fuzzy polymer microgels by external triggers, such as temperature or pH, provides a unique mechanism for controlling the porosity and size of colloidal particles on the nanoscale. As a conse-quence, these smart microgel particles are being considered for applications ranging from viscosity modifiers and sensing to drug delivery and as models for the glass and the jamming transition. Despite their widespread use, little is known about how these soft particles adapt their shape and size under strong mechanical com-pression. We use a combination of precise labeling protocols and two-color superresolution microscopy to unravel the behavior of tracer microgels inside densely packed soft solids. We find that interpenetration and shape defor-mation are dominant until, in the highly overpacked state, this mechanism saturates and the only remaining way to further densify the system is by isotropic compression.
INTRODUCTION
Microgels are among the most studied colloidal and polymeric systems of the past two decades (1–4). In particular, microgels made from ther-mosensitive poly(N-isopropylacrylamide) and its derivatives are of interest (5). By decorating and functionalizing microgels with nano-particles, one can add additional optical, chemical, or magnetic sen-sitivity (6–9). Swelling the microgel by lowering the temperature can drive a colloidal suspension from the liquid to the solid state, conve-niently crossing the glass and the jamming transition without the need to prepare samples of varying composition (10–13). In contrast to other soft matter constituents, such as emulsion droplets or bubble foams (14–16), microgels can be highly overpacked, meaning that the effective volume fractionzeffcan be much larger than one (10, 17, 18).
However, little is known about the way the individual microgel particles pack and deform in the jammed and overpacked state, although this will crucially influence the dynamics and macroscopic viscoelastic proper-ties of the amorphous solid (1). Mattsson et al. (17) recently reported that, unlike hard-sphere suspensions, microgels are dynamically arrested and jammed at an effective volume fractionzeffmuch larger
than one. At the same time, Zhang et al. (12) reported the jamming of microgels near the expected transition for hard spheres. Much of this marked difference can possibly be explained by the difference in micro-gel sizes and chemistry, such as the cross-link density, charged groups, and ionic strength. However, direct experimental methods that would allow to clarify the origin of these differences and to characterize the microgels in dense packings in situ are scarce. Although techniques such as atomic force microscopy (AFM) and cryogenic transmission electron microscopy (cryo-TEM) can reach a nanometric resolution, they are limited to surface imaging (AFM) or require harsh sample preparation and offer relatively poor contrast (cryo-TEM) (19). In neutron scattering, averages are taken in reciprocal space over a size distribution of randomly oriented particles, and important information about par-ticle shape anisotropy and parpar-ticle-parpar-ticle interpenetration cannot be obtained directly (18). The lack of more detailed information on the single-particle level also limits progress in micromechanical modeling,
which until now is often based on simplified assumptions such as Hertzian or harmonic pair-interaction potentials (20, 21), which are not compatible with the highly overpacked states observed in experi-mental studies. Moreover, packing soft and deformable particles with different shapes, intrinsic or acquired, are interesting motifs not only for microgels but also in many condensed matter systems, with impor-tant consequences for the relationship between structure and the attributes of the material building blocks (20, 22).
To understand the microstructural changes at high packing densi-ties, it is important to be aware of the complex architecture of individual colloidal microgel particles. In microgels, the internal cross-link density is not homogeneous, and moreover, microgels have a fuzzy corona with dangling polymer chains (23). The brush-like interactions mediated by these dangling ends can have a profound influence on the onset of re-pulsive interactions when the microgels swell into contact (11). The low-density polymer corona may also allow for deformation and even some mutual interpenetration between adjacent microgels (24). Thus, the architecture of swollen microgels permits different competing pack-ing mechanisms such as shape deformation, interpenetration, and com-pression. The main goal of our work is to quantify their relative contribution by nanoscale imaging microgels based on dSTORM (di-rect stochastic optical reconstruction microscopy) superresolution mi-croscopy (19, 25, 26). To this end, we fluorescently label a small subset of microgels and record ultrahigh-resolution two-dimensional (2D) op-tical image sections. The combination of precise labeling protocols and superresolution techniques allows us to map out the different con-tributions from the marginally jammed state to the deeply overpacked regime. STORM is a relatively recent single-molecule localization imaging technique that has gained widespread use in biology, but its applications to soft materials are still rare (19, 25–27). Here, we demonstrate that, when applying precise labeling protocols, STORM can be a unique tool to overcome traditional limitations in optical materials characterization at the submicrometer scale, particularly when taking advantage of the unique specificity of multicolor dye labeling.
RESULTS
Microgel properties
Although the microgels investigated in this study are about 1mm in diameter, the structural transformations we aim to characterize, as a
1Department of Physics, University of Fribourg, Chemin du Musée 3, 1700 Fribourg, Switzerland.2Physical Chemistry, Department of Chemistry, Lund University, 221 00 Lund, Sweden.
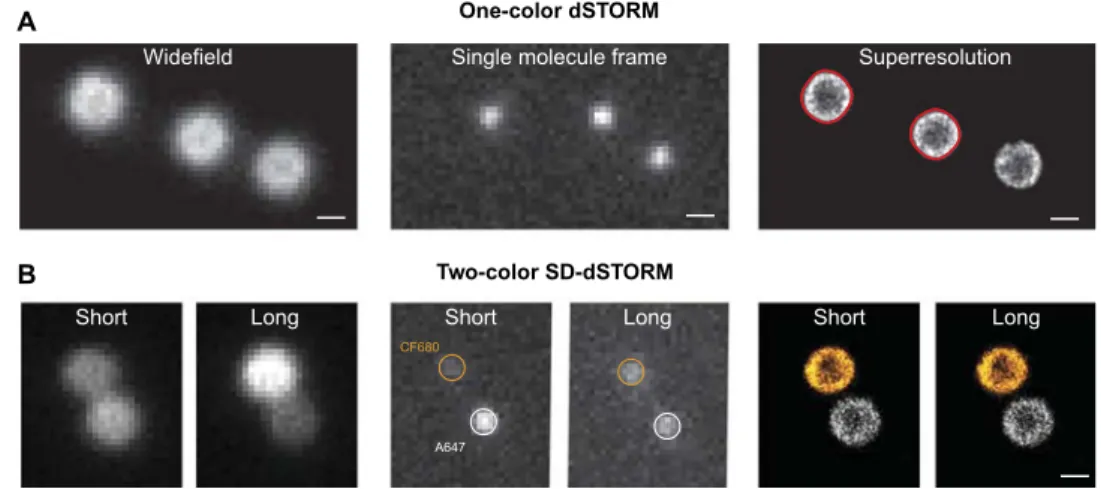
function of packing density, occur on a significantly smaller length scale. We apply dSTORM (19, 26, 28) and spectral demixing dSTORM (SD-dSTORM) (29) to achieve nanoscale optical resolution and single-particle specificity. SD-dSTORM is used for two-color imaging, which is necessary to observe interpenetration of particles in contact. We can image individual microgels with a lateral resolution of ≈30 nm as reported in our previous work (26). To this end, we pre-pare samples at different concentrations, and only a small fraction of fluorescently labeled microgels are included as tracers to achieve op-timal contrast. Before imaging, the sample is heated to homogenize it and to erase preparation history and then cooled rapidly to a tem-perature of 22 ± 1°C. Most of the images we record are 2D projec-tions of a≈500-nm-thick z-section, which is about half the particle diameter. For one-color imaging, we choose particles located in the bulk of the sample. For two-color dSTORM of adjacent particles, we select pairs of particles in contact with the substrate to ensure that the particle centers of mass are located in the same plane. The quality of
the images we obtain is illustrated in Fig. 1 for particles adsorbed on the surface of a glass slide.
We find that the most robust way to determine the size and shape of the microgels is by analyzing the outer contour of a 2D image with an edge detection method and appropriate smoothing filters (see the Sup-plementary Materials). For isolated microgels, we obtain an effective radius R ¼pffiffiffiffiffiffiffiffiA=p¼ 429 ± 9 nm from area A enclosed by the con-tour. The edge detection is a trade-off we have to make to be able to capture all the geometrical features of the microgels under dilute and highly packed conditions. When using the edge detection algorithm, we are insensitive to the ultralow-density outer regions of the microgel, and therefore, R is about 10% smaller than the total radius estimated from static light scattering. From the latter, we determine the size of the dense core to Rcore~ 380 nm and the thickness of the corona is 2s ~ 90 nm,
giving a total size Rtot≃ Rcore+ 2s = 470 nm (23, 30). The size
poly-dispersity is approximately 6% (see the Supplementary Materials). To complement our findings in 2D and to demonstrate the potential of dSTORM applied to polymeric soft materials, we also performed a 3D reconstruction of densely packed microgels with an axial resolution of approximately 60 nm (26).
The liquid-to-solid transition
Depending on the polymer weight fraction, the microgel suspension may be quenched in an amorphous liquid or solid state at 22°C. Initially, the repulsive sphere fluid enters the ultrasoft glassy phase atzg≃ 0.58,
and a few percentiles abovezJ≃ 0.64, particles touch (21, 31). For hard
spheres, this marginal jamming point is also known as random close packing (32). Jamming the soft spheres at densities above zeff>zJmeans
that the particles have to deform or interpenetrate to fill space more ef-ficiently. We determine the liquid-to-solid transition by video micros-copy and particle tracking deep inside the sample (33). Figure 2 shows the microgel’s mean square displacement (MSD) at different concentra-tions. At the lowest concentration, 7.4 wt % (weight %), the sample is still liquid, exhibiting nearly diffusive behavior with tracks extending beyond the diameter of a particle. Increasing the concentration to 8 wt % changes the behavior completely. The MSD no longer increases linearly in time, as one would expect for a liquid, but exhibits a plateau,
One-color dSTORM
Two-color SD-dSTORM B
A
Short Long
Single molecule frame
Widefield Superresolution
A647 CF680
Short Long Short Long
Fig. 1. Superresolution microscopy of microgels under dilute conditions. (A) One-color microscopy. From left to right: Wide-field fluorescence image of individual microgels, single-molecule blinking frame, and final dSTORM image reconstructed from 60,000 blinking frames. In red, the smoothed contours correspond to particle sizes of 439 and 424 nm. (B) Two-color microscopy by spectral demixing. Two spatially equivalent but spectrally separated images are captured side by side on the camera, and the intensity ratio between long and short wavelength channels is used to identify different fluorescent dye species. From left to right: Wide-field fluorescence image of two microgels labeled with CF680R (orange) and AF647 (white), single-molecule frame showing different intensity split for the two dyes, and final reconstructed image obtained from single-molecule localizations on each side. Scale bars, 500 nm.
7.4% 8.0% 8.9% 10.4%
Lag time (s)
Mean square displacement ( m2)
10–1 100 101 10–4 10–3 10–2 10–1 100
Fig. 2. MSD for dense microgel suspensions at different concentrations and example tracks (t ~ 20 s) centered in a circle of the same size as the particles (R = 470 nm). Particles go from simple diffusion at the lowest concentration of 7.4 wt % to complete arrest starting from 8.0 wt %.
signaling that the sample is a weak solid. Nonetheless, as we can see from the particle track, non-negligible motion is still present, albeit lo-calized, with an average linear displacement of≈ 100 nm. Further increasing the concentration to 8.9 wt % and then to 10.4 wt % results in displacements of the order of only 15 nm, comparable to the tracking resolution, so that we may consider the particles immobile and begin superresolution imaging.
From the time-resolved measurements of microgel displacements shown in Fig. 2, we determine the jamming point to cJ~ 8 wt %. Here,
c is the mass concentration of the microgel dispersion in wt/wt. From the jamming volume fractionzJ≃ 0.64, we can determine the swelling
ratio k of our microgels at the selected temperature of T = 22∘C. Converting the mass concentration to the effective volume fraction, k = zJ/cJ~ 8 andzeff= k c.
Global structural evolution of dense microgel assemblies We assess the global structural evolution from small-angle light scatter-ing on the same samples used in the dSTORM imagscatter-ing. The data shown in Fig. 3A show that the microgels pack densely, as highlighted by the pronounced diffraction ring. The absence of Bragg peaks confirms that
the microgels are quenched in an amorphous structure and do not crystallize, at least on the time scales of the experiments. The center-to-center pair distance (Fig. 3C) decays as c− 1/3, as expected, and the scattering intensities drop almost to zero for c > 22 wt %, which in-dicates that the system becomes very homogeneous at high densities. Moreover, we can obtain an estimate of the random close packing threshold by setting the pair distance equal to the unperturbed par-ticle diameter 2R = 940 nm and find c ~ 8 wt %, in agreement with the MSD data. In contrast to hard spheres, at this point, the closely packed microgel assembly is still very soft, and the elasticity rises on-ly gradualon-ly as the particle volume fraction is increased (10, 11). Two-color dSTORM superresolution microscopy of overpacked microgels
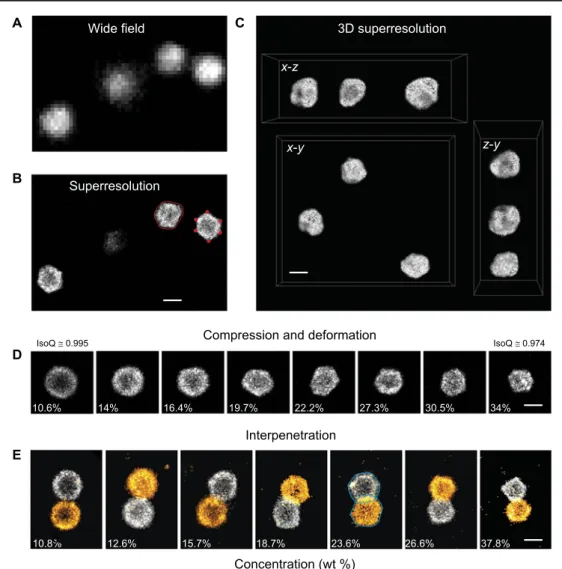
Using dSTORM, we can visualize small-scale size changes and shape deformations that would otherwise be invisible starting from a concen-tration of 10 wt % to more than≈ 30 wt % (Fig. 4). At lower concentra-tions, the microgel is undeformed and begins to be slightly compressed. As the concentration is increased, we begin to see deformations, albeit without significant change in size, and eventually, the microgels become faceted
Fig. 3. Small-angle light scattering from dense microgel suspensions. (A) Small-angle light scattering 2D plots from a thin h ~ 50 to 100mm layer of densely packed pNIPAM microgels. As the concentration is increased, the diffraction rings become wider and the microgels are packed closer to each other. The image gets dimmer as the suspension becomes more homogeneous. Scale bar, r/D = 1 (where r is the radial distance and D is the sample to detector distance). (B) Radially averaged scattered intensity I(q). (C) Pair distance between microgels as a function of concentration obtained from light scattering as 2.2p/qmax(white squares) and from dSTORM images of adjacent microgel pairs (black squares). Dotted line indicates the swollen particle diameter 2Rtot= 940 nm, indicating that particles start touching for c≥ 8 wt %. arb.u., arbitrary units.
at 16.4 wt % (Fig. 4, B and D). In Fig. 4C, we show a 3D reconstruction of several microgel particles at 25.6 wt % located in the vicinity of the glass interface. Although the z-resolution in 3D dSTORM (26) is a bit lower, we can still observe the irregular shape and faceting of the gels. From the 2D two-color images (Fig. 4D), we observe that the micro-gels interpenetrate, and the overlap area increases in this regime (24, 34). Once the ability to deform the particles is exhausted, only compression remains as a means to accommodate higher polymer concentrations. Above 22 wt %, we observe a steady decrease in particle size and no fur-ther increase in particle overlap.
The shape of highly deformed incompressible soft spheres, such as dense emulsions with a filling fraction approaching unity, is similar to the faceted polyhedral shape of air bubbles in dry foams (35, 36). The 3D reconstruction (Fig. 4C) indicates a polyhedral shape. However, extracting a full set of quantitative 3D data is very demanding (26), and moreover, the quality of the data is adversely affected by the lower axial resolution. A full 3D study is therefore beyond the scope of this work. Conversely, we extract information about the packing and defor-mation of microgels by analyzing the contour of 2D images of each
mi-crogel. To quantify the shape changes of the microgel particles, we calculate the isoperimetric quotient IsoQ = 4pA/P2
, where A denotes the enclosed surface and P denotes the perimeter. A perfect circle has IsoQ = 1, whereas polygons have lower values; for example, a regular hexagon has IsoQ≈ 0.91. We measure interpenetration from the overlap area between two microgels, with areas A1and A2, as Arel=
2Aoverlap/(A1+ A2), as shown in Fig. 5. The particle effective radius
is R ¼pffiffiffiffiffiffiffiffiA=p. In addition, we identify the vertices of the particles as the local maxima of curvature of the contour (Fig. 4B). The number of facets n is then equal to the number of vertices.
DISCUSSION
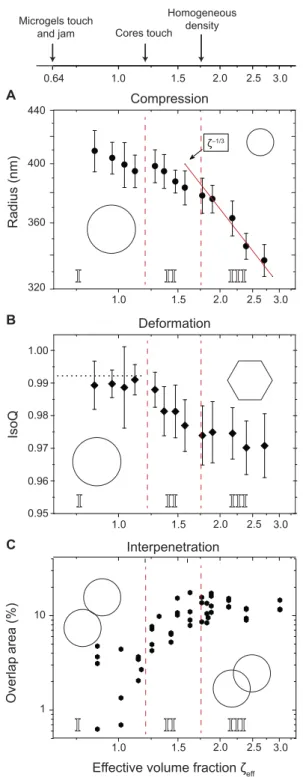
On the basis of the experimental data (Fig. 5), we can identify the three consecutive stages in the packing process. In the first stage, no deforma-tion of the particle contour can be detected, with values of IsoQ compatible with those in dilute conditions. Microgels are mildly com-pressed, but their shape is visually unchanged. Notice that this does not exclude the weak deformation of the outer particle corona, which is
Concentration (wt %)
Superresolution
Compression and deformation
Interpenetration 10.6% 14% 16.4% 19.7% 22.2% 27.3% 30.5% 34% 10.8%8 12.6% 15.7% 18.7% 23.6% 26.6% 37.8% A B D E Wide field IsoQ 0.995 IsoQ 0.974 3D superresolution C x-y x-z z-y
Fig. 4. One- and two-color superresolution microscopy of densly packed microgels. Wide-field (A) and dSTORM (B) images at high concentration (23.8 wt %). The higher resolution of dSTORM reveals significant microgel deformations. In red, an example of a contour (solid line) and vertices (full circles) used for analysis. (C) 3D dSTORM visualization of microgel particles at high concentration (25.6 wt %). For clarity, the microgel visualizations have been placed closer to each other. An animated 3D rendering is shown in movie S1. (D) dSTORM images of individual microgels showing compression and deformation as the concentration is increased. (E) Two-color 2D dSTORM of microgel pairs revealing partial interpenetration besides compression and deformation. Contour lines are shown for the 23.8 wt % sample with a relative overlap area of 17.38%. Scale bars, 500 nm.
beyond the detection limit of dSTORM. At the same time, we ob-serve the onset of interpenetration (34). In the second stage, above c ~ 15 wt % (zeff~ 1.3), the pair distance falls below the size of the
particle core 2Rcore≃ 760 nm. Now, the most marked feature we
ob-serve is the steady decrease of IsoQ, meaning that microgels are deform-ing, as can be seen by the unaided eye in the dSTORM images (Fig. 4). A maximum of deformation is asymptotically reached, and IsoQ plateaus at≈ 0.975. For these highly deformed particles (c ≥ 23.8 wt %), we find that the mean number of facets is n ≃ 6, with no measurable depen-dence on concentration (see also the Supplementary Materials). Overall, the IsoQ value is still quite large as compared to the hexagon value, which can be explained by the projection of the 3D shape to the imaging plane, the smooth contour, and rounded corners we obtain even for the most deformed microgels. Nonetheless, the imaging data capture well the onset and saturation of deformation. In parallel, interpenetration continues because the formation of facets increases the contact area. Be-tween 15 and 22 wt %, the particle volume remains almost constant. Once the shape deformation is complete, the final stage is reached. Now, the volume is filled almost homogeneously by the polymer gel. The latter is also confirmed by the vanishing light-scattering contrast (Fig. 3). For c > 22 wt % (zeff~ 1.75), the microgels are highly
over-packed and both interpenetration and deformation saturate, leaving compression as the only possible mechanism for accommodating high-er polymhigh-er concentrations up to the highest densities studied (zeff≥ 3).
Forzeff≥ 1.75, we observe a continuous decrease of the particle
ra-dius Rº c−1/3º z−1/3, which is a consequence of adding more par-ticles to the same total volume of the container.
MATERIALS AND METHODS Synthesis and characterization
Microgels were synthesized by free radical precipitation polymerization to obtain micrometer-sized particles as described in previous studies (10, 26). N-isopropylacrylamide (NIPAM) was used as the monomeric unit, N,N′-methylenebisacrylamide (BIS) was used as cross-linker, and 2,2′-azobis (2-methylpropionamidine) dihydrochloride was used as ini-tiator. To allow for fluorescent labeling with different dyes, free amines were introduced via a co-monomer, N-(3-aminopropyl)methacrylamide hydrochloride (APMA). Any dye that is amine-reactive, such as the N-hydroxysuccinimide (NHS) ester varieties, can be added at a later time. The result is microgels with a cross-linking of 4.9 mol % (mole percent) and co-monomer concentration of 0.27 mol %. The greatest effects that we aim to characterize occur at the periphery of the microgel, where the polymer density is significantly lower than in the core. To achieve better contrast when imaging, it is thus preferable to pre-dominantly label the outer region of the microgels. To this end, the co-monomer was added continuously to the reaction solution starting ≈10 min after particles have begun nucleating, which was signaled by the solution going from transparent to milky white. Dense samples were obtained by centrifugation of a dilute stock suspension and removal of the supernatant. The final concentration was determined by drying and weighing.
One- and two-color superresolution microscopy
For one-color imaging, we labeled microgels with the fluorophore Alexa Fluor 647 (AF647). To achieve blinking of fluorophores, we added 50 mM cysteamine (Sigma-Aldrich) and adjusted the pH to 8 using HCl (26). For two-color dSTORM, the cysteamine concentration was increased to 100 mM. First, a conventional wide-field image was taken for reference, and then the laser illumination power was increased to reach stochastic blinking conditions of the fluorophores (25). Be-tween 60 and 80,000 frames were then recorded at 60 to 100 frames
0.95 0.96 0.97 0.98 0.99 1.00 Radius (nm) IsoQ 1 10 Overlap area (%)
Effective volume fraction ζeff
440 400 360 320 ζ–1/3 0.64 1.0 1.5 2.0 2.5 3.0 1.0 1.5 2.0 2.5 3.0 1.0 1.5 2.0 2.5 3.0 1.0 1.5 2.0 2.5 3.0
I
II
II
III
III
Compression Deformation Interpenetration . . . .I
II
II
III
III
I
II
II
III
III
Cores touch Homogeneous density A B C Microgels touch and jamFig. 5. Mechanisms involved in densely packed colloidal sized fuzzy micro-gels. (A) Reduction of effective radii. (B) Isoperimetric quotient. Horizontal dotted line is the measured value under dilute conditions. Each point is obtained from 30 to 50 microgels. (C) Increased overlap area as a function of concentration. Each point corresponds to a single pair. Vertical dashed lines separate the different compression-deformation stages identified in this work. (I) Weak compression and onset of inter-penetration. (II) Shape deformation and interinter-penetration. (III) Isotropic compression of the microgel particles. The effective volume fractionzeffis related to the mass con-centration c via the swelling ratio k ~ 8,zeff= k c.
per second. The acquisition of a superresolution image requires that the sample remains immobile for the duration of the experiment, which is typically several minutes. We found that only sufficiently elastic samples, c > 10%, can be studied with dSTORM. Single fluorophores were localized, and the coordinates were used to reconstruct a superre-solved image (37, 38). 3D imaging was performed using the method of astigmatism (39), which we implemented using the adaptive optics mi-croscope add-on MicAO (Imagine Optic), as described previously (26). For the two-color dSTORM, we labeled tracer microgel particles with two different dyes and then imaged them separately. For the im-plementation of this two-color superresolution microscopy, we added a second dye, CF680R, which performed comparably to AF647 under the same conditions (40). Utilizing two dyes with partially overlapping ab-sorption and emission spectra, allowed us to excite both dyes with a single laser withl = 639 nm. The emitted light was then split via a dichroic mirror with a cutoff wavelength of 690 nm, and two spectrally distinct images, covering the same field of view, were formed side by side on the camera. The cutoff wavelength was chosen such that single-fluorophore images appear on both sides but with their intensity split differently depending on the fluorophore. Using freely available software (41), we found pairs of localizations and measured the ratio of intensities between the two. On the basis of previous calibration measurements performed with the two fluorophores, we could determine which type of fluorophore had produced a given intensity ratio and assign a color (details in the Supplementary Materials). Using this method, we achieved a color cross-talk of only 1%. The final superresolution image was reconstructed with localizations obtained from only one side, there-by avoiding further registration errors. Imaging conditions were the same as for one-color imaging. As an example, we imaged (Fig. 1B, conventional and SD-dSTORM) a mixture of microgels labeled with AF647 and CF680R. The same quality and level of detail were achieved for both colors. Two-color images of microgel pairs were taken at the sur-face only. This choice was made to ensure that the two microgels were at the same height, thus limiting projection artefacts when quantifying the data for interpenetration.
Image analysis
We used a two-step method implemented in Matlab to delineate the microgel contour. First, the rough contour was determined using a Laplacian of Gaussian edge detection method. Second, we smoothed the contour using Fourier descriptors (42). The method works by map-ping the boundary coordinates onto complex numbers z = x + iy, followed by taking the Fourier transform. An inverse transform would yield the original shape, whereas using just a few terms, or descriptors, out of over 100 before back-transforming effectively removes high-frequency noise. Using this method, we sacrificed sharp corners but gained a more reliable measure of perimeters (see also the Supplemen-tary Materials). From the smoothed contour, we obtained the area A and the perimeter P that we used to calculate an effective radiusR ¼pffiffiffiffiffiffiffiffiA=p. We measured the curvaturek along the contour r = (x, y) in Cartesian coordinates, defined as k = |x′y′′ − y′x′′|/(x′2 + y′2)3/2. We then identified the vertices of the particles as the local maxima of curvature (Fig. 4B). The number of facets n was equal to the num-ber of vertices.
Small-angle light scattering
A collimated laser beam withl = 532 nm impinges on a thin layer of compressed microgels, sandwiched between a glass coverslip and cover slide, with a thickness of h ~ 50 to 100 mm. Diffracted light
was collected on a screen placed at a distance D away from the sample, which was then imaged with a camera. Every point on the screen, with distance r from the optical axis, defines an angle tan(q) = r/D and a scattering vector q with magnitude q = 4p/l sin(q/2). The peak in dif-fraction is related to the particle’s center-to-center pair distance through d ≃ 2.2p/qmax(43).
SUPPLEMENTARY MATERIALS
Supplementary material for this article is available at http://advances.sciencemag.org/cgi/ content/full/3/10/e1700969/DC1
section S1. Static light scattering characterization section S2. Contour of microgel images
section S3. Two-color superresolution microscopy—Calibration procedure fig. S1. Form factor of pNIPAM microgels in dilute conditions. fig. S2. Determination of microgel contours by using Fourier descriptors. fig. S3. Assessment of correlations between size and shape.
fig. S4. Sample images of deformed microgels at 34 wt % with different values of IsoQ. fig. S5. Vertices detected as maxima of curvature for deformed particles at different concentrations. fig. S6. Distribution P(Lexp/Lth) at a concentration of 23.8 wt %.
fig. S7. Principle of two-color imaging by spectral demixing.
table S1. Average number of facets〈n〉 as a function of concentration c in the final regime of isotropic compression.
table S2. SD of the distribution P(Lexp/Lth) characterizing the shape variation in the 2D images
of microgels via the fluctuations of Lexp/Lth.
movie S1. Animated 3D visualization of deformed microgels within a densely packed suspension at 25.6 wt %.
REFERENCES AND NOTES
1. A. Fernandez-Nieves, H. Wyss, J. Mattsson, D. A. Weitz, Microgel Suspensions: Fundamentals and Applications (John Wiley & Sons, 2011).
2. S. Chaterji, I. K. Kwon, K. Park, Smart polymeric gels: Redefining the limits of biomedical devices. Prog. Polym. Sci. 32, 1083–1122 (2007).
3. M. Karg, I. Pastoriza-Santos, J. Pérez-Juste, T. Hellweg, L. M. Liz-Marzán, Nanorod-coated PNIPAM microgels: Thermoresponsive optical properties. Small 3, 1222–1229 (2007). 4. M. Karg, T. Hellweg, New“smart” poly(NIPAM) microgels and nanoparticle microgel
hybrids: Properties and advances in characterisation. Curr. Opin. Colloid Interface Sci. 14, 438–450 (2009).
5. R. Pelton, Temperature-sensitive aqueous microgels. Adv. Colloid Interface Sci. 85, 1–33 (2000).
6. J. Zhang, S. Xu, E. Kumacheva, Photogeneration of fluorescent silver nanoclusters in polymer microgels. Adv. Mater. 17, 2336–2340 (2005).
7. L. Ye, P. A. G. Cormack, K. Mosbach, Molecular imprinting on microgel spheres. Anal. Chim. Acta 435, 187–196 (2001).
8. C. Dagallier, H. Dietsch, P. Schurtenberger, F. Scheffold, Thermoresponsive hybrid microgel particles with intrinsic optical and magnetic anisotropy. Soft Matter 6, 2174–2177 (2010).
9. J. J. Crassous, A. M. Mihut, L. K. Månsson, P. Schurtenberger, Anisotropic responsive microgels with tuneable shape and interactions. Nanoscale 7, 15971–15982 (2015). 10. H. Senff, W. Richtering, Temperature sensitive microgel suspensions: Colloidal phase
behavior and rheology of soft spheres. J. Chem. Phys. 111, 1705–1711 (1999). 11. F. Scheffold, P. Díaz-Leyva, M. Reufer, N. Ben Braham, I. Lynch, J. L. Harden, Brushlike
interactions between thermoresponsive microgel particles. Phys. Rev. Lett. 104, 128304 (2010).
12. Z. Zhang, N. Xu, D. T. N. Chen, P. Yunker, A. M. Alsayed, K. B. Aptowicz, P. Habdas, A. J. Liu, S. R. Nagel, A. G. Yodh, Thermal vestige of the zero-temperature jamming transition. Nature 459, 230–233 (2009).
13. D. Paloli, P. S. Mohanty, J. J. Crassous, E. Zaccarelli, P. Schurtenberger, Fluid–solid transitions in soft-repulsive colloids. Soft Matter 9, 3000–3004 (2013).
14. F. Scheffold, F. Cardinaux, T. G. Mason, Linear and nonlinear rheology of dense emulsions across the glass and the jamming regimes. J. Phys. Condens. Matter 25, 502101 (2013).
15. J. Lin, I. Jorjadze, L.-L. Pontani, M. Wyart, J. Brujic, Evidence for marginal stability in emulsions. Phys. Rev. Lett. 117, 208001 (2016).
16. G. Katgert, B. P. Tighe, M. van Hecke, The jamming perspective on wet foams. Soft Matter 9, 9739–9746 (2013).
17. J. Mattsson, H. M. Wyss, A. Fernandez-Nieves, K. Miyazaki, Z. Hu, D. R. Reichman, D. A. Weitz, Soft colloids make strong glasses. Nature 462, 83–86 (2009).
18. U. Gasser, J. S. Hyatt, J.-J. Lietor-Santos, E. S. Herman, L. A. Lyon, A. Fernandez-Nieves, Form factor of pNIPAM microgels in overpacked states. J. Chem. Phys. 141, 034901 (2014).
19. A. P. H. Gelissen, A. Oppermann, T. Caumanns, P. Hebbeker, S. K. Turnhoff, R. Tiwari, S. Eisold, U. Simon, Y. Lu, J. Mayer, W. Richtering, A. Walther, D. Wöll, 3D structures of responsive nanocompartmentalized microgels. Nano Lett. 16, 7295–7301 (2016). 20. J. R. Seth, L. Mohan, C. Locatelli-Champagne, M. Cloitre, R. T. Bonnecaze, A
micromechanical model to predict the flow of soft particle glasses. Nat. Mater. 10, 838–843 (2011).
21. A. Ikeda, L. Berthier, P. Sollich, Unified study of glass and jamming rheology in soft particle systems. Phys. Rev. Lett. 109, 018301 (2012).
22. P. F. Damasceno, M. Engel, S. C. Glotzer, Predictive self-assembly of polyhedra into complex structures. Science 337, 453–457 (2012).
23. M. Stieger, W. Richtering, J. S. Pedersen, P. Lindner, Small-angle neutron scattering study of structural changes in temperature sensitive microgel colloids. J. Chem. Phys. 120, 6197–6206 (2004).
24. D. J. Mulder, T. L. Kuhl, Polymer brushes in restricted geometries. Soft Matter 6, 5401–5407 (2010).
25. B. Huang, M. Bates, X. Zhuang, Super-resolution fluorescence microscopy. Annu. Rev. Biochem. 78, 993–1016 (2009).
26. G. M. Conley, S. Nöjd, M. Braibanti, P. Schurtenberger, F. Scheffold, Superresolution microscopy of the volume phase transition of pNIPAM microgels. Colloids Surf. A 499, 18–23 (2016).
27. L. Kisley, R. Brunetti, L. J. Tauzin, B. Shuang, X. Yi, A. W. Kirkeminde, D. A. Higgins, S. Weiss, C. F. Landes, Characterization of porous materials by fluorescence correlation spectroscopy super-resolution optical fluctuation imaging. ACS Nano 9, 9158–9166 (2015).
28. M. Heilemann, S. van de Linde, M. Schüttpelz, R. Kasper, B. Seefeldt, A. Mukherjee, P. Tinnefeld, M. Sauer, Subdiffraction-resolution fluorescence imaging with conventional fluorescent probes. Angew. Chem. Int. Ed. 47, 6172–6176 (2008).
29. A. Lampe, V. Haucke, S. J. Sigrist, M. Heilemann, J. Schmoranzer, Multi-colour direct STORM with red emitting carbocyanines. Biol. Cell 104, 229–237 (2012).
30. M. Reufer, P. Dıaz-Leyva, I. Lynch, F. Scheffold, Temperature-sensitive poly(N-isopropyl-acrylamide) microgel particles: A light scattering study. Eur. Phys. J. E 28, 165–171 (2009). 31. E. Zaccarelli, W. C. K. Poon, Colloidal glasses and gels: The interplay of bonding and
caging. Proc. Natl. Acad. Sci. U.S.A. 106, 15203–15208 (2009).
32. A. J. Liu, S. R. Nagel, The jamming transition and the marginally jammed solid. Annu. Rev. Condens. Matter Phys. 1, 347–369 (2010).
33. J. C. Crocker, D. G. Grier, Methods of digital video microscopy for colloidal studies. J. Colloid Interface Sci. 179, 298–310 (1996).
34. P. S. Mohanty, S. Nöjd, K. van Gruijthuijsen, J. J. Crassous, M. Obiols-Rabasa, R. Schweins, A. Stradner, P. Schurtenberger, Interpenetration of polymeric microgels at ultrahigh densities. Sci. Rep. 7, 1487 (2017).
35. T. G. Mason, J. N. Wilking, K. Meleson, C. B. Chang, S. M. Graves, Nanoemulsions: Formation, structure, and physical properties. J. Phys. Condens. Matter 19, 079001 (2007). 36. R. Phelan, D. Weaire, K. Brakke, Computation of equilibrium foam structures using the
surface evolver. Exp. Math. 4, 181–192 (1995).
37. M. Ovesnỳ, P. Křížek, J. Borkovec, Z. Švindrych, G. M. Hagen, ThunderSTORM: A comprehensive ImageJ plug-in for PALM and STORM data analysis and super-resolution imaging. Bioinformatics 30, 2389–2390 (2014).
38. M. El Beheiry, M. Dahan, ViSP: Representing single-particle localizations in three dimensions. Nat. Methods 10, 689–690 (2013).
39. B. Huang, W. Wang, M. Bates, X. Zhuang, Three-dimensional super-resolution imaging by stochastic optical reconstruction microscopy. Science 319, 810–813 (2008).
40. E. Platonova, C. M. Winterflood, H. Ewers, A simple method for GFP- and RFP-based dual color single-molecule localization microscopy. ACS Chem. Biol. 10, 1411–1416 (2015). 41. G. Tadeus, A. Lampe, J. Schmoranzer, SDmixer—A versatile software tool for spectral demixing of multicolor single molecule localization data. Methods Appl. Fluorescence 3, 037001 (2015).
42. C. T. Zahn, R. Z. Roskies, Fourier descriptors for plane closed curves. IEEE Trans. Comput. C-21, 269–281 (1972).
43. J. Liu, H.-J. Schöpe, T. Palberg, An improved empirical relation to determine the particle number density in charged colloidal fluids. Part. Part. Syst. Charact. 17, 206–212 (2000). Acknowledgments: We thank I. Spühler and V. Trappe for fruitful discussions. Funding: This work was supported by the Swiss National Science Foundation through project numbers 149867 and 169074 and through the National Centre of Competence in Research Bio-Inspired Materials (G.M.C., P.A., and F.S.). F.S. acknowledges financial support by the Adolphe Merkle Foundation. P.S. acknowledges support from the European Research Council (ERC-339678-COMPASS) and the Swedish Research Council (621-2014-4037). Author contributions: G.M.C. and F.S. conceived the study and designed the experiments. G.M.C. and S.N. designed and carried out the synthesis of the microgels under the supervision of F.S. and P.S. G.M.C. and P.A. performed all experiments, analyzed the raw data, and prepared the figures. The manuscript was written by G.M.C. and F.S. with input from P.S. and S.N. Competing interests: The authors declare that they have no competing interests.Data and materials availability: All data needed to evaluate the conclusions in the paper are present in the paper and/or the Supplementary Materials. Additional data related to this paper may be requested from the authors. Submitted 3 April 2017
Accepted 19 September 2017 Published 20 October 2017 10.1126/sciadv.1700969
Citation:G. M. Conley, P. Aebischer, S. Nöjd, P. Schurtenberger, F. Scheffold, Jamming and
overpacking fuzzy microgels: Deformation, interpenetration, and compression. Sci. Adv. 3, e1700969 (2017).