HAL Id: hal-01219017
https://hal.archives-ouvertes.fr/hal-01219017
Submitted on 21 Oct 2015
HAL is a multi-disciplinary open access
archive for the deposit and dissemination of
sci-entific research documents, whether they are
pub-lished or not. The documents may come from
teaching and research institutions in France or
abroad, or from public or private research centers.
L’archive ouverte pluridisciplinaire HAL, est
destinée au dépôt et à la diffusion de documents
scientifiques de niveau recherche, publiés ou non,
émanant des établissements d’enseignement et de
recherche français ou étrangers, des laboratoires
publics ou privés.
to pesticides and drugs
Denis Bourguet, François Delmotte, Pierre Franck, Thomas Guillemaud,
Xavier Reboud, Corinne Vacher, Anne Sophie Walker
To cite this version:
Denis Bourguet, François Delmotte, Pierre Franck, Thomas Guillemaud, Xavier Reboud, et al.. The
skill and style to model the evolution of resistance to pesticides and drugs. Evolutionary Applications,
Blackwell, 2010, 3 (4), pp.375-390. �10.1111/j.1752-4571.2010.00124.x�. �hal-01219017�
O R I G I N A L A R T I C L E
The skill and style to model the evolution of resistance
to pesticides and drugs
REX Consortium
INRA, France
Introduction
The massive use of drugs in medicine and of pesticides in agricultural systems since the 1950’s have led to the selec-tion of highly adapted resistant biotypes in natural popu-lations of microbes and pests (Georghiou 1986; Guillemot 1999; D’Alessandro and Buttiens 2001; Hastings 2004; Levy and Marshall 2004). The evolution of resistance is a serious issue worldwide and several experimental studies have been carried out on resistant microbes and pests collected from hospitals and agricultural fields. These studies focused principally on the physiological mecha-nisms of resistance (Powles and Holtum 1994; McGowan and Tenover 1997; Raymond et al. 1998; Hakenbeck 1999; Caprio 2001; Gahan et al. 2001; Hsiou et al. 2001; Morin et al. 2003; Courcambeck et al. 2006), the genetic determinism and mode of inheritance of resistance (Edgar and Bibi 1997; Gould et al. 1997; Tabashnik et al. 1997, 2000; Andow and Alstad 1998; Bourguet et al. 2000, 2003; Ferre´ and Van Rie 2002; Tran and Jacoby 2002; Ge´nissel et al. 2003; Roux et al. 2004; Chen et al. 2007) and, to a
lesser extent, the relative fitness of resistant biotypes in the absence of drugs or pesticides (Groeters et al. 1993; Cohan et al. 1994; Bergelson and Purrington 1996; Frost et al. 2000; Oppert et al. 2000; Purrington 2000; Carrie`re et al. 2001; Gagneux 2009; Ward et al. 2009).
In addition to carrying out these experimental studies,
the scientific community has developed theoretical
approaches for investigating the way in which evolution-ary forces – mutation, selection, migration and drift – govern the speed and outcome of resistance evolution. The resulting theoretical models, assessing the relative influence of different evolutionary forces, constitute a useful tool for comparing the efficacy of existing man-agement strategies and for designing new strategies (Tabashnik 1986). We previously highlighted the structure of the scientific community developing these theoretical models (REX Consortium, 2007). We analysed co-author-ship and co-citation networks on the basis of 187 articles published from 1977 to 2006 on models of the evolution of resistance to all major classes of pesticides and drugs. We identified two main groups of scientists that
Keywords
drugs, evolution of resistance, mathematical modelling, pesticides, resistance to xenobiotics.
Correspondence
Thomas Guillemaud, UMR 1301 IBSV, INRA, Universite´ de Nice-Sophia Antipolis, CNRS, 400 Route des Chappes, F-06903 Sophia Antipolis, France. Tel.: +33 492 386 481; fax:+33 492 386 401; e-mail : guillem@sophia.inra.fr Received: 24 September 2009 Accepted: 6 February 2010
First published online: 29 March 2010 doi:10.1111/j.1752-4571.2010.00124.x
Abstract
Resistance to pesticides and drugs led to the development of theoretical models aimed at identifying the main factors of resistance evolution and predicting the efficiency of resistance management strategies. We investigated the various ways in which the evolution of resistance has been modelled over the last three dec-ades, by reviewing 187 articles published on models of the evolution of resis-tance to all major classes of pesticides and drugs. We found that (i) the technical properties of the model were most strongly influenced by the class of pesticide or drug and the target organism, (ii) the resistance management strat-egies studied were quite similar for the different classes of pesticides or drugs, except that the refuge strategy was mostly used in models of the evolution of resistance to insecticidal proteins, (iii) economic criteria were rarely used to evaluate the evolution of resistance and (iv) the influence of mutation, migra-tion and drift on the speed of resistance development has been poorly investi-gated. We propose guidelines for the future development of theoretical models of the evolution of resistance. For instance, we stress the potential need to give more emphasis to the three evolutionary forces migration, mutation and genetic drift rather than simply selection.
collaborate very little: the first group consists of ecologists or agronomists working on pesticide resistance, whereas the second group includes medical scientists interested in drug resistance. The two groups publish their research in their own journals and have their own keystone references (REX Consortium, 2007). This structure of the scientific community may have led to marked differences between the two groups in terms of the modelling approaches developed for studies of the evolution of resistance to pesticides and drugs.
Actually, four major nonmutually exclusive hypotheses may account for differences in the approaches developed for modelling resistance evolution: (1) there may be a lack of exchange between the two main groups of scien-tists, leading to the development of different lineages of models; (2) the organism studied may affect the biologi-cal parameters included in the model and the manage-ment strategies tested. For example, the availability of a specific means of control for any particular organism may have influenced the choice of strategies assessed with the model, even though a much broader array of resis-tance management strategies (including those not appli-cable for economic, technical or ethical reasons at the time of the study) could be investigated with theoretical models; (3) the mathematical approach (MT) chosen by the modeller may constrain the resistance management strategies and the underlying evolutionary forces that can theoretically be explored. Indeed, two major MT have been used in the modelling of resistance evolution (Levin 2001, 2002): (i) the population genetics approach, which considers changes in the frequencies of resistant and sus-ceptible individuals as a function of pesticide or drug (PD) use; (ii) the epidemiological approach, which is related to the compartment model tradition of the math-ematical epidemiology of parasites (Anderson and May 1991) and (4) the features of the model may have chan-ged over time, because of the accumulation of knowledge about the evolution of resistance and increases in com-puter power.
In this study, we analysed a panel of 187 articles pub-lished over the last 30 years and involving the use of a theoretical model to study the evolution of resistance to pesticides or drugs. We described the 187 models, by recording the parameters describing (i) the biology of the target organism, (ii) the technical properties of the model, (iii) the resistance management strategies tested and (iv) the criteria used to evaluate the evolution of resistance. We then determined which of the four hypotheses cited above best accounted for variations in the features of the model. We did this by assessing the relative effects of the scientific community structure, the class of PD, the MT and the year of publication on the variability of the mod-el’s features. Based on our results, we propose guidelines
for the future development of theoretical models of the evolution of resistance.
Materials and methods
Construction of the bibliographical database
The database of models of the evolution of resistance to the most common classes of pesticides (insecticides, fun-gicides, herbicides, miticides and insecticidal proteins, such as Bacillus toxins) and drugs (antibiotics, antiviral, antimalarial and antihelmintic drugs) has been described in a previous study (REX Consortium, 2007). We used a three-step process to select relevant articles. We first searched for articles in three bibliographical databases (CABs 1973–2006, Current Contents 1998–2006 and Medline 1950–2006) with a formula containing the words model* and resistan* (REX Consortium, 2007). This first step identified 1894 articles. The summary and keywords of each article were then carefully and independently read by two of us, to select articles deal-ing with a mathematical model or a computer simula-tion of the evolusimula-tion of resistance over time in response to selective pressure exerted by a pesticide or a drug. This second step identified 266 articles. In the third step, the seven authors of this study, all familiar with the field of resistance evolution, carefully read each of these 266 articles. Each author was given a randomly chosen set of 14 articles to be read by all the readers, plus a randomly chosen set of 36 articles to be read by that author alone. A reading grid of 34 questions was filled in for each of the 187 articles finally considered relevant for modelling the evolution of resistance to pesticides or drugs.
Individual reader error rate
We evaluated the individual error rate by using the set of 14 articles read by the seven authors of the present study. Only six of these 14 articles were considered relevant by all of us. These six articles were used to assess the agreement (congruence rate) between the answers to the questions on the reading grid given by the seven readers. For each question, the congruence rate was calculated as the proportion of the six relevant articles for which all the readers provided the same answer. This estimate of the congruence rate was then used to calculate the individual error rate, defined as the probability of a reader giving an ‘incorrect’ answer to the question. Assuming that the individual error rate P is identical for
all readers, the congruence rate is c = P7+ (1) P)7,
where P7is the probability of all seven readers giving the
incorrect answer and (1 ) P)7 is the probability of all the
Characterization of the models
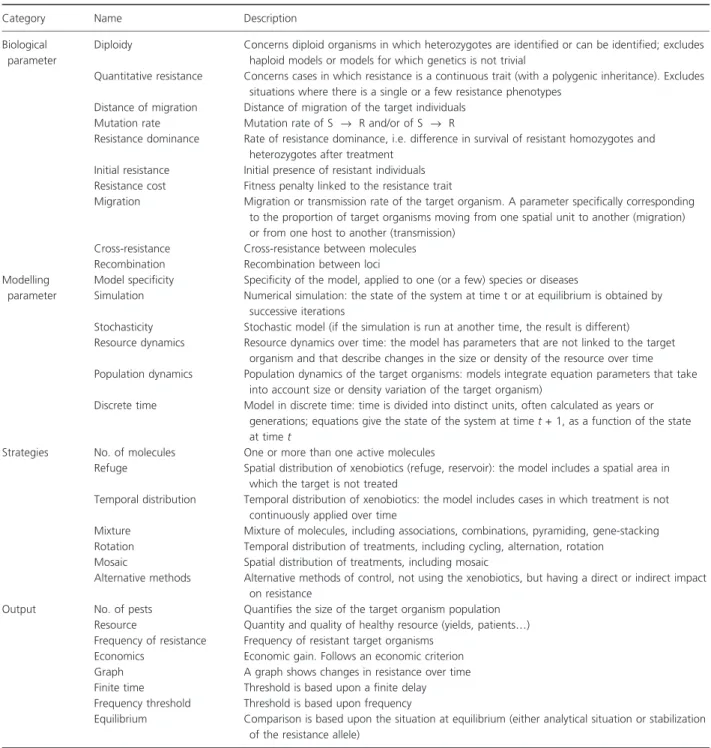
Thirty one of the 34 questions of the reading grid were specifically used to characterize the range of diversity of model features, from the genetic features of resistance to the socio-economic criteria used to assess the efficiency of resistance management strategies. Each of the 187 models was characterized for these 31 parameters (further referred to as ‘model parameters’ and described in Table 1), which
can be classified as follows: (i) parameters describing the biology of the target organism and the genetics of resis-tance, (ii) parameters describing the technical properties of the models, (iii) parameters describing the manage-ment strategies for delaying or preventing the evolution of resistance studied and (iv) the output parameters used to assess the evolution of resistance. All model parameters had two levels (‘taken into account’ or ‘not taken into account’; ‘yes’ or ‘no’). We ordered them according to
Table 1. The 31 model parameters used to describe the 187 articles. Category Name Description Biological
parameter
Diploidy Concerns diploid organisms in which heterozygotes are identified or can be identified; excludes haploid models or models for which genetics is not trivial
Quantitative resistance Concerns cases in which resistance is a continuous trait (with a polygenic inheritance). Excludes situations where there is a single or a few resistance phenotypes
Distance of migration Distance of migration of the target individuals Mutation rate Mutation rate of S fi R and/or of S fi R
Resistance dominance Rate of resistance dominance, i.e. difference in survival of resistant homozygotes and heterozygotes after treatment
Initial resistance Initial presence of resistant individuals Resistance cost Fitness penalty linked to the resistance trait
Migration Migration or transmission rate of the target organism. A parameter specifically corresponding to the proportion of target organisms moving from one spatial unit to another (migration) or from one host to another (transmission)
Cross-resistance Cross-resistance between molecules Recombination Recombination between loci Modelling
parameter
Model specificity Specificity of the model, applied to one (or a few) species or diseases
Simulation Numerical simulation: the state of the system at time t or at equilibrium is obtained by successive iterations
Stochasticity Stochastic model (if the simulation is run at another time, the result is different) Resource dynamics Resource dynamics over time: the model has parameters that are not linked to the target
organism and that describe changes in the size or density of the resource over time Population dynamics Population dynamics of the target organisms: models integrate equation parameters that take
into account size or density variation of the target organism)
Discrete time Model in discrete time: time is divided into distinct units, often calculated as years or generations; equations give the state of the system at time t + 1, as a function of the state at time t
Strategies No. of molecules One or more than one active molecules
Refuge Spatial distribution of xenobiotics (refuge, reservoir): the model includes a spatial area in which the target is not treated
Temporal distribution Temporal distribution of xenobiotics: the model includes cases in which treatment is not continuously applied over time
Mixture Mixture of molecules, including associations, combinations, pyramiding, gene-stacking Rotation Temporal distribution of treatments, including cycling, alternation, rotation
Mosaic Spatial distribution of treatments, including mosaic
Alternative methods Alternative methods of control, not using the xenobiotics, but having a direct or indirect impact on resistance
Output No. of pests Quantifies the size of the target organism population Resource Quantity and quality of healthy resource (yields, patients…) Frequency of resistance Frequency of resistant target organisms
Economics Economic gain. Follows an economic criterion Graph A graph shows changes in resistance over time Finite time Threshold is based upon a finite delay Frequency threshold Threshold is based upon frequency
Equilibrium Comparison is based upon the situation at equilibrium (either analytical situation or stabilization of the resistance allele)
whether they were frequently (more than 80%) or rarely (lower than 20%) considered in the 187 models.
Characterization of the explanatory factors
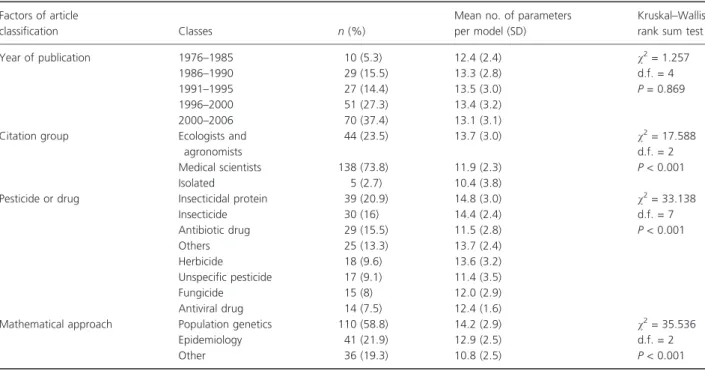
We hypothesized that differences between the features of the models described in the 187 different articles could be accounted for by four factors (Table 2). The three remaining questions on the reading grid made it possible to define three of these factors: the class of PD studied, the year of publication and the MT used (population genetics model or epidemiological model). The last factor corresponds to the citation group (CG) to which the articles belonged. These CG were defined from the
co-citation analysis performed in our previous study
(REX Consortium, 2007).
We investigated whether these explanatory factors accounted for variations among the 187 models based on (i) the total number of model parameters taken into account, (ii) the nature of each model parameter taken into account and (iii) the combination of model parame-ters taken into account.
Identification of the factors accounting for the total number of model parameters
The total number of model parameters taken into account was counted for each model. Kruskal–Wallis rank sum tests were carried out with the kruskal.test function
of r (R_Development_Core_Team 2006), to assess the effects of the various explanatory factors on the total number of model parameters.
Identification of the factors best accounting for the use of each model parameter
Then we performed a set of statistical analyses to identify the factor best accounting for the use of each model param-eter. We first tested the null hypothesis of independence between the various explanatory factors and each of the model parameters, using Fisher’s pseudo-exact tests on contingency tables (with 10 000 permutations of the chisq.test function of r). False discovery rate correction was used to correct for multiple testing (Benjamini and Hoch-berg 1995). We then fitted generalized linear models to each model parameter, using binomial error and logit link (Venables and Ripley 2002). For each model parameter, we calculated the Akaike Information Criterion (AIC) of both the full model (model parameter = CG + PD + MT + year of publication) and each of the four linear models including only three of the four explanatory factors. We calculated the difference in AIC (DAIC) between the full model and each of the four linear models containing three factors each. A positive DAIC indicates that the three-factor model gives a worse fit (in terms of deviance explained and number of parameters used) than the full model. The three-factor model with the largest positive DAIC was selected and the factor excluded from this model was
Table 2. Distribution of the four explanatory factors among the 187 models analysed. Factors of article
classification Classes n (%)
Mean no. of parameters per model (SD)
Kruskal–Wallis rank sum test Year of publication 1976–1985 10 (5.3) 12.4 (2.4) v2= 1.257 d.f. = 4 P = 0.869 1986–1990 29 (15.5) 13.3 (2.8) 1991–1995 27 (14.4) 13.5 (3.0) 1996–2000 51 (27.3) 13.4 (3.2) 2000–2006 70 (37.4) 13.1 (3.1) Citation group Ecologists and
agronomists 44 (23.5) 13.7 (3.0) v2= 17.588 d.f. = 2 P < 0.001 Medical scientists 138 (73.8) 11.9 (2.3) Isolated 5 (2.7) 10.4 (3.8)
Pesticide or drug Insecticidal protein 39 (20.9) 14.8 (3.0) v2= 33.138 d.f. = 7 P < 0.001 Insecticide 30 (16) 14.4 (2.4) Antibiotic drug 29 (15.5) 11.5 (2.8) Others 25 (13.3) 13.7 (2.4) Herbicide 18 (9.6) 13.6 (3.2) Unspecific pesticide 17 (9.1) 11.4 (3.5) Fungicide 15 (8) 12.0 (2.9) Antiviral drug 14 (7.5) 12.4 (1.6)
Mathematical approach Population genetics 110 (58.8) 14.2 (2.9) v2= 35.536 d.f. = 2 P < 0.001 Epidemiology 41 (21.9) 12.9 (2.5)
considered to be the most explanatory according to the AIC. The best explanatory factor was the most explanatory according to the AIC if it was also significant according to Fisher’s exact test. Finally, we determined the proportion of the total deviance accounted for by each of the four models including only one of the explanatory factors.
Identification of the factors accounting for the combina-tion of model parameters
We assessed the effects of the various explanatory factors on the combination of model parameters, by hierarchical clustering of the 187 articles on the basis of pairwise ‘Manhattan’ distance (i.e. the sum of the differences for each of the model parameters) under the ‘complete’ clustering option of the hclust function of r. Bootstrap values were estimated for the nodes of the tree, with the pvclust function available in the pvclust library of r. The correspondence between this clustering and the classifica-tion of articles as a funcclassifica-tion of the four factors consid-ered was assessed by reporting these factors on the leaves of the tree.
Results
Individual error rates for parameter assignment
Individual error rates were <2.6% for each of the three explanatory factors: PD, MT and Year of publication. They were also low for most model parameters. Mean error rates were 2.5%, 3.2%, 3.7% and 6.5% for the bio-logical parameters, the modelling parameters, strategies and outputs respectively. Error rates exceeded 5% for
seven model parameters (Resource dynamics, Discrete time, Resistance cost, Migration, Temporal distribution, Number of pests and Resource). Some of these reading errors could be as a result of the lack of clarity with which some models were described. These errors may have decreased the statistical power of some of our analy-ses, but they probably had too weak an effect to change our conclusions significantly.
Frequently considered versus poorly investigated model parameters
Out of the thirty-one model parameters (Table 1), four were frequently taken into account whereas six parameters were poorly investigated (Fig. 1). Of the 11 model param-eters describing the biology of the organism and the genet-ics of the resistance, Initial resistance was frequently considered (88%). Conversely, Cross-resistance, Quantita-tive resistance, Recombination and Distance of migration were seldom considered (5%, 7%, 9% and 11% respec-tively). All the parameters describing the technical proper-ties of the models were used in more than 20% of models. The most frequently used parameters were Simulation (89%) and Stochasticity (80%). None of the strategies for delaying or preventing the evolution of resistance was investigated in more than 80% of the models. The man-agement strategy was not specified in 15% of the models and the Mosaic strategy was studied in only 13 articles (7%). Last, among the eight parameters describing the output criteria used to assess the evolution of resistance, the final Frequency of resistance was considered in 80% of the articles, whereas the Economic criterion was rarely
Figure 1 Frequency of the 31 model parameters of the reading grid in the articles. Light grey: biological parameters; black: modelling parameters; white: modelling strategies; dark grey: model output. The dotted lines indicate frequencies of 20% and 80%.
used (6%). These findings, especially the identification of poorly investigated parameters, are useful for deriving guidelines for future modelling efforts (see Discussion). Factors accounting for the total number of model parameters
The number of model parameters taken into account ran-ged from 7 to 20 in the 187 articles. Among the four explanatory factors, three had a significant effect on the total number of parameters per model: CG, PD and the MT (Table 2). It is noteworthy that the number of model parameters was similar (13.2 ± 3.0) in all publication years. Hence, the complexity of the models did not increase over time through the addition of model param-eters.
Factors best accounting for the use of each model parameter
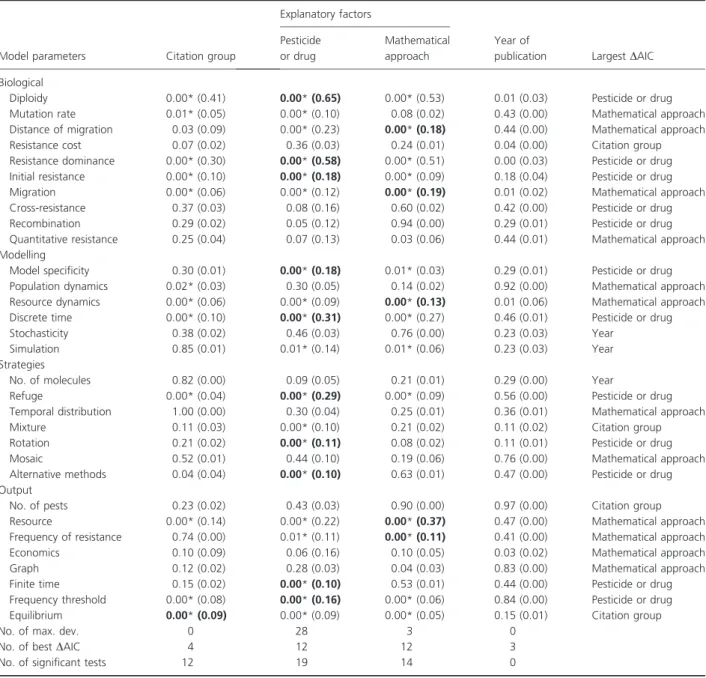
The nature of the model parameters taken into account did not change over time, since Year of publication was never found to be the best explanatory factor for the use of each of the 31 model parameters. According to both Fisher’s exact tests and the AIC, the factors PD, MT and CG were the best explanatory factors for ten, five and one model parameters respectively (Table 3; Fig. 2). These 16 parameters included five biological parameters, three parameters describing the technical properties of models, three parameters describing the resistance management strategies and five parameters related to the output of the models. They are presented in detail below.
Five of the 11 factors describing the biology of the tar-get organism and the genetics of resistance were signifi-cantly influenced by at least one of the four explanatory factors, according to both Fisher’s exact tests and AIC. The PD factor best accounted for Diploidy (65% of the total deviance), Resistance dominance (58%), Initial resis-tance (18%) and Mutation rate (10%). Initial resisresis-tance was included in almost all the models, but to a lesser extent in those dealing with resistance to fungicides, anti-biotics and antiviral drugs. About 50% of the models dealing with resistance to herbicides, antibiotics and antiviral drugs included Mutation rate, whereas this parameter was rarely considered in models dealing with fungicide resistance. The MT factor best accounted for Migration (19%) and Distance of migration (18%). Migration was more often taken into account in epidemi-ological (ca. 90%) than in population genetics (60%) models. The Distance of migration was considered in only 20% of population genetics models dealing with resis-tance to insecticides (including insecticidal proteins) and herbicides.
Half of the parameters describing the technical prop-erties of the models were significantly influenced by at least one of the four explanatory factors, according to both Fisher’s exact tests and AIC. The PD factor best accounted for Discrete time (31% of the total deviance) and Model specificity (18%). Discrete time was mostly used for modelling resistance of countable organisms, such as weeds or insects (90% of the corresponding articles). Conversely, this parameter was considered by <50% of the articles modelling resistance to fungicides or to antibiotics and antiviral drugs. As expected, general models of resistance to pesticides almost never specified a target organism, whereas most models of the evolution of resistance to antiviral drugs were spe-cific (85% of the articles). The Resource dynamics parameter was best accounted for by the MT factor (13%).
Only three of the seven parameters describing the resistance management strategies were significantly influ-enced by at least one of the four explanatory factors, according to both Fisher’s exact tests and AIC. Refuge, Rotation and Alternative methods were all largely accounted for by the PD factor (29%, 11% and 10% of the total deviance respectively). The Temporal distribu-tion of a given molecule, and the Mixture and Mosaic strategies were not structured according to any of the four explanatory factors. The Refuge strategy was typi-cally considered when modelling resistance to insecticidal proteins (>95% of the articles) or to insecticides (45%). The Rotation strategy was never considered in models dealing with the evolution of antiviral drug resistance. This strategy was also ignored in most models of the evolution of resistance to insecticidal proteins. Con-versely, Rotation was frequently taken into account in models dealing with resistance to fungicides (60% of the articles dealing with fungicide treatments). Finally, more than half of the articles modelling the evolution of her-bicide resistance considered strategies based on Alterna-tive methods, such as crop rotation or the mechanical control of weeds.
Finally, five of the eight parameters related to the out-put of the models were significantly influenced by at least one of the four explanatory factors according to both Fisher’s exact tests and AIC. The Resource and Frequency of resistance parameters were best accounted for by the MT factor (37% and 11% of the total deviance respec-tively). The proportion of articles including a Frequency of resistance parameter was slightly higher for population genetics (90%) than for epidemiological (72%) models. The Frequency threshold and Finite time parameters were best accounted for by the Pesticides or drug used (16% and 10% of the total deviance respectively). None of the articles used these two output criteria simultaneously to
evaluate the evolution of resistance. More than 50% of the articles dealing with insecticide resistance (sensu lato) used the Frequency threshold criterion, while articles dealing with resistance to fungicides and herbicides were more likely to use the Finite time to reach a threshold criterion. Most articles modelling the evolution of drug resistance considered none of these criteria, focusing instead on the Equilibrium output criterion. This model
parameter was best accounted for by the CG factor (9% of the total deviance).
Factors best accounting for the combination of model parameters
Finally, our analyses reveal that all 187 articles used different combinations of model parameters. Globally, the
Table 3. Effect of the four explanatory factors on the variation in the use of the 31 model parameters.
Model parameters Citation group
Explanatory factors
Year of
publication Largest DAIC Pesticide
or drug
Mathematical approach Biological
Diploidy 0.00* (0.41) 0.00* (0.65) 0.00* (0.53) 0.01 (0.03) Pesticide or drug Mutation rate 0.01* (0.05) 0.00* (0.10) 0.08 (0.02) 0.43 (0.00) Mathematical approach Distance of migration 0.03 (0.09) 0.00* (0.23) 0.00* (0.18) 0.44 (0.00) Mathematical approach Resistance cost 0.07 (0.02) 0.36 (0.03) 0.24 (0.01) 0.04 (0.00) Citation group Resistance dominance 0.00* (0.30) 0.00* (0.58) 0.00* (0.51) 0.00 (0.03) Pesticide or drug Initial resistance 0.00* (0.10) 0.00* (0.18) 0.00* (0.09) 0.18 (0.04) Pesticide or drug Migration 0.00* (0.06) 0.00* (0.12) 0.00* (0.19) 0.01 (0.02) Mathematical approach Cross-resistance 0.37 (0.03) 0.08 (0.16) 0.60 (0.02) 0.42 (0.00) Pesticide or drug Recombination 0.29 (0.02) 0.05 (0.12) 0.94 (0.00) 0.29 (0.01) Pesticide or drug Quantitative resistance 0.25 (0.04) 0.07 (0.13) 0.03 (0.06) 0.44 (0.01) Mathematical approach Modelling
Model specificity 0.30 (0.01) 0.00* (0.18) 0.01* (0.03) 0.29 (0.01) Pesticide or drug Population dynamics 0.02* (0.03) 0.30 (0.05) 0.14 (0.02) 0.92 (0.00) Mathematical approach Resource dynamics 0.00* (0.06) 0.00* (0.09) 0.00* (0.13) 0.01 (0.06) Mathematical approach Discrete time 0.00* (0.10) 0.00* (0.31) 0.00* (0.27) 0.46 (0.01) Pesticide or drug Stochasticity 0.38 (0.02) 0.46 (0.03) 0.76 (0.00) 0.23 (0.03) Year
Simulation 0.85 (0.01) 0.01* (0.14) 0.01* (0.06) 0.23 (0.03) Year Strategies
No. of molecules 0.82 (0.00) 0.09 (0.05) 0.21 (0.01) 0.29 (0.00) Year
Refuge 0.00* (0.04) 0.00* (0.29) 0.00* (0.09) 0.56 (0.00) Pesticide or drug Temporal distribution 1.00 (0.00) 0.30 (0.04) 0.25 (0.01) 0.36 (0.01) Mathematical approach Mixture 0.11 (0.03) 0.00* (0.10) 0.21 (0.02) 0.11 (0.02) Citation group Rotation 0.21 (0.02) 0.00* (0.11) 0.08 (0.02) 0.11 (0.01) Pesticide or drug Mosaic 0.52 (0.01) 0.44 (0.10) 0.19 (0.06) 0.76 (0.00) Mathematical approach Alternative methods 0.04 (0.04) 0.00* (0.10) 0.63 (0.01) 0.47 (0.00) Pesticide or drug Output
No. of pests 0.23 (0.02) 0.43 (0.03) 0.90 (0.00) 0.97 (0.00) Citation group Resource 0.00* (0.14) 0.00* (0.22) 0.00* (0.37) 0.47 (0.00) Mathematical approach Frequency of resistance 0.74 (0.00) 0.01* (0.11) 0.00* (0.11) 0.41 (0.00) Mathematical approach Economics 0.10 (0.09) 0.06 (0.16) 0.10 (0.05) 0.03 (0.02) Mathematical approach Graph 0.12 (0.02) 0.28 (0.03) 0.04 (0.03) 0.83 (0.00) Mathematical approach Finite time 0.15 (0.02) 0.00* (0.10) 0.53 (0.01) 0.44 (0.00) Pesticide or drug Frequency threshold 0.00* (0.08) 0.00* (0.16) 0.00* (0.06) 0.84 (0.00) Pesticide or drug Equilibrium 0.00* (0.09) 0.00* (0.09) 0.00* (0.05) 0.15 (0.01) Citation group
No. of max. dev. 0 28 3 0
No. of best DAIC 4 12 12 3
No. of significant tests 12 19 14 0
P-values for Fisher’s exact tests of the effect of the four explanatory factors on the variation in the use of the 31 model parameters, deviance (%) accounted for by the factor (in brackets), and factor best accounting for article classification according to the Akaike Information Criterion (AIC). The asterisks indicate significant Fisher’s exact tests on contingency tables after false discovery rate correction (calculated on the basis of 31 tests and at the 5% level). Characters in bold typeface indicate that the best explanatory factor according to the AIC was significant in Fisher’s exact test.
Model specificity (17.7%) 0 20 40 60 80 100 Refuge (28.6%) 0 20 40 60 80 100 Resource dynamics (13.0%) 0 20 40 60 80 100 Diploidy (65.5%) 0 20 40 60 80 100 Rotation (10.9%) 0 20 40 60 80 100 Distance of migration (18.4%) 0 20 40 60 80 100 Discrete time (30.6%) 0 20 40 60 80 100 Alternative methods (10.3%) 0 20 40 60 80 100 Migration (18.5%) 0 20 40 60 80 100 Initial resistance (17.0%) 0 20 40 60 80 100 Finite time (10.3%) 0 20 40 60 80 100 Resource (36.6%) 0 20 40 60 80 100 0 20 40 60 80 100 s ( n = 14) g ur d l ar i vi t n A c ( n = 29) it oi bi t n A e ( n = 15) di ci g n u F e ( n = 18) di ci br e H n ( n = 39) i et or p l a di ci t c e s nI e ( n = 30) di ci t c e s nI e ( n = 17) di ci t s e p d ei fi c e p s n U s ( n = 25) r e ht O 0 20 40 60 80 100 s (n = 14) g ur d l ar i vi t n A c (n = 29) it oi bi t n A e (n = 15) di ci g n u F e (n = 18) di ci br e H n (n = 39) i et or p l a di ci t c e s nI e (n = 30) di ci t c e s nI e (n = 17) di ci t s e p d ei fi c e p s n U s (n = 25) r e ht O 0 20 40 60 80 100 y g ol oi m e di p E (n = 41) s ci t e n e g n oi t al u p o P (n = 110) Other ( n = 36) Equilibrium (8.7%) st si t n ei c s l a ci d e M (n = 138) d n a st si g ol o c E (n = 44) st si m o n or g a Isolated ( n = 5) Frequency of resistance (10.8%) Frequency threshold (15.7%) Resistance dominance (57.6%)
Figure 2 Frequencies of articles considered positive for the various model parameters. Data are presented as a function of the explanatory factor giving the best D Akaike Information Criterion (light grey: Pesticide and drug; medium grey: Mathematical approach; dark grey: Citation group). Details of the model parameters are presented in Table 1 and the per cent in brackets are the proportion of the deviance accounted for by the most explanatory factor (Table 3).
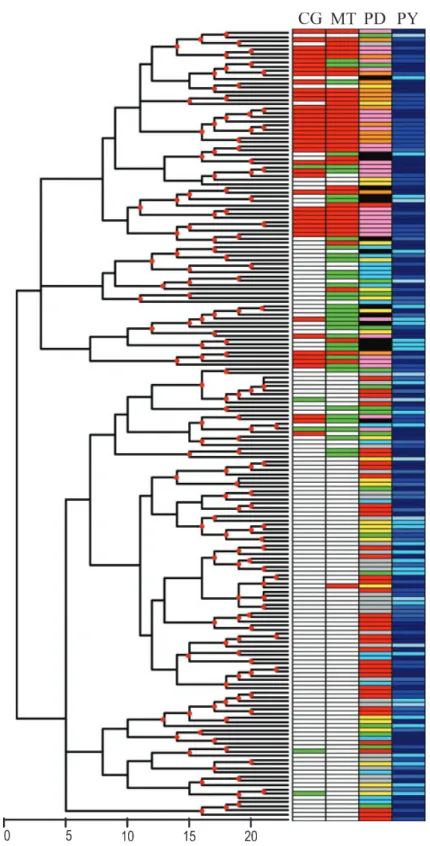
hierarchical clustering tree did not reveal any clear struc-turing of the articles based on the combinations of model parameters they used (Fig. 3). The deep nodes of the tree were supported by very low bootstrap values, suggesting that the information supplied by the 31 model parameters was highly heterogeneous. However, many intermediate and superficial nodes were supported by bootstrap values above 50%. The correspondence of this clustering as a function of the four explanatory factors was also assessed. Our findings suggest that the factors CG, MT and PD were not randomly distributed among the leaves of the tree, indicating that these factors account for the clustering. Discussion
In this study, we describe the state-of-the-art for model-ling of the evolution of resistance to pesticides and drugs, based on a bibliographical analysis of 187 models. In this discussion, we will begin with identifying and discussing the model parameters which were either rarely or fre-quently taken into account in the 187 models considered. We will then present and discuss the parameters for which none of the four factors potentially accounting for variability in the features of the models (scientific com-munity structure, class of PD, MT and year of publica-tion) actually accounted for the observed heterogeneity. Finally, we will discuss the extent to which each factor accounted for the use of the remaining model parameters. Based on our results, we propose in conclusion guidelines for the future development of theoretical models of the evolution of pesticide resistance.
Poorly investigated model parameters
A small number of models simulated quantitative resis-tance, recombination and cross-resistance between mole-cules. When more than one molecule was considered (35% of the models), the resistance mechanisms considered tended to be monogenic, independent and nonepistatic. This may be a reasonable assumption, because there is considerable evidence to suggest that resistance to pesticides and drugs mostly evolves through the selection of alleles with a major effect, and this view is supported by theoretical models (Roush and McKenzie 1987; Neve 2007). However, in some cases, resistance is clearly because of genes located on several chromosomes (Denholm and Rowland 1992) or has emerged from the addition of several mechanisms of small effect such as limited detoxifi-cation, sequestration and/or translocation (Park and Brown 2002), thus evolving as a quantitative genetic trait. The assumption that resistance is monogenic may thus
reflect a reluctance to increase model complexity.
Whatever the reason, quantitative multiple gene resistance
has not been the subject of any modelling approach by the 187 articles selected. Furthermore, although multi-drug resistance is frequent and despite the fact that many pesticide programs use a combination of nonindependent chemicals, cross-resistance is seldom considered into the models.
The distance of migration has also been largely ignored in models. In epidemiological models, microbes or viruses are considered to be transmitted from host to host. In these models, the distance over which the microbes are able to disperse depends on the hosts’ movements and is therefore not a relevant parameter. The very small num-ber of spatially explicit models is more surprising for population genetics models. Indeed, the distance of migration of pests is a key parameter determining the speed with which resistance spreads. It is a key factor in the management of Bt crops as part of an High-Dose-Refuge strategy (Peck et al. 1999; Caprio 2001; Ives and Andow 2002; Vacher et al. 2003; Cerda and Wright 2004; Sisterson et al. 2005; Tyutyunov et al. 2008).
The least studied of the basic strategies commonly used to delay the evolution of resistance was the mosaic strat-egy. Conversely, rotation was considered in about 25% of the models. Thus, when two molecules were considered, their distribution was more often considered over time,
with nonoverlapping treatments, than over space,
although these two dimensions could be symmetrically and even simultaneously explored. One reason for this lack of consideration of the mosaic strategy may be the greater complexity the introduction of this parameter would induce as such models are spatially explicit. More-over, the mosaic strategy does not necessarily reflect cur-rent practices in agronomy or human health. Indeed, this strategy requires spatial management extending beyond the level of a single producer or a single hospital. Further-more, as molecules often differ in efficacy, it is ethically unthinkable to adopt a strategy in which a proportion of human patients are not given the most effective cure. However, it would be possible and pertinent to evaluate the effect or consequences that an unequal access to medical care has on the evolution of resistance in human parasite.
The last model parameter poorly considered to date is the economic criterion for the comparison of efficiency between strategies. This absence is puzzling, because eco-nomics is one of the most important criteria, particularly in agronomy. One potential explanation for this is the selection of articles from life sciences databases, without considering articles referenced only in social sciences data-bases. It is also difficult to estimate both yield losses from pest densities (but see Ojiambo et al. 2002) and indirect economic costs, such as medical care, and their variability over a long-time period (Fleßa and Marschall 2009).
Figure 3 Tree of the 187 articles, showing their similarities based on the grid parameter values and their classification according to the four fac-tors used for article classification. ‘CG’ is the citation group (the ‘ecologists and agronomists’ group in white, the ‘medical scientists’ group in red, and ‘isolated’ in green), ‘MT’ is the mathematical approach (population genetics in white, epidemiology in red and other in green), ‘PD’ is pesti-cide or drug (antiviral drugs in orange, antibiotics in pink, unspecified pestipesti-cides or drugs in green, fungipesti-cides in black, insectipesti-cides in grey, Bt toxin in red, herbicides in blue, others in yellow) and ‘PY’ is the publication year class (from light to dark blue, before 1986, 1986–1990, 1991–1995, 1995–2000 and 2001–2006). Red dots on the nodes indicate bootstrap values above 50%.
The use of an economic criterion for the management of drug resistance is also clearly limited by ethical consider-ations. Conversely, the introduction of economic criteria into models focusing on the development of pesticide resis-tance would favour the emergence of more sophisticated strategies. For example, the definition of an economic threshold below which the cost of treatment exceeds direct yield losses and other indirect side effects could prohibit treatment. The use of conditional treatments based on economic criteria each year could affect the dynamics of resistance evolution and might lead to the selection of different best strategies. Finally, we believe that the lack of reference to economic criteria highlights the contradiction between short-term return and long-term benefit. Calcula-tions of the economic loss associated with the evolution of resistance would provide a clearer long-term view.
Frequently considered model parameters
Almost all the models used simulations. We expected the proportion of simulations to increase over time with increases in both the complexity of the models and the power of computers. However, the number of biological parameters included in models did not increase over time. Instead, the proportion of specific models – models using a large number of parameters to fit an existing situ-ation – remained constant at about 50%.
The models clearly identified selection as the most important of the four key processes involved in the build up of resistance as an adaptive trait. This would appear to be logical, as pesticides exert a very strong selection pressure, decreasing the impact of migration, mutations and genetic drift on the evolution of resistance. Moreover, the poor accounting for genetic drift (and more generally stochasticity) had at least one consequence: the models did not consider situations in which elimination of the pest was a potential strategy for pest populations of lim-ited size or in restricted areas (but see Boni et al. 2008a,b). Furthermore, the genetic drift may have impor-tant impact on the evolution of resisimpor-tant phenotypes in the absence of drug selection (Levin et al. 2000).
Most models considered resistance alleles to segregate in populations before the introduction of selection pres-sure. This assumption may be correct (Ge´nissel et al. 2003; Wenes et al. 2006), but probably not in all cases. For instance, the absence of glyphosate resistance in weed populations treated over a period of 25 years suggests a lack of pre-existing resistance alleles for this molecule in these populations (Dyer 1994; Bradshaw et al. 1997). Most models defined not only an initial frequency of the resistance allele but also set this frequency to a value sev-eral orders of magnitude above the frequency predicted under the hypothesis of mutation–selection balance.
Initial frequency of resistance alleles is generally not mea-sured in natura. Moreover, the paucity of the measure-ment of their cost in the literature may prevent the computation of this frequency at mutation–selection bal-ance. Therefore, this approach may be seen as conserva-tive, as resistance is predicted to appear more rapidly than it would in natural situations, but it may also pre-clude the exploration of strategies in which resistance alleles may be lost by genetic drift.
Almost all models calculated changes in the frequency of the resistance allele over time. However, 10% of the models surprisingly ignored this output parameter. In 40% of the articles, the frequency of resistance was the only criterion used to compare strategies in terms of effi-cacy. As highlighted above, demography, yield loss or patient recovery and economic criteria are equally impor-tant alternative outputs for facilitating stakeholders to choose the best strategies for efficient chemical control. Model parameters independent of the explanatory factors Although taken into account heterogeneously in the mod-els considered, several model parameters were found to be independent of the four explanatory factors. For instance, the cost of resistance was included in most models, regardless of the year of publication, scientific community, MT or class of PD. This finding is consistent with the early identification of the fitness cost of resis-tance being a key feature in the evolution of resisresis-tance to many pesticides and drugs. Fitness cost is not only the most directly obvious selective force counteracting the selection pressure exerted by pesticide treatments, but also underlies some of the possible control strategies, such as the stable zone strategy (Lenormand et al. 1998).
Similarly, it is fairly obvious why the maximal number of active molecules and the temporal distribution of these molecules were not linked to any of the four explanatory factors. For all the classes of PD, different molecules can be combined. Conversely, there is no obvious reason why the inclusion of strategies should differ as a function of the type of modelling or for different scientific communi-ties investigating these opportunicommuni-ties in very different manners.
Effect of explanatory factors on model parameters Year of publication had no impact on the use of each of the 31 model parameters. This suggests that new models were rarely developed through more detailed analysis of previous models and that most of the param-eters, including those referring to space processes, had been considered from the earliest efforts to develop such models.
We expected scientific community to be a key factor accounting for variability between models. We had previ-ously shown that the two major modelling communities (‘ecologists and agronomists’ and ‘medical scientists’) were isolated from one another (REX Consortium, 2007). This lack of exchange between groups could result in strong differences in the model parameters considered by each community. Twelve parameters were indeed consid-ered differently by the two modelling communities, including, in particular, the ploidy of the target organisms and the dominance of the resistance alleles. This is consis-tent with the notion that the first community includes ecologists or agronomists preferentially working on dip-loid pests, whereas the second includes medical scientists focusing mostly on haploid microorganisms (bacteria and viruses). The difference in the modelling approaches developed by the modelling communities is therefore more likely to reflect differences between the organisms studied rather than differences in school of thought.
Population genetics and epidemiological models
differed greatly in the ways in which they considered host ‘quality’. Physicians and veterinary surgeons readily dis-tinguish three classes of patients: healthy, infected and immune. Conversely, the quality of the resources in pop-ulation genetics models (essentially the host plant for insects and fungi) is considered to be constant over time. This assumption is not always true. The physiological defences of attacked plants have both direct and indirect effects on pest dynamics, because of secondary secretions that are either directly toxic, limiting further attacks, or attract natural enemies of the pests, increasing the rates of parasitism and predation of the phytophagous pests (Despres et al. 2007). Similarly, large-scale germination of an uncontrolled weed may reduce or delay the develop-ment of new cohorts (Marushia and Holt 2008). Finally, pest damage may also promote the arrival of other pests (Landolt et al. 2000). A rapid review of papers published after the building of our database shows that alternative MT for modelling the evolution of resistance can now alleviate some of the limits described in this paper (Boni et al. 2006, 2008a,b; Day and Gandon 2007; Debarre et al. 2009). For instance, Boni et al. (2008b) presented a SIR (for susceptible, infectious, and recovered compartments) model of malaria drug resistance taking into account all the parameters classically used in population genetics models (mutation, fitness and allele frequencies). Simi-larly, a recent study by Debarre et al. (2009) not only mixes epidemiology and population genetic concepts but also incorporates distance of migration in their model.
Furthermore, the output of the models mirrored the differences between MT. Epidemiological models tended to focus strongly on the quantity and quality of healthy resources, whereas population genetics models often
focused exclusively on changes in resistance allele fre-quencies. Indeed, population genetics models generally ignored the impact of pesticide treatments on pests and yields. At best, they modelled the population dynamics of the target pests while ignoring its effect on the resource on which the pests were living. This is clearly a pitfall, because the link between population density and damage is often not linear (Mitchell et al. 2004). We also know that pests not only reduce yields, but may also reduce the yield quality. For instance, maize may be contaminated by mycotoxins from fungi, the development of which is favoured by the damage caused by European corn borer larvae (Papst et al. 2005). Thus, population geneticists rarely include in their models the possible avoidance of treatment as a reasonable strategy.
Class of pesticide or drug as the best explanatory factor Model classification on the basis of clustering analysis (based on the 31 questions of the grid) was clearly linked to factors such as the MT used and the scientific commu-nity. However, the PD factor was found to account for the largest proportion of the deviance explained, and was also considered the most explanatory on the basis of AIC and the number of significant Fisher’s tests for the 31 model parameters considered.
Fungicides and antibiotics were the two classes of PD most frequently included in general models, for which the problem of resistance management is considered before specific cases arise. By contrast, drug resistances in popu-lations of viruses, such as human immunodeficiency virus, were mostly explored on a case-by-case basis.
The models developed for herbicides, antibiotics and antiviral drugs frequently included mutation rate, whereas models developed for fungicides, insecticidal proteins and insecticides seldom introduced this parameter. The under-lying rationale is probably that short-lived organisms have large effective population sizes and experience several gen-erations under selection pressure, so mutations can indeed appear during the selection process.
The use of refuges – areas free of treatment – was con-sidered in 94% and about 50% of the models developed for Bt resistance and insecticide resistance, respectively, but only in about 20% of the models of resistance to fungicides and antibiotics. As pointed out above, ethical reasons may preclude some strategies. The absence of ref-uges in models exploring antibiotic resistance illustrates this point: one can hardly imagine risking the patient’s life by establishing ‘untreated refuges’ to delay the evolu-tion of resistance. However, it should be stressed that the use of models can overcome this problem, making it possible to analyse potential scenarios without conse-quences. We must also keep in mind that untreated
populations – e.g. populations that are excluded, notably for economical reasons, from medical cares – actually constitutes involuntary refuges for bacteria and viruses. Hopefully, the increase of medical care would decrease the number of untreated people. This would in turn decrease the per cent of refuges for susceptible bacterial strains and therefore reinforce the selection for resistance.
The rotation strategy was completely ignored in models investigating resistance to antiviral drugs. This is probably because viruses reproduce rapidly, over time scales much shorter than the duration of treatment. Rotation would therefore mimic a mixture strategy in practice. Rotation of molecules was also poorly investigated in models of the evolution of Bt resistance. This is unfortunate, because several Bt toxins with different target sites are often active against the targeted pests. This lack of consideration of this strategy may be related to practical problems. For Bt
crops, rotation would require a general agreement at regional scale, potentially requiring federal legislation (Bourguet et al. 2005; Vacher et al. 2006). The addition of rules on the types of Bt crops farmers must grow, in addi-tion to mandatory refuges, would be a challenging politi-cal issue. Finally, the high level of consideration of rotation in models of the evolution of fungicide resistance (60%) may be accounted for by the number of treatments per year. Indeed, the need for successive treatments during the season makes it possible for the owner of the field to adopt a rotation strategy unilaterally, without the need for concerted deployment at the regional scale. This under-lines that the rotation strategy can finally correspond in practice to rotation of the mosaic strategy. Increasing the heterogeneity of the selection using several molecules independently can also be an effective strategy delaying the emergence of resistances (e.g. Boni et al. 2008a,b).
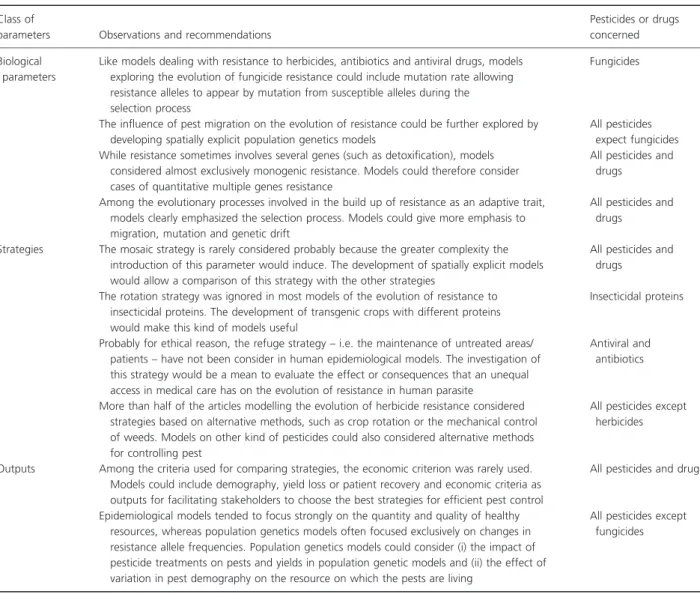
Table 4. Guidelines for further modelling the evolution of resistance. Class of
parameters Observations and recommendations
Pesticides or drugs concerned Biological
parameters
Like models dealing with resistance to herbicides, antibiotics and antiviral drugs, models exploring the evolution of fungicide resistance could include mutation rate allowing resistance alleles to appear by mutation from susceptible alleles during the selection process
Fungicides
The influence of pest migration on the evolution of resistance could be further explored by developing spatially explicit population genetics models
All pesticides expect fungicides While resistance sometimes involves several genes (such as detoxification), models
considered almost exclusively monogenic resistance. Models could therefore consider cases of quantitative multiple genes resistance
All pesticides and drugs
Among the evolutionary processes involved in the build up of resistance as an adaptive trait, models clearly emphasized the selection process. Models could give more emphasis to migration, mutation and genetic drift
All pesticides and drugs
Strategies The mosaic strategy is rarely considered probably because the greater complexity the introduction of this parameter would induce. The development of spatially explicit models would allow a comparison of this strategy with the other strategies
All pesticides and drugs
The rotation strategy was ignored in most models of the evolution of resistance to insecticidal proteins. The development of transgenic crops with different proteins would make this kind of models useful
Insecticidal proteins
Probably for ethical reason, the refuge strategy – i.e. the maintenance of untreated areas/ patients – have not been consider in human epidemiological models. The investigation of this strategy would be a mean to evaluate the effect or consequences that an unequal access in medical care has on the evolution of resistance in human parasite
Antiviral and antibiotics
More than half of the articles modelling the evolution of herbicide resistance considered strategies based on alternative methods, such as crop rotation or the mechanical control of weeds. Models on other kind of pesticides could also considered alternative methods for controlling pest
All pesticides except herbicides
Outputs Among the criteria used for comparing strategies, the economic criterion was rarely used. Models could include demography, yield loss or patient recovery and economic criteria as outputs for facilitating stakeholders to choose the best strategies for efficient pest control
All pesticides and drugs
Epidemiological models tended to focus strongly on the quantity and quality of healthy resources, whereas population genetics models often focused exclusively on changes in resistance allele frequencies. Population genetics models could consider (i) the impact of pesticide treatments on pests and yields in population genetic models and (ii) the effect of variation in pest demography on the resource on which the pests are living
All pesticides except fungicides
Conclusions and recommendations
Analysis of the possible causes of model diversity was highly informative. In a previous article analysing the sci-entific community of resistance evolution modellers
through its citation and co-citation networks, we
concluded that the scientific community was highly structured. We show here, that the main factor explaining the diversity of the models is the class of PD linked to the target organism, either than the structure of the scientific community.
Along the discussion, we have identified some lacks in biological parameters, strategies and outputs considered so far. They are summarized in Table 4. In this table, we provide guidelines for further modelling of resistance evo-lution.
Overall, we ended up with three main intermingle conclusions. First, among the four evolutionary pro-cesses involved in the build up of resistance as an adaptive trait, models clearly emphasized the selection process. Migration, mutation and drift are by far too rarely integrated in the models impeding the explora-tion of new strategies. For example, the fact that drift is not well accounted for has the consequence that models did not test the situation where a strategy would be pest or pathogen elimination at least over restricted area.
The second conclusion is that there is a clear asymme-try between space and time as sources of heterogeneity in the selection pressure. Much more emphasis has been made over time than over space processes. The increased capacity of computers to integrate complexity has not so far resulted in a better account of space in models. As a consequence, strategies like rotation, mosaic or refuges would remain clearly under-analysed. More generally, migration has been insufficiently considered in its double consequence of delaying the build up of resistance in a given space while transferring this resistance into new previously unscathed places.
Our last important conclusion is that many papers explored a situation of poor potential strategic interest. Most of the models analyse the performance of already used strategies in case of already present resistance rather than exploring new domains such as coupling rotation and mosaic in a more or less complex design. In parallel, models would also gain in extending the use of economic criteria or pest consequence that would allow test accep-tance or integrate treatment. The paucity of the consider-ation that models make of the consequence of the evolution of resistance on the quality of the resource and its economical viability would contribute to delay the transfer from simulations to their experimental validation and use.
Acknowledgements
The authors thank the De´partement Sante´ des Plantes et Environnement (SPE) of the Institut National de la Recherche Agronomique (INRA) for providing financial support to the REX consortium.
Consortium members and affiliations
The REX (Resistance to Xenobiotics) consortium is com-posed by Denis Bourguet (INRA, UMR Centre de Biolo-gie et de Gestion des Populations (CBGP), F-34988
Montferrier/Lez cedex, France), FranO´ ois Delmotte
(INRA, UMR Sante´ Ve´ge´tale, F-33140 Villenave d’Ornon, France), Pierre Franck (INRA, UR1115 Plantes et Sys-te´mes de Culture Horticoles, F-84000 Avignon, France), Thomas Guillemaud (INRA, UMR1112 ROSE, F-06903 Sophia Antipolis cedex, France), Xavier Reboud (INRA, UMR1210 Biologie & Gestion des Adventices, F-21065 Dijon, France), Corinne Vacher (INRA, UMR1202 Biodi-versite´ Ge´nes & Communaute´s (BioGeCo), F-33140 Ville-nave d’Ornon, France) and Anne-Sophie Walker (INRA, UMR1290 BIOGER-CPP, F-78026 Versailles, France). Literature cited
Anderson, R. M., and R. M. May. 1991. Infectious Diseases of Humans: Dynamics and Control. Oxford University Press, Oxford.
Andow, D. A., and D. N. Alstad. 1998. F2 screen for rare resistance alleles. Journal of Economical Entomology 91:572–578.
Benjamini, Y., and Y. Hochberg. 1995. Controlling the false discovery rate – a practical and powerful approach to multiple testing. Journal of the Royal Statistical Society Series B-Methodological 57:289–300.
Bergelson, J., and C. B. Purrington. 1996. Surveying patterns in the cost of resis-tance in plants. American Naturalist 148:536–558.
Boni, M. F., J. R. Gog, V. Andreasen, and M. W. Feldman. 2006. Epidemic dynamics and antigenic evolution in a single season of influenza A. Proceed-ings of the Royal Society
B-Biological Sciences 273:1307–1316.
Boni, M. F., C. O. Buckee, and N. J. White. 2008a. Mathematical models for a new era of malaria eradication. PLoS Medicine 5:1542–1543.
Boni, M. F., D. L. Smith, and R. Laxminarayan. 2008b. Benefits of using multiple first-line therapies against malaria. Proceedings of the National Academy of Sciences of the United States of America 105:14216–14227.
Bourguet, D., A. Ge´nissel, and M. Raymond. 2000. Insecticide resistance and dominance levels. Journal of Economical Entomology 93:1588–1595. Bourguet, D., J. Chaufaux, M. Se´guin, C. Buisson, J. L. Hinton, T. J. Stodola,
P. Porter et al. 2003. Frequency of alleles conferring resistance to Bt maize in French and US corn belt populations of the European corn borer, Ostrinia nubilalis. Theoritical and Applied Genetics 106:1225–1233.
Bourguet, D., M. Desquilbet, and S. Lemarie. 2005. Regulating insect resistance management: the case of non-Bt corn refuges in the US. Journal of Environ-mental Management 76:210–220.
Bradshaw, L. D., S. R. Padgette, S. L. Kimball, and B. H. Wells. 1997. Perspectives on glyphosate resistance. Weed Technology 11:189–198.
Caprio, M. A. 2001. Source-sink dynamics between transgenic and non-transgenic habitats and their role in the evolution of resistance. Journal of Economic Entomology 94:698–705.
Carrie`re, Y., C. Ellers-Kirk, A. L. Patin, A. S. Maria, S. Meyer, Y.-B. Liu, T. J. Dennehy et al. 2001. Overwintering cost associated with resistance to
transgenic cotton in the pink bollworm (Lepidoptera: Gelechiidae). Journal of Economical Entomology 94:935–941.
Cerda, H., and D. J. Wright. 2004. Modeling the spatial and temporal location of refugia to manage resistance in Bt transgenic crops. Agriculture Ecosystems & Environment 102:163–174.
Chen, W. J., F. Delmotte, S. Richard-Cervera, L. Douence, C. Greif, and M.-F. Corio-Costet. 2007. At least two origins of fungicide resistance in grapevine downy mildew populations. Applied and Environmental Microbiology 73:5162–5172.
Cohan, F. M., E. C. King, and P. Zawadzki. 1994. Amelioration of the deletrious pleiotropic effects of an adaptive mutation in Bacillus subtilis. Evolution 48:81–95.
Courcambeck, J., M. Bouzidi, R. Perbost, B. Jouirou, N. Amrani, P. Cacoub, G. Pepe et al. 2006. Resistance of hepatitis C virus to NS3-4A protease inhibitors: mechanisms of drug resistance induced by R155Q, A156T, D168A and D168V mutations. Antiviral Therapy 11:847–855.
D’Alessandro, U., and H. Buttiens. 2001. History and importance of antimalarial drug resistance. Tropical Medicine and International Health 6:845–848. Day, T., and S. Gandon. 2007. Applying population-genetic models in theoretical
evolutionary epidemiology. Ecology Letters 10:876–888.
Debarre, F., T. Lenormand, and S. Gandon. 2009. Evolutionary epidemiology of drug-resistance in space. PLoS Computational Biology 5:e1000337.
Denholm, I., and M. W. Rowland. 1992. Tactics for managing pesticide resistance in arthropods – theory and practice. Annual Review of Entomology 37:91– 112.
Despres, L., J. P. David, and C. Gallet. 2007. The evolutionary ecology of insect resistance to plant chemicals. Trends in Ecology & Evolution 22:298–307. Dyer, W. 1994. Resistance to glyphosate. In S. B. Powles, and J. A. M. Holtum,
eds. Herbicide Resistance in Plants: Biology and Biochemistry, pp. 353. Lewis Publishers Inc., Boca Raton, FL.
Edgar, R., and E. Bibi. 1997. MdfA, an Escherichia coli multidrug resistance pro-tein with an extraordinarily broad spectrum of drug recognition. Journal of Bacteriology 179:2274–2280.
Ferre´, J., and J. Van Rie. 2002. Biochemistry and genetics of insect resistance to Bacillus thuringiensis. Annual Review Entomology 47:501–533.
Fleßa, B., and P. Marschall. 2009. Socio-economic impact of antiviral interven-tion. In H.-G. Krau¨sslich, and R. Bartenschlager, eds. Handbook of Experi-mental Pharmacology: Antiviral Strategies, pp. 347–374. Springer, Berlin. Frost, S. D. W., M. Nijhuis, R. Schuurman, C. A. B. Boucher, and A. J. L. Brown.
2000. Evolution of lamivudine resistance in human immunodeficiency virus type 1-infected individuals: the relative roles of drift and selection. Journal of Virology 74:6262–6268.
Gagneux, S. 2009. Fitness cost of drug resistance in Mycobacterium tuberculosis. Clinical Microbiology and Infection 15:66–68.
Gahan, L. J., F. Gould, and D. G. Heckel. 2001. Identification of a gene associated with Bt resistance in Heliothis virescens. Science 293:857–860.
Ge´nissel, A., S. Augustin, C. Courtin, G. Pilate, P. Lorme, and D. Bourguet. 2003. Initial frequency of alleles conferring resistance to Bacillus thuringiensis poplar in field population of Chrysomela tremulae. Proceedings of the Royal Society of London. Series B 270:791–797.
Georghiou, G. P. 1986. The Magnitude of the Resistance Problem: Pesticide Resistance: Strategies and Tactics for Management. National Academic Press, Washington DC.
Gould, F., A. Anderson, A. Jones, D. Sumerford, D. G. Heckel, J. Lopez, S. Micinksy et al. 1997. Initial frequency of alleles for resistance to Bacillus thur-ingiensis toxins in field populations of Heliothis virescens. Proceedings of the National Academy of Sciences of the United States of America 94:3519–3523. Groeters, F. R., B. E. Tabashnik, N. Finson, and M. W. Johnson. 1993. Resistance to
Bacillus thuringiensis affects mating success of the diamondback moth (Lepidop-tera, Plutellidae). Journal of Economical Entomology 86:1035–1039. Guillemot, D. 1999. Antibiotic use in humans and bacterial resistance. Current
Opinion in Microbiolology 2:494–498.
Hakenbeck, R. 1999. Beta-lactam-resistant Streptococcus pneumoniae: epidemiology and evolutionary mechanism. Chemotherapy 45:83–94. Hastings, I. M. 2004. The origins of antimalarial drug resistance. Trends in
Parasitology 20:512–518.
Hsiou, Y., J. P. Ding, K. Das, A. D. Clark, P. L. Boyer, P. Lewi, P. A. J. Janssen et al. 2001. The Lys103Asn mutation of HIV-1 RT: a novel mechanism of drug resistance. Journal of Molecular Biology 309:437–445.
Ives, A. R., and D. A. Andow. 2002. Evolution of resistance to Bt crops: direc-tional selection in structured environments. Ecology Letters 5:792–801. Landolt, P. J., J. A. Brumley, C. L. Smithhisler, L. L. Biddick, and R. W.
Hofstetter. 2000. Apple fruit infested with codling moth are more attractive to neonate codling moth larvae and possess increased amounts of (E,E)-alpha-farnesene. Journal of Chemical Ecology 26:1685–1699.
Lenormand, T., T. Guillemaud, D. Bourguet, and M. Raymond. 1998. Evaluating gene flow using selected markers: a case study. Genetics 149:1383–1392. Levin, B. R. 2001. Minimizing potential resistance: a population dynamics view.
Clinical Infectious Diseases 33:S161–S169.
Levin, B. R. 2002. Models for the spread of resistant pathogens. Netherlands Jour-nal of Medicine 60:58–64.
Levin, B. R., V. Perrot, and N. Walker. 2000. Compensatory mutations, antibi-otic resistance and the population genetics of adaptive evolution in bacteria. Genetics 154:985–997.
Levy, S. B., and B. Marshall. 2004. Antibacterial resistance worldwide: causes, challenges and responses. Nature Medecine 10:S122–S129.
Marushia, R. G., and J. S. Holt. 2008. Reproductive strategy of an invasive thistle: effects of adults on seedling survival. Biological Invasions 10:913–924. McGowan, J. E., and F. C. Tenover. 1997. Control of antimicrobial resistance in
the health care system. Infectious Disease Clinics of North America 11:297–&. Mitchell, P. D., M. E. Gray, and K. L. Steffey. 2004. Composed-error model for
estimating pest-damage functions and the impact of the western corn root-worm soybean variant in Illinois. American Journal of Agricultural Economics 86:332–344.
Morin, S., R. B. Biggs, M. S. Sisterson, L. Shriver, C. Ellers-Kirk, D. Higginson, D. Holley et al. 2003. Three cadherin alleles associated with resistance to Bacillus thuringiensis in pink bollworm. Proceedings of the National Academy of Sciences United States of America 100:5004–5009.
Neve, P.. 2007. Challenges for herbicide resistance evolution and management: 50 years after Harper. Weed Research 47:365–369.
Ojiambo, P. S., H. Scherm, and P. M. Brannen. 2002. Septoria leaf spot intensity, defoliation, and yield loss relationships in southern blueberries. Phytopathol-ogy 92:S1025.
Oppert, B., R. Hammel, J. E. Throne, and K. J. Kramer. 2000. Fitness costs of resistance to Bacillus thuringiensis in the Indianmeal moth, Plodia interpunctel-la. Entomologia Experimentalis et Applicata 96:281–287.
Papst, C., H. F. Utz, A. E. Melchinger, J. Eder, T. Magg, D. Klein, and M. Bohn. 2005. Mycotoxins produced by Fusarium spp. in isogenic Bt vs. non-Bt maize hybrids under European corn borer pressure. Agronomy Journal 97:219–224. Park, S., and T. M. Brown. 2002. Rapid report – linkage of genes for sodium
channel and cytochrome P450 (CYP6B10) in Heliothis virescens. Pest Manage-ment Science 58:209–212.
Peck, S. L., F. Gould, and S. P. Ellner. 1999. Spread of resistance in spatially extended regions of transgenic cotton: implications for management of Helio-this virescens (Lepidoptera : Noctuidae). Journal of Economic Entomology 92: 1–16.
Powles, S. B., and J. A. M. Holtum. 1994. Herbicide Resistance in Plants: Biology and Biochemistry, 353 pp. Lewis Publishers Inc., Boca Raton, FL.
Purrington, C. B.. 2000. Costs of resistance. Current Opinion in Plant Biology 3:305.
R Development Core Team 2006. R: A Language and Environment for Statistical Computing. R Foundation for Statistical Computing, Vienna, Austria. Raymond, M., C. Chevillon, T. Guillemaud, T. Lenormand, and N. Pasteur. 1998.
An overview of the evolution of overproduced esterases in the mosquito Culex pipiens. Philosophical Transactions of the Royal Society of London 353:1707– 1711.
REX Consortium, I. F. 2007. Structure of the scientific community modelling the evolution of resistance. PLoS ONE 2:e1275.
Roush, R. T., and J. A. McKenzie. 1987. Ecological genetics of insecticide and acaricide resistance. Annual Review of Entomology 32:361–380.
Roux, F., J. Gasquez, and X. Reboud. 2004. The dominance of the herbicide resis-tance cost in several Arabidopsis thaliana mutant lines. Genetics 166:449–460.
Sisterson, M. S., Y. Carriere, T. J. Dennehy, and B. E. Tabashnik. 2005. Evolution of resistance to transgenic crops: interactions between insect movement and field distribution. Journal of Economic Entomology 98:1751– 1762.
Tabashnik, B. E. 1986. Computer simulations as a tool for pesticide resistance management. In Pesticide Resistance: Strategies and Tactics for Management. National Academy Press, Washington DC.
Tabashnik, B. E., Y.-B. Liu, N. Finson, L. Masson, and D. G. Heckel. 1997. One gene in diamondback moth confers resistance to four Bacillus thuringiensis toxins. Proceedings of the National Academy of Sciences of the United States of America 94:1640–1644.
Tabashnik, B. E., A. L. Patin, T. J. Dennehy, Y. B. Liu, Y. Carrie`re, M. A. Sims, and L. Antilla. 2000. Frequency of resistance to pink bollworm in field popula-tions of Bacillus thuringiensis. Proceedings of the National Academy of Sciences of the United States of America 97:12980–12984.
Tran, J. H., and G. A. Jacoby. 2002. Mechanism of plasmid-mediated quinolone resistance. Proceedings of the National Academy of Sciences of the United States of America 99:5638–5642.
Tyutyunov, Y., E. Zhadanovskaya, D. Bourguet, and R. Arditi. 2008. Landscape refuges delay resistance of the European corn borer to Bt-maize: a demo-genetic dynamic model. Theoretical Population Biology 74:138–146. Vacher, C., D. Bourguet, F. Rousset, C. Chevillon, and M. E. Hochberg. 2003.
Modelling the spatial configuration of refuges for a sustainable control of pests: a case study of Bt cotton. Journal of Evolutionary Biology 16:378–387. Vacher, C., D. Bourguet, M. Desquilbet, S. Lemarie, S. Ambec, and M. E.
Hochberg. 2006. Fees or refuges: which is better for the sustainable manage-ment of insect resistance to transgenic Bt corn? Biology Letters 2:198–202. Venables, W. N., and B. D. Ripley. 2002. Modern Applied Statistics with S.
Springer, Berlin.
Ward, H., G. G. Perron, and R. C. Maclean. 2009. The cost of multiple drug resistance in Pseudomonas aeruginosa. Journal of Evolutionary Biology 22:997– 1003.
Wenes, A. L., D. Bourguet, D. A. Andow, C. Courtin, G. Carre, P. Lorme, L. Sanchez et al. 2006. Frequency and fitness cost of resistance to Bacillus thuringiensis in Chrysomela tremulae (Coleoptera: Chrysomelidae). Heredity 97:127–134.