October 20, 2011
A multi-epoch
XMM-Newton
campaign on the core of the massive
Cyg OB2 association
?,??
G. Rauw
1,???Groupe d’Astrophysique des Hautes Energies, Institut d’Astrophysique et de G´eophysique, Universit´e de Li`ege, All´ee du 6 Aoˆut, Bˆat B5c, 4000 Li`ege, Belgium
Received date/ Accepted date
ABSTRACT
Context.Cyg OB2 is one of the most massive associations of O-type stars in our Galaxy. Despite the large interstellar reddening towards Cyg OB2, many studies, spanning a wide range of wavelengths, have been conducted to more clearly understand this as-sociation. X-ray observations provide a powerful tool to overcome the effect of interstellar absorption and study the most energetic processes associated with the stars in Cyg OB2.
Aims.We analyse XMM-Newton data to investigate the X-ray and UV properties of massive O-type stars as well as low-mass pre-main sequence stars in Cyg OB2.
Methods.We obtained six XMM-Newton observations of the core of Cyg OB2. In our analysis, we pay particular attention to the variability of the X-ray bright OB stars, especially the luminous blue variable candidate Cyg OB2 #12.
Results.We find that X-ray variability is quite common among the stars in Cyg OB2. Whilst short-term variations are restricted mostly to low-mass pre-main sequence stars, one third of the OB stars display long-term variations. The X-ray flux of Cyg OB2 #12 varies by 37%, over timescales from days to years, whilst its mean log LX
Lbol amounts to −6.10.
Conclusions.These properties suggest that Cyg OB2 #12 is either an interacting-wind system or displays a magnetically confined wind. Two other X-ray bright O-type stars (MT91 516 and CPR2002 A11) display variations that suggest they are interacting wind binary systems.
Key words.Open clusters and associations: individual: Cyg OB2 – Stars: early-type – stars: pre-main sequence – stars: individual: Cyg OB2 #12 – X-rays: stars
1. Introduction
The Cygnus OB2 association is one of the richest and most massive OB associations known in our Galaxy. These prop-erties make it an interesting target for observations over a broad range of wavelengths from the radio to the γ-ray do-main. Unfortunately, photometric and spectroscopic studies of Cyg OB2 in the UV (e.g. Herrero et al. 2001) and optical wave-band (e.g. Massey & Thompson 1991, Torres-Dodgen et al. 1991 and Hanson 2003) are seriously hampered by the heavy and patchy absorption by dense molecular clouds. Nevertheless, the interest in this association has been boosted over the past decade by near-infrared studies, which have obtained a far more complete census of its stellar population, and by the discovery of two γ-ray sources, a GeV and a TeV source, in this direc-tion. From 2MASS near-IR data, Kn¨odlseder (2000) concluded that Cyg OB2 probably harbours about 2600 ± 400 OB stars, among which 120 ± 20 are O-stars, within an angular radius of about one degree. Although more recent studies suggest a
Send offprint requests to: G. Rauw
? Based on observations collected with XMM-Newton, an ESA
Science Mission with instruments and contributions directly funded by ESA Member States and the USA (NASA).
??
Tables 2 and 4 are only available in electronic form at the CDS via anonymous ftp to cdsarc.u-strasbg.fr (130.79.128.5) or via http://cdsweb.u-strasbg.fr/cgi-bin/qcat?J/A+A/
??? Honorary Research Associate FRS-FNRS (Belgium)
Correspondence to: rauw@astro.ulg.ac.be
slightly lower number of 90 – 100 O-type stars (Com´eron et al. 2002), Cyg OB2 is certainly quite rich in massive stars and contains stars as early as O3 If∗ (Cyg OB2 #7). Accordingly, it has been suggested that the stellar winds of this concentration of massive stars in Cyg OB2 could be the origin of the slightly extended, unidentified TeV source TeV J2032+4130 (Aharonian et al. 2005, Albert et al. 2008), although alternative scenarios have also been proposed (see Butt et al. 2008 and references therein). In the GeV energy domain, the unidentified EGRET γ-ray source 3EG J2033+4118 had also been proposed to be as-sociated with interacting winds from massive stars in the core of the association (Romero et al. 1999, Rauw 2004), but recent Fermi-LAT data have identified this object as a young energetic pulsar (PSR J2032+4127, Abdo et al. 2010).
Four Cyg OB2 members have been extensively studied in the radio domain. Three of them are non-thermal radio emit-ters (Cyg OB2 #5, #8a, and #9, see e.g. De Becker 2007 and references therein) and are now known as binary or multiple systems hosting wind interaction regions (Kennedy et al. 2010, De Becker et al. 2004, Naz´e et al. 2008), whilst the fourth one (Cyg OB2 #12) is a luminous blue variable (LBV) candidate and could be one of the most luminous and optically brightest stars in our Galaxy (e.g. Massey & Thompson 1991).
X-ray emission from a handful of massive stars in Cyg OB2 was discovered serendipitously when the EINSTEIN observa-tory was pointed at Cyg X-3 (Harnden et al. 1979). All sub-sequent major X-ray satellites have observed this association. The first CCD X-ray spectra of the four brightest massive stars
(Cyg OB2 #5, 8a, 9, and 12) in the association were obtained with ASCA-SIS (Kitamoto & Mukai 1996). The Chandra ob-servatory has observed Cyg OB2 several times, both with the HETG, to gather high-resolution X-ray spectroscopy of the brightest sources (Waldron et al. 2004), and the ACIS-I instru-ment, to collect CCD images and spectra of the members of the association (Albacete-Colombo et al. 2007a, 2007b, Wright & Drake 2009, Wright et al. 2010)1. Thanks to the very narrow PSF and the low background, the 100 ksec ACIS-I exposure of the central region of Cyg OB2 (centered near Cyg OB2 #9) re-vealed about 1300 sources (Wright & Drake 2009). Most of these sources are very faint and are likely associated with pre-main sequence stars. This is unsurprising as IRAS and 12CO surveys revealed the Cyg OB2 region to be a highly active star-forming region (Odenwald & Schwartz 1993, Parthasarathy et al. 1992).
The distance to the Cyg OB2 association remains some-what controversial. Massey & Thompson (1991) derived a dis-tance modulus of 11.2 ± 0.1, in agreement with the more recent mean spectro-photometric distance obtained by Kiminki et al. (2007). Hanson (2003) used a cooler O-star temperature scale than Massey & Thompson (1991) and inferred a lower distance modulus of 10.4 mag (implying luminosities that are lower by a factor 2). An even lower distance modulus (9.8 mag) was ob-tained from the analysis of the light curve of the eclipsing bi-nary Cyg OB2 #5 (Linder et al. 2009), although this latter result might be biased by the presence of third light as Cyg OB2 #5 most likely hosts four stars (Kennedy et al. 2010). Throughout this paper, we adopt the 10.4 mag distance-modulus of Hanson (2003), corresponding to a distance of 1.2 kpc,2although we em-phasize that most of our conclusions are essentially independent of the distance.
We report the results of our analysis of six XMM-Newton observations of the core of Cyg OB2. The main purpose of this campaign was to study the X-ray properties and variability of the ray bright massive members of the association. Large X-ray luminosities, X-X-ray variability and/or spectral hardness are frequently considered as indicators of either interacting wind bi-naries or single stars with magnetic fields (see e.g. Gagn´e et al. 2011), although this is certainly not a one to one relationship and some O-star binaries actually display X-ray properties quite similar to those of normal single O-stars (e.g. Naz´e et al. 2011). When interpreting our data, we thus have to keep in mind the latest results of multiplicity studies in Cyg OB2 (Kiminki et al. 2009 and references therein).
This paper is outlined as follows. In Sect. 2, we present our data set and the data reduction. The general properties of the X-ray and UV sources in our field of view as well as their long and short term variability are discussed in Sect. 3. Section 4 presents a discussion of the X-ray emission of five relatively bright OB stars and Sect. 5 summarizes our conclusions.
2.
XMM-Newton
observations of Cyg OB2Six pointings centred on Cyg OB2 #8a were taken with the XMM-Newtonsatellite (Jansen et al. 2001). The first four obser-vations were obtained in October – November 2004 with roughly ten days between two consecutive pointings. Two follow-up
ob-1 Most recently Cyg OB2 has been the target of a Chandra legacy
survey (Drake 2011).
2 This value agrees with the distance estimate of 1.32+0.11
−0.09kpc
to-wards the W75N star forming region (Rygl et al. 2010), which is part of the Cygnus X giant molecular cloud, as is Cyg OB2.
servations were gathered in April – May 2007 (see Table 1). The EPIC cameras were used with the medium filter to reject optical light.
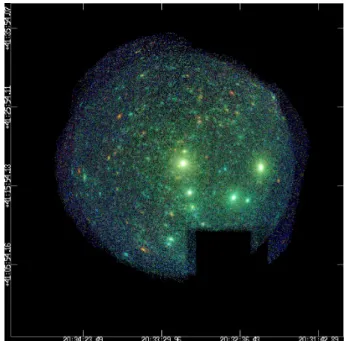
The raw data were processed with SAS software version 10.0. Several observations (especially the last two) were af-fected by high background events (so-called soft-proton flares). These episodes were rejected in our processing and the remain-ing total useful exposure times were 105 ksec for both EPIC-MOS (Turner et al. 2001) detectors and 74 ksec for the EPIC-pn (Str¨uder et al. 2001). Images were extracted for the soft (0.5 – 1.0 keV), medium (1.0 – 2.0 keV), and hard (2.0 – 8.0 keV) en-ergy bands. A few stray-light features, caused by singly reflected photons from Cyg X-3, affect a small region in the lower right corner of the images. These parts of the images were excluded from the subsequent analysis (see Fig. 1).
We note that the best-fit positions of TeV J2032+4130 are just outside our field of view (Aharonian et al. 2005, Albert et al. 2008). Apparently diffuse X-ray emission from this TeV source was discovered with another XMM-Newton observation (Horns et al. 2007).
Some preliminary results for the first four XMM-Newton pointings were discussed by Rauw et al. (2005), whilst full anal-yses of the data for Cyg OB2 #8a, Cyg OB2 #5, and Cyg OB2 #9 were presented by De Becker et al. (2006), Linder et al. (2009), Naz´e et al. (2010), and Blomme et al. (2010). These three objects are not discussed any further in this paper.
Fig. 1. Energy-coded three-colour image built from our six XMM-Newton observations of Cyg OB2. The red, green, and blue colours correspond to the soft, medium, and hard energy bands used throughout this paper (see text). The individual EPIC images were exposure corrected, the stray-light features from Cyg X-3 (lower right corner) were excluded, and the out-of-time events from the bright central source (Cyg OB2 #8a) were re-moved before the images were combined. A preliminary version of this figure was published by Rauw et al. (2008).
The Optical Monitor (OM, Mason et al. 2001) instrument onboard XMM-Newton observed Cyg OB2 through the UVW1 and UV M2 filters (see Fig. 2). The first four pointings were per-formed in ‘full frame low-resolution’ mode, whilst the last two
Table 1. Journal of the six XMM-Newton observations discussed in this paper.
Obs # Date Exposure time Clean time OM exposure time
JD-2450000 (ksec) (ksec) (ksec)
MOS pn MOS pn UVW1 UVM2
1 3308.579 19.7 18.0 19.1 15.4 3.2 8.0 2 3318.558 21.7 20.0 21.5 17.6 4.2 9.0 3 3328.543 23.7 22.0 23.0 19.3 5.0 10.0 4 3338.506 21.7 20.0 13.7 10.9 0.0 8.2 5 4220.355 30.5 28.9 11.8 3.6 10.3 12.3 6 4224.170 31.6 30.0 15.9 7.0 9.9 13.7
Notes. Columns 5 and 6 provide the useful exposure times after discarding time intervals of high background.
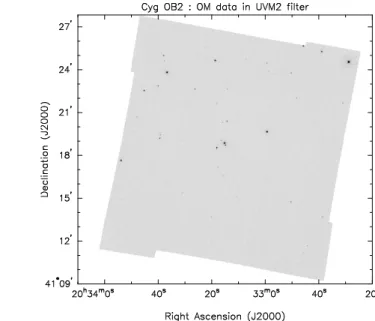
Fig. 2. Mosaic image of the core of Cyg OB2 as seen with the Optical Monitor through the UVW1 (left) and UV M2 (right) filters during observation 5. The impact of the interstellar reddening on the number of sources detected in the UV M2 band is clearly seen.
used the ‘imaging mode’ consisting of a mosaic of five expo-sures to cover the full 17 arcmin square field of view (FoV) of the instrument (Fig. 2). The data were processed with the relevant commands of the SAS software. The OM images display some artifacts such as smoke-ring ghosts caused by light reflected off a chamfer in the detector window and modulo-8 pattern around bright sources (see Mason et al. 2001). The OM detector has a read-out time of 11 ms. The brightest sources in our field of view therefore suffer from coincidence losses that amount typi-cally to 10% for sources with 10 counts s−1(Mason et al. 2001). These losses are partially recovered during the data process-ing to provide ‘corrected’ count rates, which are then converted into AB magnitudes (Oke 1974). In our cases, a count rate of 10 counts s−1corresponds to UVW1 and UV M2 AB-magnitudes of 16.066 and 14.912. The astrometry of a dozen O-type stars, spread all over the OM field of view, was compared to the coor-dinates taken from the catalogue of Massey & Thompson (1991, hereafter MT91). We found a small shift (around 1.3 arcsec in right ascension and 1.8 arcsec in declination) for each observa-tion. There was no obvious trend in this shift with position across the FoV, thus we applied a simple translation to the OM coordi-nates before performing cross-correlations with optical or X-ray catalogues. After this correction, the average distance between the OM sources and their counterpart in the MT91 catalogue amounts to 0.63 arcsec for 225 objects (see Sect. 3).
3. The X-ray sources: general properties
A three colour X-ray image derived from our combined data set is shown in Fig. 1. It can be seen that the faint X-ray sources are found all over the field of view, although some areas contain larger concentrations of sources. Bica et al. (2003) reported the discovery of two open clusters in the core of Cyg OB2 roughly centered on stars #8a and #22, respectively. Whilst we find a rel-atively large number of X-ray sources within the regions defind by Bica et al. (2003), we note that there are other places inside our field of view with similar concentrations of X-ray sources (such as around 20h32m47s+41◦24’45”).
3.1. The nature of the X-ray sources
The SAS routines detected a total of 206 sources in the combined EPIC images (outside the region affected by the straylight) with a significance threshold of 203and average count rates as low as 0.0004 and 0.0002 cts s−1for EPIC-pn and EPIC-MOS. From a histogram of the number of detections versus count rate, we con-clude that our detections are complete down to rates of 0.0022
3 This implies a probability of ≤ e−20that a random Poissonian
fluctu-ation could have caused the observed source counts inside the detection cell. Over the entire EPIC field of view, the expected number of spu-rious detections amounts to about 2% of the total number of detected sources.
and 0.0008 cts s−1for EPIC-pn and EPIC-MOS, respectively. All these sources were verified by eye and 199 of them were even-tually retained as real sources. There are a number of additional, fainter sources that were not selected by the detection algorithm, because they are located in crowded regions and their signifi-cance over the background therefore falls below our threshold. Finally, we stress that a few sources in our list could actually be blends of two fainter, spatially unresolved sources. Table 2 lists the coordinates of our sources, their X-ray properties, and the results of cross-correlation with various catalogues (see below). The full version of this table is available at the CDS.
We cross-correlated our final list of X-ray sources with the 2MASS point source catalogue (Cutri et al. 2003, Skrutskie et al. 2006). On the basis of the technique of Jeffries et al. (1997), the optimal cross-correlation radius, which offers the optimal compromise between obtaining the maximum number of true identifications and avoiding contamination by spurious coincidences, was established to be 4 arcsec. For this correla-tion radius, we expect to find fewer than 5% of false cross-identifications. We also correlated our list of sources with the U B V photometric catalogue of Massey & Thompson (1991) and the list of OB star candidates provided by Com´eron et al. (2002). Twenty-four positive matches were found with the MT91 catalogue, to which we can add Cyg OB2 #5, which is not included in the compilation of Massey & Thompson (1991). Three OB star candidates listed by Com´eron et al. (2002) fall within the field of view of our data. Two of them, CPR2002 A114 and A43 (= Cyg OB2 #16 = MT91 299), are likely counterparts to X-ray sources, whilst the third (CPR2002 A17) is not de-tected. Furthermore, among the four Brγ emitters (CPR2002 B5, B8, B11, B13, in addition to Cyg OB2 #9) in our field of view listed by Com´eron et al. (2002), only star B8 is detected, al-though at a rather large angular distance from the position of the X-ray source. We find that a total of 20 X-ray sources correspond to O-type stars, and 5 are associated with B-type stars, includ-ing the B supergiant and LBV candidate Cyg OB2 #12. In addi-tion to Cyg OB2 #5, #8a, and #9, there are 5 OB stars (Cyg OB2 #12, #7, #22, MT91 516, and CPR2002 A11) that are sufficiently bright and clearly separated from other bright sources for their spectra to be studied during the individual pointings. Table 3 summarizes the general properties of those X-ray sources that are associated with known OB stars.
Figure 3 displays the hardness ratios HR2= (H−M)/(H+M) versus HR1 = (M−S)/(M+S) for the OB-stars, where S, M, and H stand for the EPIC-pn count rates in the soft, medium, and hard energy bands, respectively. The solid lines yield the expected hardness ratios for single temperature plasma emis-sion at kT = 0.4, 0.6, and 0.85 keV for neutral hydrogen col-umn densities between 0.5 and 1.5 × 1022cm−2. The dashed line yields the average O-star X-ray spectrum as inferred by Naz´e (2009) and absorbed by column densities ranging between 0.5 and 2.0 × 1022cm−2. This latter model features two thermal plasma components with kT1and kT2equal to 0.24 and 2.3 keV, respectively, and the hotter component contributing 16% of the emission at 1 keV. As can be seen from this figure, with a few ex-ceptions, the hardness ratios of the majority of the O-type stars in Cyg OB2 can be understood in terms of typical O-star
emis-4 At this stage, we stress that the star MT91 267 listed by Massey &
Thompson (1991) and object CPR2002 A11 of Com´eron et al. (2002) refer apparently to the same star. Kiminki et al. (2007) classified MT91 267 as a G-type star, whilst Negueruela et al. (2008) quoted an O7.5 Ibf spectral type for A11. Re-examination of the Kiminki et al. (2007) Keck spectrum of MT91 267 by Kobulnicky (2011, private com-munication) confirmed that this star is indeed an O-type star.
known O+O binaries O+O binary candidates O stars
Cyg OB2 #12 B stars
Fig. 3. EPIC-pn hardness ratios of the OB stars in Cyg OB2. The solid lines yield the synthetic hardness ratios of absorbed single temperature thermal plasma models for temperatures of kT = 0.4, 0.6, and 0.85 keV (from bottom to top). The neutral column density increases along these lines from 0.5 to 1.5 × 1022cm−2 going from left to right. The dashed curve in turn indicates the hardness ratios of the ’typical’ O-star two-temperature X-ray spectral model determined by Naz´e (2009) with an absorption column-density increasing from 0.5 to 2.0 × 1022cm−2.
sion spectra affected by a large interstellar absorption. There is no evidence that the majority of the O-type stars have intrin-sically hard spectra. The hardest X-ray emission is observed for the B-type stars. However, it remains unclear whether these B-stars (except for Cyg OB2 #12) are intrinsic X-ray emitters. Their emission might also originate from hidden low-mass pre-main-sequence companions (e.g. Evans et al. 2011 and refer-ences therein), although we stress that in our dataset the B stars display little evidence of X-ray variability that would hint at the presence of a low-mass companion.
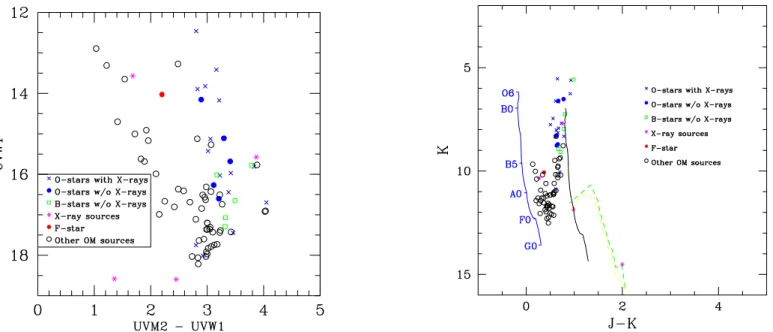
From the results of the cross-correlation with the 2MASS data, we compiled near-IR colour-magnitude and colour-colour diagrams. For this purpose, we used the colour transformations of Carpenter (2001, updated in 20035) to convert the 2MASS colours into the homogenized J H K photometric system of Bessell & Brett (1988). Figure 4 illustrates the results. The ma-jority of the massive stars that are X-ray sources (except for Cyg OB2 #12) have near-IR colours and magnitudes that are consistent with a reddening of AK ∼ 0.5 – 0.8 (see left panel of Fig. 4). The locus of the fainter counterparts in this diagram is considerably shifted to the red, which implies that these stars are on pmain-sequence (PMS) tracks. Bica et al. (2003) re-ported average values of E(H − Ks) = 0.31 and AKs = 0.78 for the two clusters they identified at the core of Cyg OB2. The majority of the near-IR counterparts of our X-ray sources are consistent with this value of reddening and suggest an age of 2 – 3 Myr when compared to the PMS isochrones of Siess et al. (2000). These results are in excellent agreement with the conclu-sions of Albacete-Colombo et al. (2007a) and Wright & Drake (2009), although Wright et al. (2010) inferred a slightly older
Table 2. Properties of the X-ray sources in Cyg OB2 detected with XMM-Newton. [1] [2] [3] [4] [5] [6] [7] [8] [9] [10] [11] [12] 6 20:32:22.3 +41:18:17.3 0.1584D+00 0.0162 6 0.6659D+00 0.0000 6 0.2717D+00 0.0000 6 13 20:32:31.4 +41:14:06.0 0.6859D−02 0.0193 6 0.5691D−01 0.0000 6 0.4197D−01 0.0000 6 16 20:32:36.5 +41:22:13.1 0.3771D−03 0.1853 4 0.2176D−02 0.0000 6 0.1183D−02 0.0000 5 22 20:32:40.8 +41:14:28.0 0.3500D−01 0.0000 6 0.4164D+00 0.0000 6 0.3087D+00 0.0000 6 27 20:32:44.2 +41:24:22.3 0.3257D−03 0.4902 4 0.1518D−02 0.0083 6 0.8545D−03 0.0017 5 34 20:32:46.6 +41:18:06.8 0.2761D−03 0.0000 3 0.8789D−03 0.0000 3 0.6308D−03 0.0000 4 74 20:33:08.6 +41:13:17.8 0.9955D−02 0.2646 5 0.5333D−01 0.0707 5 0.1364D−01 0.1639 5 80 20:33:10.6 +41:15:07.6 0.4022D−01 0.1605 6 0.2614D+00 0.0005 6 0.1775D+00 0.1212 6 92 20:33:13.9 +41:13:04.4 0.9154D−03 0.6731 6 0.4418D−02 0.0000 6 0.8938D−03 0.0000 6 95 20:33:13.9 +41:20:21.1 0.1232D−01 0.0157 6 0.4790D−01 0.0814 6 0.9910D−02 0.1750 6 96 20:33:14.9 +41:18:50.0 0.3530D+00 1.0000 6 0.1292D+01 0.0000 6 0.5778D+00 0.0000 6 122 20:33:23.5 +41:09:11.5 0.9762D−02 0.1457 6 0.7324D−01 0.0000 6 0.5054D−01 0.0457 6 134 20:33:26.6 +41:10:58.4 0.8776D−03 0.0082 5 0.5431D−02 0.0000 6 0.2440D−02 0.0000 6 [1] [13] [14] [15] [16] [17] [18] [19] [20] [21] [22] [23] [24] 6 0.4100D−01 0.0001 6 0.2546D+00 0.0000 6 0.1081D+00 0.0000 6 0.4230D−01 0.0020 6 13 0.1747D−02 0.2114 6 0.2484D−01 0.0000 6 0.1794D−01 0.0000 6 0.1948D−02 0.0024 6 16 0.1344D−03 0.6146 4 0.7055D−03 0.0000 6 0.6065D−03 0.0000 5 0.8757D−04 0.6374 3 22 0.8892D−02 0.0032 6 0.1429D+00 0.0000 6 0.1087D+00 0.0000 6 0.7893D−02 0.0000 6 27 0.1216D−03 0.4100 2 0.5925D−03 0.3433 4 0.4596D−03 0.9076 3 0.1947D−03 0.9668 4 34 0.1740D−03 0.3820 3 0.7237D−02 0.0000 2 0.3863D−03 0.0000 4 0.1304D−03 0.0282 2 74 0.1779D−02 0.0166 6 0.1772D−01 0.1740 6 0.5399D−02 0.0019 6 0.1847D−02 0.1020 6 80 0.9531D−02 0.0093 6 0.8768D−01 0.0370 6 0.6220D−01 0.0007 6 0.9659D−02 0.0000 6 92 0.2085D−03 0.6109 5 0.7190D−03 0.0879 6 0.4920D−03 0.0000 5 0.2043D−03 0.8327 5 95 0.2614D−02 0.0900 6 0.1552D−01 0.2145 6 0.3727D−02 0.7770 6 0.2804D−02 0.1776 6 96 0.8258D−01 1.0000 6 0.4440D+00 0.0000 6 0.2159D+00 0.0000 6 0.8393D−01 1.0000 6 122 0.2441D−02 0.2976 6 0.2709D−01 0.0004 6 0.1681D−01 0.0000 6 0.2605D−02 0.9902 6 134 0.2774D−03 0.4752 6 0.1713D−02 0.0034 6 0.6320D−03 0.0000 5 0.2919D−03 0.7785 4 [1] [25] [26] [27] [28] [29] [30] [31] [32] [33] [34] [35] [36] [37] 6 0.2758D+00 0.0000 6 0.1158D+00 0.0000 6 5.187 4.745 4.339 AEA 13 0.2564D−01 0.0000 6 0.1902D−01 0.0000 6 7.817 7.094 6.664 AAA 16 0.4226D−03 0.0000 6 0.6045D−03 0.0000 2 12.106 11.337 10.879 AAA 22 0.1431D+00 0.0000 6 0.1080D+00 0.0000 6 20.104 19 4.667 3.512 2.704 DDD 27 0.5709D−03 0.6657 5 0.1174D−02 0.0081 5 13.820 12.754 12.408 AAA 34 0.4953D−03 0.0000 4 0.4651D−03 0.0000 6 16.337 14.868 14.474 AAA 74 0.1710D−01 0.0000 6 0.5112D−02 0.0005 6 20.747 16.699 95 7.110 6.540 6.226 AAA 80 0.9184D−01 0.0000 6 0.6456D−01 0.0004 6 19.642 15.811 103 6.468 5.897 5.570 AAA 92 0.1364D−02 0.0001 6 0.1356D−02 0.0000 5 20.904 17.445 118 9.034 8.559 8.280 AAA 95 0.1608D−01 0.2545 6 0.3704D−02 0.5000 6 17.385 14.174 120 7.248 6.818 6.611 AAA 96 0.4518D+00 0.0000 6 0.2164D+00 0.0000 6 15.267 12.462 126 6.123 5.721 5.503 AAA 122 0.2510D−01 0.0965 6 0.1775D−01 0.3997 6 7.025 6.380 6.050 AAA 134 0.1488D−02 0.1372 6 0.9622D−03 0.0000 5 8.971 8.434 8.165 AAA [1] [38] [39] [40] [41] [42]
6 O6.5-7 I+ OB-Ofpe/WN9 Cyg OB2 #5
13 12.87 1.22 2.19 O7.5 Ibf CPR2002 A11
16 16.19 1.16 2.06 MT91 291
22 11.46 2.37 3.35 B5 Ie Cyg OB2 #12
27 34
74 11.55 0.74 2.04 O4 III(f) Cyg OB2 #22
80 10.96 0.69 1.81 O5 If+ O6-7 Cyg OB2 #9
92 12.92 0.54 1.81 O8 V MT91 455
95 10.55 0.19 1.45 O3 If Cyg OB2 #7
96 9.06 0.08 1.30 O5.5 I(f)+ O6 Cyg OB2 #8a
122 11.84 0.93 2.20 O5.5 V MT91 516
134 13.00 0.61 1.87 O8.5 V MT91 534
Notes. This table will be made available in its entirety at CDS. Some excerpts are shown here for guidance. The columns have the following meaning: [1]= source number; [2] and [3] = source coordinates (J2000.0); [4] – [6] = mean count rate in EPIC-pn soft band, probability that the source be constant and number of observations of this source in this band with EPIC-pn; [7] – [9]= same for the EPIC-pn medium band; [10] – [12]= same for the EPIC-pn hard band; [13] – [15] = same for the EPIC-MOS1 soft band; [16] – [18] = same for the EPIC-MOS1 medium band;
[19] – [21]= same for the EPIC-MOS1 hard band; [22] – [24] = same for the EPIC-MOS2 soft band; [25] – [27] = same for the EPIC-MOS2
medium band; [28] – [30]= same for the EPIC-MOS2 hard band; [31] and [32] = UVM2 and UVW1 magnitudes; [33] = ID number of OM
counterpart; [34] – [36]= J, H, Ksphotometry from 2MASS; [37]= 2MASS quality flag or ”ncp”, ”2cp” ”3cp” where 2cp (3cp) means there are
2 (resp. 3) 2MASS counterparts inside the 4 arcsec correlation radius whilst ncp means no 2MASS counterpart was found inside the correlation radius; [38] – [40]= V, U − B, B − V from Massey & Thompson (1991); [41] and [42] = spectral type and common identifier.
Table 3. General properties of the OB stars in the core of Cyg OB2 as seen with XMM-Newton.
Name Spectral type pn MOS1 MOS2 UV M2 UVW1
CR HR1 HR2 var CR var CR var
Objects studied in previous papers
Cyg OB2 #5 O6.5-7 I+ OB-Ofpe/WN9 1.096 0.62 −0.42 SMH 0.404 SMH 0.434 SMH
Cyg OB2 #8a O5.5 I(f)+ O6 2.223 0.57 −0.38 MH 0.742 MH 0.752 MH 15.27 12.46
Cyg OB2 #9 O5 If+ O6-7 0.479 0.73 −0.19 M 0.159 SMH 0.166 SMH 19.64 15.81
X-ray bright OB stars analysed in this paper
Cyg OB2 #7 O3 If 0.070 0.59 −0.66 S 0.022 0.023 17.39 14.17
Cyg OB2 #12 B5 Ie 0.760 0.84 −0.15 SMH 0.260 SMH 0.259 SMH 20.10
Cyg OB2 #22 O4 III(f) 0.077 0.69 −0.59 0.025 S H 0.024 MH 20.75 16.70
MT91 516 O5.5 V 0.133 0.76 −0.18 MH 0.046 MH 0.045
CPR2002 A11 O7.5 Ibf 0.106 0.78 −0.15 SMH 0.044 MH 0.047 SMH
X-ray fainter OB stars, not analysed in detail
Cyg OB2 #4 O7 IIIf 0.018 0.23 −0.25 0.011 H 0.010
Cyg OB2 #6 O8 V 0.009 0.04 −0.89 0.002 0.002 16.79 13.82
Cyg OB2 #8c O4.5 III(fc) 0.040 0.42 −0.78 S 0.014 0.014 16.58 13.41
Cyg OB2 #15 O8 V 0.009 0.01 −0.63 MH 0.003 S 0.003
Cyg OB2 #16 O7 V 0.009 0.28 −0.79 0.003 0.003 16.72 13.90
Cyg OB2 #17 O8 V 0.005 0.09 −0.57 0.002 0.002 18.18 15.13
Cyg OB2 #24 O7 V 0.009 0.41 −0.59 S 0.002 0.003 19.39 15.97
Cyg OB2 #27 O9.5 V 0.003 0.26 −0.47 H 0.001 0.001 19.82 16.45
MT91 311 B2 V 0.003 0.61 0.28 0.001 0.001 20.94 18.01 MT91 322 B2.5 V 0.002 0.48 −0.13 0.001 H 0.001 18.71 MT91 336 B3 III 0.004 0.73 −0.18 0.001 0.001 20.55 17.75 MT91 376 O8 V 0.005 0.12 −0.59 0.001 0.001 18.44 15.43 MT91 448 O6 V 0.004 0.55 −0.89 0.002 0.001 M 19.04 MT91 455 O8 V 0.006 0.66 −0.66 MH 0.001 H 0.003 MH 20.90 17.45 MT91 485 O8 V 0.007 0.43 −0.65 0.002 0.003 19.25 16.03 MT91 534 O8.5 V 0.009 0.72 −0.38 SMH 0.003 MH 0.003 H MT91 573 B3 I 0.002 0.51 −0.19 MH 0.001 18.12
Notes. Columns 3, 7, and 9 provide the average count rates (cts s−1) over the 0.5 – 8.0 keV energy band for the pn, MOS1, and MOS2 detectors,
respectively. Columns 6, 8, and 10 indicate the energy bands for which the null hypothesis of a constant count rate is rejected at the 5% level for the pn, MOS1, and MOS2 detectors. The hardness ratios (quoted in columns 4 and 5 for the pn instrument only) are defined as HR1= (M−S)/(M+S) and HR2= (H−M)/(H+M). The X-ray spectra of the first three objects were discussed in previous papers, those of the five following objects are discussed in detail in this paper and the remainder of the objects are too faint for spectral analysis.
Fig. 4. Left panel: (J − K, K) near-IR colour-magnitude diagram of the 2MASS counterparts of our X-ray sources. The main-sequence (from Kn¨odlseder 2000) is shown for a distance modulus of 10.4 and for two different values of the reddening (from left to right, AK = 0.0 and 0.78, Bica et al. 2003). The reddened pre-main sequence isochrones from Siess et al. (2000) are shown for ages of 2 and 3 Myrs (dashed lines). Right panel: (H − K, J − H) colour-colour diagram of the 2MASS counterparts. The solid lines yield the locus of the main-sequence according to Bessell & Brett (1988), while the dashed straight line indicates the locus of the unreddened classical T-Tauri stars following Meyer et al. (1997). The reddening vector is shown according to Bica et al. (2003).
Fig. 5. Left panel: colour-magnitude diagram compiled from the OM photometry of Cyg OB2. Right panel: (J − K, K) near-IR colour-magnitude diagram (as Fig. 4) of the 2MASS counterparts of the OM sources that are detected in both UV filters. The F-type star indicated in these figures is Cyg OB2 #72 (= MT91 664, Massey & Thompson 1991).
age of 3.5+0.75−1.00Myr. We draw attention to a group of sources that fall roughly along the main-sequence relation (shifted to the distance of Cyg OB2 and reddened according to the Bica et al. 2003 results), but below the main-sequence turn-on. One of these sources (number 86) displays a decaying flare during observa-tion 1. These objects are likely to be late-type active foreground stars unrelated to Cyg OB2. From the right panel of Fig. 4, we see that there is little evidence of large IR excesses as one would expect for classical T Tauri stars (see Meyer et al. 1997). This is in line with the conclusion of Albacete-Colombo et al. (2007a) and Wright et al. (2010), who found that only 4 – 8% of the near-IR counterparts of their X-ray sources display infrared excesses that could hint at the presence of an accretion disk.
Vink et al. (2008) performed a search for Hα emitters in Cyg OB2. Their field C overlaps to a large extent with our EPIC field of view. Four Hα emitters tabulated by Vink et al. (2008) lie inside the EPIC FoV. Only one of them is marginally consistent with a detection in our X-ray data (source C9)6, although we do not regard this correlation as a significant detection.
Using our OM data, we also performed a search for UV sources. After rejecting some spurious sources (mainly due to the artifacts mentioned in Sect. 2), we found a list of 254 objects that are detected at least in the UVW1 filter and at least during two different observations. Using a cross-correlation radius of 4 arcsec, we find that 32 X-ray sources have a counterpart in our list of OM sources. Out of these 32 objects, 19 are measured in both OM filters, whilst the others are too faint in the UV M2 filter to be detected. Among the X-ray sources detected in both UV fil-ters, 15 have an OB-type counterpart. Six X-ray flaring sources fall inside the OM FoV. Only one of them (the X-ray source 139) is detected with a magnitude of 18.8 in UVW1 (no detection in UV M2). From a cross-correlation with the catalogue of Massey & Thompson (1991), we find counterparts for 225 of our OM sources within a correlation radius of 2.0 arcsec. Adopting the same correlation radius, all but five OM sources are found to
6 We note here that the position of source C9 in Fig. 1 of Vink et al.
(2008) is inconsistent with the coordinates given in their Table 2. We used the latter in our cross-correlation.
have a 2MASS counterpart. The results of this correlation, along with the results of a χ2 variability test, are provided in Table 4 that is available at the CDS.
The UV M2 filter contains the broad interstellar absorption feature at 2200 Å and is thus quite sensitive to the interstellar col-umn density (Royer et al. 2000). Given the rather heavy redden-ing towards the Cyg OB2 association, objects that are detected in both filters correspond to either the brightest and hottest associ-ation members or foreground stars. In the UV colour-magnitude diagram (see Fig. 5), the O-type stars define a clear, almost ver-tical sequence around UV M2 − UVW1 ' 3. The latter value is consistent with the large reddening towards the Cyg OB2 asso-ciation (Royer et al. 2000).
For the O-type stars in our OM FoV, we inspected the inter-pointing light curves of these stars that were found to be vari-able using a χ2test whilst not exceeding the limiting brightness at which 10% coincidence losses occurr. Among the stars that did not display significant UV magnitude variations, the most remarkable cases are Cyg OB2 #7, 9, and 12. The O-type stars that were found to be variable in either of the UV M2 and UVW1 bands are, respectively, Cyg OB2 #8a, 8c, 16, 27 and Cyg OB2 #22, 23, 27, MT91 421, and 507. However, in most cases the peak-to-peak amplitude of this variability is limited to less than 0.15 mag. Whilst this is larger than the formal errors in the mag-nitudes, the problems caused by the straylight features probably account for part of this apparent variability. There is one excep-tion though: Cyg OB2 #27 (Table 5). The latter is a W UMa con-tact binary consisting of a late O and an early B-type star in a 1.46 day orbit (Rios & DeGioia-Eastwood 2004). Unfortunately, there are no ephemerides available for this system, but we sus-pect that the 0.64 mag drop that we observe in the UV M2 filter is likely due to the eclipse of the O-type star by its cooler com-panion.
3.2. Long and short term variations
Using a χ2 test, we searched for inter-pointing variability. The variability test is performed using the mean exposure-corrected
Table 5. OM light curve of Cyg OB2 #27 (= MT91 696). JD-2450000 AB-magnitude UVW1 3308.5052 ± 0.0184 16.38 ± 0.01 3318.4781 ± 0.0242 16.41 ± 0.01 3328.4983 ± 0.0289 16.55 ± 0.01 UV M2 3308.6205 ± 0.0463 19.86 ± 0.11 3318.6049 ± 0.0521 19.63 ± 0.08 3328.5934 ± 0.0579 20.27 ± 0.13 3338.5573 ± 0.0473 19.78 ± 0.08
Notes. The quoted uncertainty in the time corresponds to half of the exposure time.
Fig. 6. OM light curves of Cyg OB2 #27 as a function of orbital phase. Phase 0.0 was arbitrarily chosen at the time of the first observation.
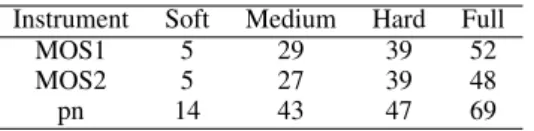
EPIC count rates from the different pointings, along with their estimated errors. The results are summarized in Table 6 for an adopted significance level of 95%. As can be seen from that ta-ble, the incidence of variability increases significantly from the soft to the hard energy band. There are two reasons for this trend: (1) the huge interstellar absorption leads to rather low count rates in the soft energy band; and (2) a fraction of the variable sources display flares (see below) associated with a hardening of their spectra, hence the largest variability occurs in the hard energy band.
Table 6. Statistics of our inter-pointing χ2 variability test as a function of instrument and energy band.
Instrument Soft Medium Hard Full
MOS1 5 29 39 52
MOS2 5 27 39 48
pn 14 43 47 69
Notes. The numbers provide the fraction (in %) of sources that display variability at a significance level of ≥ 95%.
The variability comes in different flavours. In some cases, it is clearly associated with a large (a factor 10 or more) in-crease in the count rate during a specific observation (sources number 34, 39, 67, 132, and 173). In other cases, the count rates display a modulation of typically a factor 2-3 in certain en-ergy bands (sources number 59, 107, 126, 144, 160, 182) from one observation to the other. In yet another group of (bright) objects, the variability is even more subtle, but still significant (CPR2002 A11). We note that the list of variable sources, espe-cially those of the last category, is not restricted to faint (proba-bly low-mass) sources, but also includes OB-type stars. Table 3 indicates that 9 OB stars out of 25 were detected to be vari-able, at least in one energy band, by at least two of the three EPIC instruments. This is in line with the conclusion of Naz´e (2009), who found that between one-third and two-thirds of the massive stars in the 2XMM catalogue display long-term varia-tions. In our sample of massive stars, the variable sources in-clude known colliding-wind binary systems (Cyg OB2 #5, #8a, #9), radial velocity variables (MT91 516, Kiminki et al. 2007), as well as stars for which multiplicity remains currently undeter-mined (Cyg OB2 #12, CPR2002 A11, Cyg OB2 #22, MT91 455, MT91 534). Among the eight X-ray brightest O-stars (those with mean pn count rates above 0.05 cts s−1), the only object that does not display significant variations in our data is Cyg OB2 #7. This star in addition does not display significant radial velocity vari-ations (Kiminki et al. 2007). These results suggest that in our sample the X-ray variability of O-type stars could be an indica-tor of multiplicity.
Adopting a timebin of 1 ksec, we extracted the light curves of those sources that display significantly higher count rates dur-ing a specific observation for each instrument and over three dif-ferent energy bands (medium, hard, and total). A priori, these long-term variations could represent a flaring event during the observation with the highest count rate. X-ray flaring is a com-mon property of magnetically active stars (e.g. Favata et al. 2005). Albacete Colombo et al. (2007b) detected flaring activity in about 15% of the sources in their 100 ksec Chandra observa-tion of Cyg OB2.
The X-ray light curves of the flare-candidates actually dis-play a wide variety of behaviours (see Fig. 7):
• Eight sources (34, 39, 64, 67, 86, 132, 149, and 173) display a genuine flare, although in two cases (64 and 86), our ob-servations only cover the decay phase of an event that most likely started before our observation. We attempted to fit the decay phase of the light curves in the total energy band with an exponential decrease of the form CRmax exp
h
−τti, where CRmaxis the count rate at the maximum of the flare and τ is the exponential decay time. The resulting decay times of five objects are between 1.7 and 7.3 ksec (i.e. 0.5 and 2 hours). Albacete-Colombo et al. (2007b) found decay times rang-ing from 0.5 to 10 hours in their 100 ksec observation. Our dataset is clearly biased against the detection of flare events with decay times longer than about 25 ksec (i.e. the mean duration of our individual observations). We note that some flare events cannot be modelled by an impulsive rise fol-lowed by an exponential decay. Source 173 for instance rises rather slowly (within 10 ksec) to its maximum and remains there for the remainder of observation 5. The flare event of source 34 is probably an example of sustained heating with a second flare occuring about 6 ksec after the first, more en-ergetic, one (see Fig. 8).
• Twenty-five sources (27, 57, 68, 70, 78, 82, 84, 89, 93, 94, 101, 106, 109, 124, 128, 130, 135, 137, 139, 140, 153, 179,
Fig. 7. EPIC light curves of variable sources illustrating the variety of behaviours that are observed. The green, blue, and black histograms yield the background-subtracted light curves in the medium, hard, and total energy band respectively. The time is given in ksec from the start of the corresponding observation. Top, from left to right: sources 39, 132, and 190 during observations 4, 6, and 2, respectively. Bottom, from left to right: sources 67 and 176 during observations 1 and 2, respectively.
186, 190, and 196) display a light curve with no clear flare events, but with some short-term (a few ksec) variations. In most cases, a significant fraction (typically more than half) of the photons of these sources are emitted in the hard energy band. Two of these sources (70 and 78) have a higher count rate during two observations (3+ 5 and 2 + 5, respectively). • Eight sources (16, 73, 79, 92, 134, 164, 169, and 176) dis-play a high count rate during a specific observation with slow variations (i.e. on the timescale of the duration of the obser-vation). These objects could be candidates for long duration (significantly longer than the duration of the observation) flares.
3.3. Spectra of variable non-OB sources
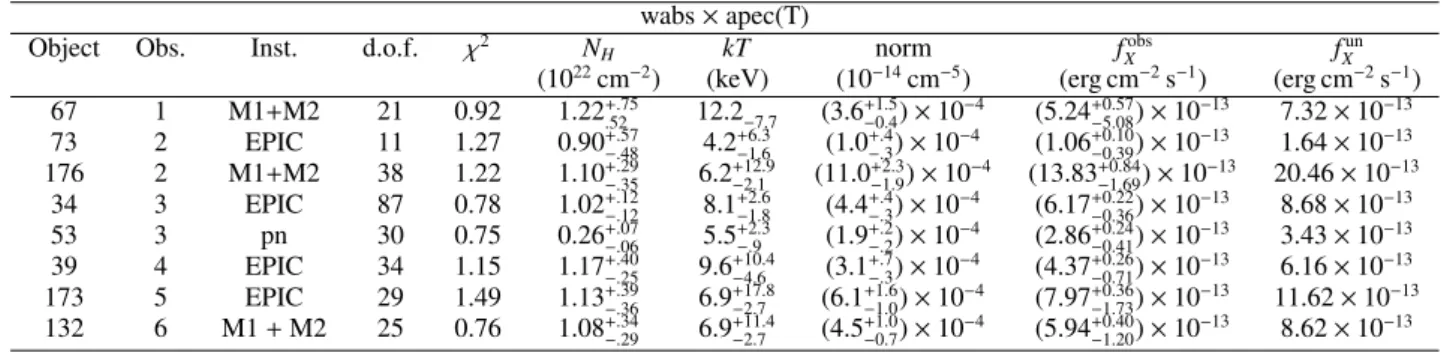
As pointed out in Sect. 3.2, a number of sources appear much brighter during a single observation than in average, although not all of these sources actually display a genuine flaring be-haviour. For the brightest of these objects, we were able to ex-tract and analyse their EPIC spectra. We attempted to fit these spectra with first an absorbed thermal plasma model and then an absorbed power-law model using the xspec software (version 12.6.0, Arnaud 1996). Except for a few cases (sources 73, 176) where both models provide equally good fits, the absorbed ther-mal plasma model (wabs × apec) is the one that most closely fits the data. The results are summarized in Table 7 and the fit of the spectra of source 34 is illustrated in Fig. 8.
All these sources have rather hard spectra characterized by high plasma temperatures (kT > 4 keV) as expected for mag-netically triggered X-ray flares. The column densities are some-what lower than expected for Cyg OB2 members, especially in the case of source 537. However, we stress that, given the high
7 We do not have a 2MASS counterpart with reliable photometry for
this source, but both the OM photometry and the optical photometry
plasma temperatures, the column densities are rather poorly con-strained. We emphasize that the quoted fluxes correspond to av-erage values over the entire observation under consideration. For flaring sources, they do not represent the peak luminosity. We note that the errors in the fluxes should be regarded only as in-dicative since the relevant xspec routine does not account for possible correlations between model parameters.
4. X-ray spectra of OB-type stars
At the sensitivity level of the current generation of X-ray tele-scopes, most early-type stars do not display short-term X-ray variability. However, in massive binary systems and single mas-sive stars with magnetic fields of sufficient strength to confine the wind in the equatorial region, a modulation of the X-ray emis-sion is expected and has been observed on the orbital or rota-tional period typically of the order of either days or weeks (see G¨udel & Naz´e 2009 and references therein).
The X-ray spectra of three of the brightest sources, (Cyg OB2 #5, #8a, and #9) were discussed elsewhere (De Becker et al. 2006, Linder et al. 2009, Naz´e et al. 2010, and Blomme et al. 2010), and we do not repeat their analysis here. For the other OB-stars that are sufficiently X-ray bright, we analysed the spec-tra of each observation using xspec.
The interstellar neutral-hydrogen column density is evalu-ated from the E(B − V) colour excess computed from the B − V colour measured by Massey & Thompson (1991) and by adopt-ing the gas-to-dust ratio of Bohlin et al. (1978). Early-type stars host dense stellar winds that can contribute to the absorption of X-rays produced in the inner regions of these winds. Therefore, whenever this turned out to be supported by our observations, we
from MT91 support the idea that this star is less heavily reddened than the majority of the stars towards Cyg OB2.
Table 7. Results of the spectral fits of the flaring sources with single temperature thermal plasma models.
wabs × apec(T)
Object Obs. Inst. d.o.f. χ2 N
H kT norm fXobs f
un X
(1022cm−2) (keV) (10−14cm−5) (erg cm−2s−1) (erg cm−2s−1)
67 1 M1+M2 21 0.92 1.22+.75.52 12.2−7.7 (3.6+1.5−0.4) × 10−4 (5.24+0.57 −5.08) × 10 −13 7.32 × 10⁻¹³ 73 2 EPIC 11 1.27 0.90+.57−.48 4.2+6.3−1.6 (1.0+.4−.3) × 10−4 (1.06+0.10 −0.39) × 10 −13 1.64 × 10⁻¹³ 176 2 M1+M2 38 1.22 1.10+.29−.35 6.2+12.9−2.1 (11.0+2.3−1.9) × 10−4 (13.83+0.84 −1.69) × 10 −13 20.46 × 10⁻¹³ 34 3 EPIC 87 0.78 1.02+.12−.12 8.1+2.6−1.8 (4.4+.4−.3) × 10−4 (6.17+0.22 −0.36) × 10 −13 8.68 × 10⁻¹³ 53 3 pn 30 0.75 0.26+.07−.06 5.5+2.3−.9 (1.9+.2−.2) × 10−4 (2.86+0.24 −0.41) × 10 −13 3.43 × 10⁻¹³ 39 4 EPIC 34 1.15 1.17+.40−.25 9.6+10.4−4.6 (3.1+.7−.3) × 10−4 (4.37+0.26 −0.71) × 10 −13 6.16 × 10⁻¹³ 173 5 EPIC 29 1.49 1.13+.39−.36 6.9+17.8−2.7 (6.1+1.6−1.0) × 10−4 (7.97+0.36 −1.73) × 10 −13 11.62 × 10⁻¹³ 132 6 M1+ M2 25 0.76 1.08+.34−.29 6.9+11.4−2.7 (4.5+1.0−0.7) × 10 −4 (5.94+0.40 −1.20) × 10 −13 8.62 × 10⁻¹³
Notes. The last two columns yield the observed and absorption corrected flux over the 0.5 – 10.0 keV energy range.
Fig. 8. Left: EPIC spectra (along with the best-fit model) of source 34 during the third observation. Right: EPIC light curves of this source during the same observation. The green, blue, and black histograms indicate the light curves in the medium, hard, and total energy bands, respectively. The time is given in ksec elapsed from the start of the third observation.
included an ionized wind absorption model (Naz´e et al. 2004) in addition to the neutral interstellar-medium absorption.
We compare the properties of these OB stars to the general X-ray emission properties derived by Naz´e (2009), who anal-ysed the data of OB stars in the 2XMM catalogue. Naz´e (2009) obtained log LX
Lbol = −6.45 ± 0.51 for those O-stars that have data of sufficient quality for a spectral fit and log LX
Lbol = −6.97 ± 0.40 from 26 O-type stars in the region of Cyg OB28. In cases where a two-temperature model was required to fit the 2XMM EPIC spectra, the normalization of the hotter component was gener-ally found to be less than 0.3 times that of the lower temperature component (Naz´e 2009).
8 Note that the latter relation was obtained by combining the data
for stars for which the X-ray fluxes were either extracted from spectral fits or obtained from the EPIC count rates using an average conversion factor. Note also that these LX
Lbolrelations include both single and binary
O-stars as Naz´e (2009) found no clear evidence of a general X-ray over-luminosity of O+ O binary systems. Some specific interacting-wind O-star binaries are indeed X-ray overluminous, but this overluminosity is not a general feature and is often restricted to specific orbital phases.
4.1. Cyg OB2 #12
Massey & Thompson (1991) quote a colour of B − V = 3.35 for Cyg OB2 #12, which corresponds to a colour excess of E(B − V) ' 3.45, assuming a B5 I spectral type (see below). When we adopt a distance modulus of 10.4 mag and RV = 3.1, we find that MV = −9.64. Assuming a bolometric correction of −0.95 then leads to logLbol
L = 6.13. This luminosity places the star very near the empirical Humphreys-Davidson limit (Humphreys & Davidson 1984).
The reddening of Cyg OB2 #12 is larger than the average value of other OB stars in Cyg OB2, and the membership of this star is still uncertain. ESA’s forthcoming GAIA mission should provide accurate astrometric measurements for this star that will help establish its membership. Spectral classifications of Cyg OB2 #12 range from B3 Ia to B8 Ia, suggesting that the star actually changes its spectral type with time (Kiminki et al. 2007 and references therein). For instance, Kiminki et al. (2007) presented spectra that indicate a B3 Iae type in September 2000 and B6-8 one year later. The nature of this star remains contro-versial, although based on its likely spectroscopic variability and incredibly high luminosity, Cyg OB2 #12 has been suggested to be an LBV candidate (see Clark et al. 2005 and references
therein). Cyg OB2 #12 was detected as an IRAS source and is ap-parently surrounded by both warm and cold dust (Parthasarathy et al. 1992).
Souza & Lutz (1980) classified Cyg OB2 #12 as a B8 su-pergiant with weak Balmer lines and emission in Hα suggesting that the other Balmer absorptions could be filled-in by emission. They also reported a variable absorption bluewards of Hα that they tentatively interpreted as a blueshifted Hα absorption as-sociated with an expanding shell at a velocity of 1400 km s−1. Klochkova & Chentsov (2004) classified Cyg OB2 #12 as B5 Ia+ with an uncertainty of half a subtype. These authors presented evidence of a line radial-velocity gradient that might indicate an infall of matter. They estimated that the star has a radius of or-der 338 R and a mass-loss rate of 4 × 10⁻⁵M yr−1. Klochkova & Chentsov (2004) inferred a rather slow wind velocity of 150 km s−1, which would have important consequences for the understanding of the observed X-ray emission (see below). Such a slow wind would indeed be able to produce hard X-ray emis-sion neither by means of wind embedded shocks nor head-on collisions of the wind from two hemispheres in a magnetically confined wind model. If Cyg OB2 #12 were a binary system, then the wind of the secondary star, colliding with that of the B supergiant, would have to be much faster. We note however that Leitherer et al. (1982) derived a significantly larger wind veloc-ity of 1400 km s−1from the Hα line profile and that Wang & Zhu (2003) reported an expanding shell at a velocity of 3100 km s−1. The EPIC spectra of this star cannot be fitted with single-temperature plasma models and we instead used two-temperature models. The huge interstellar column density that we infer from the E(B − V) colour excess (NH,ISM = 2.0 × 1022cm−2) produces such a strong absorption at low photon en-ergies that there is no room left for an additional ionized ab-sorption column associated with the stellar wind. After testing several options of absorbed two plasma temperature models, we found that the optimal results are obtained when only interstel-lar absorption is included and the absorbing column is left as a free parameter. The results of the fits are quoted in Table 8 and illustrated in Fig. 9. The average absorption-corrected X-ray flux corresponds to an X-ray luminosity of 4.1 × 1033erg s−1. With the caveat that the large interstellar reddening renders the bolometric luminosity estimation and the X-ray flux correc-tion more uncertain than for other stars in our sample, we de-rive log LX
Lbol = −6.10. This is an unusually large ratio, signif-icantly larger than the average value for O-type stars and cer-tainly exceptional for B-type stars. These characteristics imply that Cyg OB2 #12 might either be a binary or host a stellar wind confined by a strong magnetic field.
Figure 9 reveals moderate (∼ 10%) flux variability on timescales from a few days to a few weeks, as well as large varia-tions (37%) on timescales of years9. Long-term variations in the column density are also seen. However, there are apparently little or no changes in the plasma temperatures which are found to be 0.76 ± 0.03 and 2.03 ± 0.19 keV for the cooler and hotter com-ponent respectively. Albacete-Colombo et al. (2007a) reported a roughly linear decay of the ACIS-I countrate of Cyg OB2 #12
9 As a complement to our XMM-Newton data, we analysed the
ASCA-SIS spectra of Cyg OB2 #12 from 29 April 1993 previously analysed by Kitamoto & Mukai (1996). The SIS spectra can be fitted with a single temperature component at kT ' 0.90. The observed flux was found to be 2.2 × 10⁻¹²erg cm−2s−1, quite similar to the value of our
observa-tion 6. However, owing to the modest angular resoluobserva-tion of ASCA and the contamination of the background by straylight from Cyg X-3, the uncertainty in this result is rather large (about 25%).
from 0.18 to 0.16 cts s−1(i.e. a 12% variation) over their 100 ksec Chandraobservation. This result is very much in line with the ∼ 18% variations in the observed flux that we measure in our first four data points on timescales of about a week and the 10% variations seen between the last two pointings.
Table 9. OM UVW1 data of Cyg OB2 #12.
JD-2450000 UVW1
3308.505 20.08 ± 0.10
3318.478 20.13 ± 0.09
4220.282 20.00 ± 0.13
4224.061 20.25 ± 0.16
Cyg OB2 #12 was inside the OM FoV during four (1, 2, 5 and 6) out of the six observations. Owing to its heavy reddening, the star is detected only in the UVW1 band (see Table 9) with an average magnitude of 20.11. The lack of significant variations in this magnitude with time, indicates that if changes in spectral type have occured during our campaign, they were not associated with large changes in the UVW1 spectral domain.
4.2. Cyg OB2 #7
This O3 If∗ supergiant displays rather soft X-ray spectra that can be fitted well using a single temperature plasma compo-nent. From the colour excess E(B − V) = 1.73 (Massey & Thompson 1991), we infer an interstellar column density of NHISM= 1.0×1022cm−2. The spectra show evidence of additional absorption and we thus included absorption by an ionized wind in our model. The results of the fit (at energies above 0.4 keV) are listed in Table 10. There is no strong evidence of variability. The observed flux and the wind column density remain constant to within 10%. At first sight, the plasma temperature varies be-tween 0.56 and 0.77 keV. However, there is some degeneracy in the fits between the plasma temperature and its normalization and all the spectra are actually consistent with each other.
Herrero et al. (2002) inferred a luminosity of logLbol
L = 5.91± 0.10 (assuming the distance modulus of Massey & Thompson 1991). Scaling this number to the lower distance modulus of Hanson (2003, DM = 10.4) that we have adopted in this pa-per, yields logLbol
L = 5.59. Proceeding in the same way with the bolometric magnitude derived by Negueruela et al. (2008) yields logLbol
L = 5.87. Our mean, ISM absorption-corrected X-ray flux (8.76 ± 1.26) 10−13erg cm−2s−1 yields log LX
Lbol = −6.99 ± 0.06 or −7.27 ± 0.06 for the Herrero et al. (2002) and Negueruela et al. (2008) bolometric luminosities, respectively. We conclude that the X-ray emission of Cyg OB2 #7 does not reveal any be-haviour (hard X-ray emission, strong variability, or X-ray over-luminosity) that could hint at binarity or the effects of magnetic confinement of the stellar wind.
4.3. MT91 516
This star is of spectral type O5.5 V((f)). Its fundamental param-eters were determined by Herrero et al. (1999). Scaled to the distance adopted in the present paper, the bolometric luminos-ity is equal to logLbol
L = 6.01. Proceeding in the same way with the bolometric magnitude inferred by Negueruela et al. (2008) yields logLbol
Table 8. Best fits of the EPIC spectra of Cyg OB2 #12 for photon energies above 0.4 keV.
Cyg OB2 #12, wabs × (apec(T1)+ apec(T2))
Obs. Inst. d.o.f. χ2 N
H kT1 norm1 kT2 norm2 fXobs f
un X
(1022cm−2) (keV) (10−14cm−5) (keV) (10−14cm−5) (erg cm−2s−1) (erg cm−2s−1)
1 M1+2 129 1.29 1.88+.06−.06 0.74+.05−.16 (7.36+1.14−1.09) × 10−3 1.87+.18 −.13 (4.18+0.64−1.09) × 10 −3 (2.86+.04 −.09) × 10−12 2.36 × 10⁻¹¹ 2 M1+2 148 1.34 1.83+.05−.05 0.80+.05−.06 (7.95+0.94−0.52) × 10 −3 2.19+.22 −.19 (3.76+0.64−0.50) × 10 −3 (3.28+.06 −.08) × 10−12 2.40 × 10⁻¹¹ 3 EPIC 255 1.72 1.85+.03−.03 0.77+.03−.04 (8.54+0.73−0.71) × 10−3 1.91+.11 −.09 (4.34+0.42−0.45) × 10 −3 (3.27+.05 −.04) × 10−12 2.64 × 10⁻¹¹ 4 EPIC 192 1.26 1.83+.04−.05 0.74+.04−.02 (8.84+0.91−0.88) × 10 −3 1.81+.16 −.13 (3.36+0.54−0.55) × 10 −3 (2.74+.08 −.09) × 10−12 2.61 × 10⁻¹¹ 5 EPIC 108 1.15 2.06+.09−.09 0.78+.10−.08 (7.32+1.33−1.25) × 10−3 2.28+.98 −.42 (1.85+0.77−0.71) × 10 −3 (1.99+.04 −.23) × 10−12 2.00 × 10⁻¹¹ 6 EPIC 140 1.10 2.05+.07−.08 0.72+.08−.14 (7.57+1.28−1.16) × 10−3 2.10+.51 −.31 (2.62+0.93−0.76) × 10 −3 (2.17+.08 −.15) × 10−12 2.21 × 10⁻¹¹
Notes. The first three columns yield the number of the pointing, the instrument combination used in the fit and the number of degrees of freedom. The reduced χ2is given in column 4, whilst the columns 5 to 9 provide the parameters of the absorption component and the emitting plasma. The
last two columns yield the observed and absorption corrected flux over the 0.5 – 10.0 keV energy range.
Fig. 9. Left: EPIC spectra (along with the best-fit model) of Cyg OB2 #12 as observed during the third observation. Right: Best-fit parameters of the EPIC spectra of Cyg OB2 #12. The top panel illustrates the observed flux (in units 10−12erg cm−2s−1) over the 0.5 – 10 keV energy range. The middle panel yields the column density towards the X-ray emitting plasma, whilst the bottom panel displays the two temperatures of the emission components.
From the colour excess E(B − V) = 2.48 (Massey & Thompson 1991), we infer a large interstellar column density of NISM
H = 1.44 × 10
22cm−2. Nevertheless, the spectra display evi-dence of additional absorption that we modelled by including an ionized wind component. To achieve a reasonably good fit to the EPIC spectra, a two-temperature plasma model is required. The results of the fit to the EPIC spectra of MT91 516 (at energies above 0.4 keV) are listed in Table 11.
There is a degeneracy between the value of the ionized-wind column density and the temperature of the softer plasma com-ponent, and our best-fit solution oscillates between kT1 near 0.7 keV with a very low wind column density (observations 2 and 4), and kT1 near 0.25 keV with a significantly larger wind column density (all other observations). The second temperature component at kT2= (2.0 ± 0.2) keV is more tightly constrained. The MOS1 and pn count rates of this source are found to be variable though with a moderate amplitude. The same kind of variability is found in the observed flux of the source, which dis-plays variations with an amplitude of about 22% (peak to peak).
Owing to the degeneracy of kT1, the ISM absorption-corrected flux displays very large variations. The mean value of the ISM absorption-corrected X-ray flux (3.71 ± 1.84) 10−12erg cm−2s−1 yields log LX
Lbol = −6.79 ± 0.22 (for the Herrero et al. 1999 bolo-metric luminosity). Within the (large) errorbars, we find no sig-nificant X-ray overluminosity, relative to the canonical LX
Lbol value (Naz´e 2009).
The star displays radial velocity variations with a peak-to-peak amplitude of 113 km s−1 (Kiminki et al. 2007). Although these variations have an 11.5% probability of being caused by random noise, they might also represent binarity. Mason et al. (2009) reported the detection of an astrometric companion of similar brightness (magnitude difference of 0.4) at a separation of 0.7 arcsec. There is currently no evidence of any physical as-sociation between the two stars. Since there was no change in the position angle and separation of this pair over the time-frame of our X-ray observing campaign (Mason et al. 2009), it is unlikely that the observed X-ray variability, and by virtue the X-ray
emis-Table 10. Best-fits of the EPIC spectra of Cyg OB2 #7 for photon energies above 0.4 keV.
Cyg OB2 #7, wabs × wind × apec(T)
Obs. Inst. d.o.f. χ2 log Nwind kT norm fobs
X f
un X
(cm−2) (keV) (10−14cm−5) (erg cm−2s−1) (erg cm−2s−1)
1 EPIC 59 1.03 21.80+.06−.06 0.61+.05−.04 (1.27+0.24−0.20) × 10−3 (1.73+.13 −.16) × 10−13 8.81 × 10⁻¹³ 2 M1+2 34 1.25 21.76+.08−.08 0.76+.07−.07 (0.89+0.17−0.15) × 10−3 (1.78+.20 −0.21) × 10 −13 7.53 × 10⁻¹³ 3 EPIC 73 1.75 21.79+.05−.06 0.60+.04−.04 (1.30+0.21−0.18) × 10−3 (1.70+.09 −.11) × 10−13 9.17 × 10⁻¹³ 4 M1+2 22 0.71 21.72+.17−.16 0.56+.08−.11 (1.39+1.15−0.38) × 10−3 (1.75+.10 −.34) × 10−13 10.97 × 10⁻¹³ 5 M1+2 20 0.88 21.83+.10−.11 0.77+.16−.10 (1.00+0.32−0.24) × 10−3 (1.96+.14 −0.48) × 10 −13 7.60 × 10⁻¹³ 6 M1+2 28 1.14 21.84+.09−.10 0.58+.11−.08 (1.40+0.61−0.38) × 10 −3 (1.66+.13 −.32) × 10−13 8.49 × 10⁻¹³
Notes. The fit was perfomed with NISM
H fixed to 1.0×10
22cm−2. The first three columns yield the number of the pointing, the instrument combination
used in the fit, and the number of degrees of freedom. The reduced χ2is given in column 4, whilst the columns 5 to 9 provide the parameters of
the absorption component and the emitting plasma. The last two columns yield the observed and ISM absorption corrected fluxes over the 0.5 – 10.0 keV energy range.
Table 11. Same as Table 10, but for MT91 516.
MT91 516, wabs × wind × (apec(T1)+ apec(T2))
Obs. Inst. d.o.f. χ2 log Nwind kT
1 norm1 kT2 norm2 fXobs f
un X
(cm−2) (keV) (10−14cm−5) (keV) (10−14cm−5) (erg cm−2s−1) (erg cm−2s−1)
1 EPIC 57 1.18 21.5+.3−.8 0.28+.09−.08 (5.72+18.14−3.72 ) × 10−3 2.22+.37 −.31 (6.32+1.30−0.90) × 10 −4 (4.22+0.21 −0.74) × 10 −13 4.55 × 10⁻¹² 2 EPIC 82 0.84 19.6+1.6−.60 0.77+.22−.15 (6.98+2.93−0.76) × 10−4 2.26+.45 −.32 (6.00+0.64−0.50) × 10 −4 (4.97+0.03 −3.93) × 10 −13 2.48 × 10⁻¹² 3 EPIC 52 1.2 21.7+.2−.5 0.22+.10−.06 (14.5+75.8−11.2) × 10−3 1.91+.32 −.30 (8.85+2.04−4.75) × 10 −4 (4.58+0.25 −1.06) × 10 −13 7.04 × 10⁻¹² 4 EPIC 53 1.09 19.0+2.6−0.0 0.61+.16−.20 (8.19+8.37−2.57) × 10−4 1.86+.30 −.24 (7.25+4.53−1.29) × 10 −4 (4.73+0.01 −3.96) × 10 −13 2.97 × 10⁻¹² 5 EPIC 20 1.13 22.1+.3−.4 0.27+.35−.10 (18.0+515.0−17.4 ) × 10−3 1.85+1.09 −.51 (8.99+7.19−4.36) × 10 −4 (4.14+0.01 −3.24) × 10 −13 2.08 × 10⁻¹² 6 EPIC 35 0.88 21.7+.2−.6 0.32+.17−.13 (4.84+33.91−3.47 ) × 10−3 1.90+.66 −.42 (6.72+2.59−1.86) × 10 −4 (3.96+0.03 −1.36) × 10 −13 3.14 × 10⁻¹²
Notes. The fit was perfomed with NISM
H fixed to 1.44 × 10
22cm−2.
sion itself, could be associated with interactions between the as-trometric components.
4.4. The pair Cyg OB2 #22 A + B
Cyg OB2 #22 was classified as an O4 III(f) giant and a fit to its spectrum yielded logLbol
L = 6.04 (from the results of Herrero et al. 1999, scaled to our distance). The bolometric magni-tude given by Negueruela et al. (2008) yields a slightly larger logLbol
L = 6.10. However, Cyg OB2 #22 was subsequently re-ported to be a visual binary system consisting of an O3 I (star A) and an O6 V star (star B, Walborn et al. 2002, Mason et al. 2009) separated by about 1.5 arcsec. The O6 V component is itself a double system with a separation of 0.2 arcsec and a magnitude difference of 2.34 in the z filter (Sota et al. 2011). A priori, this result casts some doubt on the luminosity inferred by Herrero et al. (1999), although the sum of the ‘typical’ luminosities of an O3 I and an O6 V star (Martins et al. 2002) amounts to a very similar value logLbol
L = 6.07. In the following, we adopt this latter value. We note that the separation between the A and B components is too small to resolve their X-ray emission with XMM-Newton.
From the B − V= 2.04 colour index (Massey & Thompson 1991), we derive an interstellar column of NISM
H = 1.35 × 1022cm−2. To achieve a good fit of the EPIC spectra, we need to include an ionized wind absorption. In addition, a second plasma temperature is required for the first four observations. In the last two observations, which have lower fluxes and lower
signal-to-noise ratio, this second temperature is not constrained and is ac-tually not required to achieve an acceptable fit.
The observed flux varies by nearly a factor of two between the second and the sixth observations. This variability is not due to an instrumental effect as it is also seen in the count rates of all the individual EPIC cameras. The EPIC count rates of this source are indeed found to be variable at the 99.9% level (though not in all energy bands for each instrument). The ISM absorption-corrected fluxes vary by a factor of three and the extreme values correspond to LXin the range from 1.5×1032to 4.5×1032erg s−1 and log LX
Lbolbetween −7.47 and −7.00. The star hence varies from underluminous by a factor three to just at the typical X-ray lu-minosity level.
4.5. CPR2002 A11
Negueruela et al. (2008) inferred logLbol
L = 5.44 (again scaled to the distance adopted in the present paper) for this O7.5 Ib-II(f) star. From B − V = 2.19 (for MT91 267), we estimate that NISM
H = 1.43 × 10
22cm−2. The spectra are unlikely to contain an additional (wind) absorption component, thus we fitted them using a single-temperature plasma model with fixed interstellar absorption.
This source is found to be highly variable in count rate (in all three EPIC instruments) and this variability is reflected in the observed flux that varies by a factor of 2.7. The ISM absorption-corrected fluxes yield log LX
Lbol between −6.84 and −6.44. This star hence appears somewhat overluminous in X-rays. Furthermore, that its X-ray emission varies and is domi-nated by a relatively hot plasma at (1.60 ± 0.15) keV suggests
Table 12. Same as Table 10, but for Cyg OB2 #22.
Cyg OB2 #22, wabs × wind × (apec(T1)+ apec(T2))
Obs. Inst. d.o.f. χ2 log Nwind kT
1 norm1 kT2 norm2 fXobs f
un X
(cm−2) (keV) (10−14cm−5) (keV) (10−14cm−5) (erg cm−2s−1) (erg cm−2s−1)
1 EPIC 62 1.18 21.6+.1−.2 0.50+.09−.13 (1.88+2.05−.60 ) × 10−3 2.27+1.27 −.55 (2.10+1.28−.88 ) × 10−4 (2.64+0.20−0.73) × 10 −13 1.99 × 10⁻¹² 2 EPIC 56 0.95 21.6+0.1−.3 0.57+.09−.10 (1.51+0.76−0.42) × 10 −3 3.33+2.5 −.88 (2.52+0.97−0.92) × 10 −4 (3.48+0.19 −0.86) × 10 −13 1.94 × 10⁻¹² 3 EPIC 70 1.18 21.7+0.1−.3 0.30+.10−.11 (3.16+3.96−1.88) × 10−3 0.89+.10 −.11 (6.96+2.68−1.56) × 10 −4 (1.99+0.12 −0.55) × 10 −13 2.15 × 10⁻¹² 4 EPIC 37 1.69 21.8+0.2−.3 0.29+.04−.10 (6.51+6.97−5.39) × 10 −3 1.62+.85 −.38 (4.00+2.85−1.95) × 10 −4 (2.41+0.10 −1.13) × 10 −13 2.62 × 10⁻¹² 5 M1+M2 9 1.45 21.7+.3− 0.93+.32−.22 (0.91+.68−.36) × 10−3 – – (1.96+0.18−1.00) × 10 −13 0.88 × 10⁻¹² 6 EPIC 22 1.23 21.5+.3−.4 0.73−.14+.32 (1.05+.84−.48) × 10−3 – – (1.77+0.16 −0.60) × 10 −13 1.31 × 10⁻¹²
Notes. The fit was perfomed with NISM
H fixed to 1.35 × 10
22cm−2.
Table 13. Same as Table 10, but for CPR2002 A11.
CPR2002 A11, wabs × apec(T)
Obs. Inst. d.o.f. χ2 kT norm fobs
X f
un X
(keV) (10−14cm−5) (erg cm−2s−1) (erg cm−2s−1)
1 EPIC 85 1.60 1.63+.07−.06 (1.20+.05−.04) × 10−3 (5.29+.23 −.21) × 10−13 1.70 × 10⁻¹² 2 EPIC 52 1.27 1.49+.09−.09 (0.60+.03−.04) × 10−3 (2.44+.16 −.17) × 10−13 0.88 × 10⁻¹² 3 M1+M2 51 1.89 1.52+.09−.08 (1.19+.07−.08) × 10−3 (4.96+.26 −.28) × 10−13 1.74 × 10⁻¹² 4 M1+M2 25 1.67 1.89+.19−.20 (1.05+.08−.08) × 10−3 (5.21+.43 −.44) × 10−13 1.43 × 10⁻¹² 5 M1+M2 24 1.07 1.57+.15−.14 (1.56+.11−.12) × 10−3 (6.62+.71 −.50) × 10−13 2.22 × 10⁻¹² 6 M1+M2 22 0.94 1.49+.15−.17 (0.97+.08−.08) × 10−3 (3.95+.33 −.34) × 10−13 1.42 × 10⁻¹²
Notes. The fit was perfomed with NISM
H fixed to 1.43 × 10
22cm−2.
that it might either be an interacting wind binary system or a star containing a magnetically confined wind. Spectroscopic moni-toring in the optical is highly desirable to help us establish the multiplicity of this object.
5. Conclusions
We have discussed the X-ray properties of a number of stars in the core of Cyg OB2. One of this association’s most interesting stars is the LBV candidate Cyg OB2 #12. We have shown for the first time that the X-ray flux of this star varies on many di ffer-ent timescales ranging from days to years. These variations are mainly due to variations in the column density and changes in the emission measure of the harder component of the spectrum as one would expect for models of either an eccentric colliding wind binary or a rotationally modulated magnetically confined wind. Given that the variability occurs on timescales as short as days, the latter scenario seems slightly more plausible. An ex-tensive monitoring of this star, both in the optical and the X-ray domain could shed new light on the nature of this intriguing ob-ject.
Apart from the known colliding-wind systems, the majority of the O-type stars in Cyg OB2 appear to have rather normal X-ray properties. Their comparatively hard X-ray emission is not intrinsic to the sources, but is caused instead by the huge interstellar absorption towards the association. Several objects feature a second thermal component that is too hot to be easily explained by the wind-embedded shocks scenario. However, it must be stressed that this result is not restricted to the stars in our sample, nor direct evidence of either multiplicity or a magnetic field. Indeed, a second thermal component with a temperature around 2 keV is frequently required to fit high quality CCD X-ray spectra of O-type stars, regardless of their multiplicity (e.g.
Naz´e et al. 2011). In our sample, the exceptions to this general statement are MT91 516 and CPR2002 A11, which we propose to be good candidates for binary systems. About one third of the OB stars display variability between our pointings. All known binary systems (except for the W UMa system Cyg OB2 #27) are highly variable, which suggests that the other variable OB stars might also be binaries. However, we stress that these objects do not necessarily display a permanent excess X-ray emission; the Trapezium-like system Cyg OB2 #22 even appears to be ‘X-ray underluminous’ in some of our observations.
Finally, a large number of the secondary sources, the bulk of which are most likely associated with pre-main sequence low-mass stars, also display highly significant variability. However, this variability appears to be more complex than the impulsive rise followed by an exponential decay that is commonly seen in flaring stars. Clarifying the relationship between these objects and the massive star population in Cyg OB2 will help us deter-mine the impact of massive stars on star formation in their roundings. In this respect, the Chandra very large program sur-vey of Cyg OB2 (Drake 2011) and its multi-wavelength support observations will certainly help us make substantial progress.
Acknowledgements. My heartiest thanks go to Dr. Ya¨el Naz´e for sharing her spectral extraction routines with me and for her help in preparing Fig. 2. I thank the referee, Dr. Marc Gagn´e, and the editor, Prof. Ralf Napiwotzki, for their re-ports that helped improve the manuscript and Dr. Nicolas Wright for stimulating discussion on Cyg OB2. I acknowledge support from the Fonds de Recherche Scientifique (FRS/FNRS), through the XMM/INTEGRAL PRODEX contract as well as by the Communaut´e Franc¸aise de Belgique - Action de recherche con-cert´ee - Acad´emie Wallonie - Europe. This research made use of data products from the Two Micron All Sky Survey, which is a joint project of the University of Massachusetts and the Infrared Processing and Analysis Center/California Institute of Technology, funded by NASA and NSF.

![Table 2. Properties of the X-ray sources in Cyg OB2 detected with XMM-Newton. [1] [2] [3] [4] [5] [6] [7] [8] [9] [10] [11] [12] 6 20:32:22.3 + 41:18:17.3 0.1584D + 00 0.0162 6 0.6659D + 00 0.0000 6 0.2717D + 00 0.0000 6 13 20:32:31.4 +41:14:06.0 0.6859D−0](https://thumb-eu.123doks.com/thumbv2/123doknet/6126253.156186/5.892.63.828.110.992/table-properties-ray-sources-cyg-detected-xmm-newton.webp)