Cost Assessment in Ship Production
Volker Bertram, ENSIETA Jean-Jacques Maisonneuve, SIREHNA
Jean-David Caprace, Philippe Rigo, ANAST, University of Liège
This paper results from part of the work performed in sub-project II.1 of InterSHIP, a European R&D project funded under the European Commission's Sixth Framework Programme for Research and Technological Development. (Project n° TIP3-CT-2004-506127)
1. Production Cost Assessment
Estimating the production cost is a fundamental part of ship design. The option for estimating the production cost differs in the required information (input data). The less information is needed, the earlier a method can be employed in the design process. The more information is used, the finer differences between design alternatives can be analyzed.
The methods for estimating production cost are classified into
• Top-Down (macro, cost-down or historical) approaches (empirical, statistical and close-form equations, ...)
The top-down approach determines the production cost from global parameters such as the weight of the hull, the block coefficient, the ship length etc., Schneekluth and Bertram (1998), Carreyette
(1977). The relations between cost and global parameters are found by evaluation of previous
ships. Thus, the top-down approach is only applicable if the new design is similar to these previous ships. Also, the cost estimation factors in the approach reflect past practice and experience. Despite its popularity and frequent references in the literature, top-down approaches have serious disadvantages, which are often overlooked or concealed:
− The approach uses only global information and is thus incapable of reflecting local form changes or details of the design improving producibility.
− The approach is usually based on weight. Any change, which increases weight, will automatically increase the cost estimate regardless of the real effect on cost. Extreme lightweight designs may drastically increase the number of required hours, while large frame spacing may increase weight, but decrease necessary man-hours. This is often not reflected in the formulae!
− The approach is based on historical data, i.e. historical designs and historical production methods. In view of the sometimes revolutionary changes in production technology over the last decade, the data and formulae may sometimes be called 'prehistoric'. They do not reflect new approaches in structural design or production technology.
− The approaches were probably based on inaccurate data even at the time they were derived. Shipyards are traditionally poor sources of cost information. The data are frequently skewed reflecting pressures of the first-line managers and other factors.
− Not suitable for structure optimization as there is no link between the cost and the design variables (scantlings).
• Bottom-Up (micro, cost-up or engineering analysis) approaches (direct rational assessment)
The alternative “bottom-up approach” breaks down the project into elements of work and builds up a cost estimate in a detailed engineering analysis. Southern (1980), Moe and Lund (1968),
Winkle and Baird (1986), and Rigo (2001) developed simplified cost models based on direct
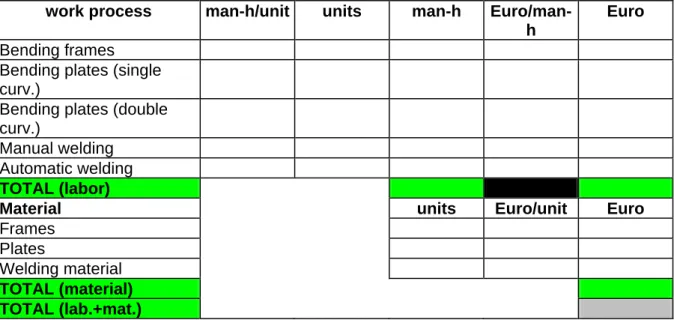
calculation using quantities and unitary cost to assess the global production cost. Welding position, accessibility, etc can be considered using additional corrections. Table I shows a simple example of a possible bottom-up calculation of labor cost and material cost for hull production. For each work process the number of necessary man-hours is computed by multiplying the
average man-hours per unit with the number of units for this work process. Units for a work process could be: ‘number of frames and plates requiring bending', 'meters of weld’ etc. The total number of necessary man-hours is then the sum of all man-hours for the individual work processes. The man-hours are converted into cost by multiplication of the man-hours for each work process with the shipyard specific cost factor (monetary unit/man-hour) for this work process. The sum of all work processes gives the total labor cost. Similarly the material cost are estimated. The depth of differentiation of the individual work processes is chosen appropriately. The bottom-up approach requires more effort and detailed information than the top-down approach, but unlike the top-down approach, the bottom-up approach captures also differences in design details and are thus suitable for scantling and shape optimizations. Changing the local hull geometry influences the number of frames which require bending, the effort in plate bending, and the degree of weld automation which depends on the curvature of the weld joints. All these effects are reflected by an appropriate decomposition of the total work process into its individual components. At present, this approach is not available in most shipyards; neither are historical databases from which it could be developed. It is then necessary to develop an appropriate approach, and collect the data required to use the approach. An advanced optimization application in this field is the work of ANAST for ship structures using the LBR-5 system, Rigo (1992,
2001a,b, 2003a,b), Rigo and Fleury (2001), Karr et al. (2002). This is possibly the only such
system that has been applied in shipyard work.
Table I : Bottom-up approach for estimating production cost
work process man-h/unit units man-h
Euro/man-h
Euro
Bending frames Bending plates (single curv.)
Bending plates (double curv.)
Manual welding Automatic welding
TOTAL (labor)
Material units Euro/unit Euro
Frames Plates Welding material TOTAL (material) TOTAL (lab.+mat.) 2. Advanced Systems
2.1. PODAC Cost model: US Navy approach
Deschamps and Trimbule’s (2004) recent discussion of “Cost Estimating” disappoints, as it does not
really provide an up to date survey and presents mainly top-down approaches. In their last section, Deschamps and Trimbule refer to a series of systems (tools) used for navy ships: ASSET, ACEIT, UPA, PRICE, and finally the PODAC (Product-oriented Design and Construction) cost model. PODAC, Ennis et al. (1998), Keane and Fireman (1993), Wade et al. (1997), is rather a sophisticated top-down approach. However, PODAC can be linked to other ship design tools with cost estimating capabilities that operate at more detailed level analysis:
- Parametric Flagship, a system developed under a Maritech ASE project, links various ship design and naval architecture analysis systems directly with the PODAC cost model
- Intergraph’s multi-discipline GSCAD system was also linked with the PODAC cost model - The Navy’s ASSET design tool was linked to the PODAC cost model
Unfortunately all these tools are oriented towards combatants and the real methodology and details are not published.
2.2. Smart Product Model (SPM), USA
The Smart Product Model (SPM) of Proteus Engineering, Ross et al. (2001), Ross and Hazen (2002),
Ross (2004), is crafted in such a way that at all times during the design of a vessel it will provide the
best cost estimates for the available information. The system estimates ship production costs in a Ship Work Breakdown Structure (SWBS) hierarchy for three independent levels of details, Fig.1:
− for concept design, the cost estimate will be based on whole-vessel technical and parametric relationships derived from approximately about 20 data items (e.g., length, beam, displacement, installed power).
− for preliminary design, system information becomes available, and the cost estimate is based on about 125 data items.
− for the contract design, the cost estimate is based on hundreds or even thousands of data items. As the design progresses, more and more of the technical and cost information migrates from statistical parameters to physics-based, and the accuracy of the cost estimate improves.
OUTPUT INPUT PROCESS Reports - 1 digit SWBS - 2 digit SWBS - 3 digit SWBS Quantities Selection - 1 digit SWBS - 2 digit SWBS - 3 digit SWBS Cost Estimation - 1 digit SWBS - 2 digit SWBS - 3 digit SWBS Engineering Quantities
- 1 digit SWBS - Ship Characteristics - 2 digit SWBS - System Characteristics - 3 digit SWBS - Sub-system Characteristics
Estimated Quantities
- 1 digit SWBS - Ship Characteristics - 2 digit SWBS - System Characteristics - 3 digit SWBS - Sub-system Characteristics
Quantities Confidence
- Material Cost - Labor Hours
Cost Estimation Equations Confidence
Material Cost - Labor Hours OUTPUT INPUT PROCESS Reports - 1 digit SWBS - 2 digit SWBS - 3 digit SWBS Quantities Selection - 1 digit SWBS - 2 digit SWBS - 3 digit SWBS Cost Estimation - 1 digit SWBS - 2 digit SWBS - 3 digit SWBS Engineering Quantities
- 1 digit SWBS - Ship Characteristics - 2 digit SWBS - System Characteristics - 3 digit SWBS - Sub-system Characteristics
Estimated Quantities
- 1 digit SWBS - Ship Characteristics - 2 digit SWBS - System Characteristics - 3 digit SWBS - Sub-system Characteristics
Quantities Confidence
- Material Cost - Labor Hours
Cost Estimation Equations Confidence
Material Cost - Labor Hours OUTPUT OUTPUT INPUT INPUT PROCESS Reports - 1 digit SWBS - 2 digit SWBS - 3 digit SWBS Quantities Selection - 1 digit SWBS - 2 digit SWBS - 3 digit SWBS Cost Estimation - 1 digit SWBS - 2 digit SWBS - 3 digit SWBS Reports - 1 digit SWBS - 2 digit SWBS - 3 digit SWBS Quantities Selection - 1 digit SWBS - 2 digit SWBS - 3 digit SWBS Cost Estimation - 1 digit SWBS - 2 digit SWBS - 3 digit SWBS Quantities Selection - 1 digit SWBS - 2 digit SWBS - 3 digit SWBS Quantities Selection - 1 digit SWBS - 2 digit SWBS - 3 digit SWBS Cost Estimation - 1 digit SWBS - 2 digit SWBS - 3 digit SWBS Engineering Quantities
- 1 digit SWBS - Ship Characteristics - 2 digit SWBS - System Characteristics - 3 digit SWBS - Sub-system Characteristics
Estimated Quantities
- 1 digit SWBS - Ship Characteristics - 2 digit SWBS - System Characteristics - 3 digit SWBS - Sub-system Characteristics
Quantities Confidence
- Material Cost - Labor Hours
Engineering Quantities
- 1 digit SWBS - Ship Characteristics - 2 digit SWBS - System Characteristics - 3 digit SWBS - Sub-system Characteristics
Estimated Quantities
- 1 digit SWBS - Ship Characteristics - 2 digit SWBS - System Characteristics - 3 digit SWBS - Sub-system Characteristics
Engineering Quantities
- 1 digit SWBS - Ship Characteristics - 2 digit SWBS - System Characteristics - 3 digit SWBS - Sub-system Characteristics
Engineering Quantities
- 1 digit SWBS - Ship Characteristics - 2 digit SWBS - System Characteristics - 3 digit SWBS - Sub-system Characteristics
Estimated Quantities
- 1 digit SWBS - Ship Characteristics - 2 digit SWBS - System Characteristics - 3 digit SWBS - Sub-system Characteristics
Quantities Confidence
- Material Cost - Labor Hours
Cost Estimation Equations Confidence
Material Cost - Labor Hours
Cost Estimation Equations Confidence
Material Cost - Labor Hours
The cost estimating software is divided into two linked elements, one focused on engineering and the other focused on cost. Each element has modules for specific operations. The cost element has the four modules:
- Parametric cost: Cost is estimated for the design ship based on a proportionality with regard to the base ship.
- Assigned costs: Assigned costs are directly entered into the module. These costs are based on data such as initial estimates from vendors and from purchase orders.
- Cost source selection: The user selects between the parametric and the assigned values. - Cost reports: This module produces three reports: 1-digit, 2-digit, and 3-digit SWBS cost
estimates, with overall confidence levels provided for each cost entry.
Fig.2 shows one version of the user interface to the SPM environment. In the upper left-hand corner is a cut-away view of the ship’s structure. On the right side is a hierarchical breakdown of the engineering model, the ship work breakdown structure (SWBS), the product model, the compartment model, and the project overview. In the lower center is a dialogue box for user input of ship’s requirements for operation, payload capacity, and number of officers and crew. Visible at the top of the dialogue box are tabs for two other dialogue boxes: Characteristics and Analysis Summary.
The calculated cost estimate, estimated labor hours, and other estimates for structure and power/resistance are presented in an Analysis Summary dialogue box, Fig.3.
Fig.2: Example User Interface, Ross and Hazen
(2002)
Fig.3: Analysis Summary Dialogue Box, Ross and
2.3. Mitsubishi CIM system, Japan
Mitsubishi Heavy Industries (MHI) developed a system interfaced to its structural design CAD system, Sasaki et al. (2001,2002), Sasaki (2003). Production planning information estimation functions and leveling functions were added to a commercially available line simulation system. Application of the system to an actual vessel resulted in the reduction of the 2~3 week time period conventionally required for consideration to just one day. The process planning system with 3-D visualization function enables the designer to semi-automatically define the hull block assembly sequence and to calculate the evaluation value (cost, time, weight,…) for each process design candidate, Fig.4. The cost estimation function in the CAPP (computer aided process planning) system of Mitsubishi multiplies weld length (for each weld class) by a factor reflecting the work difficulty (e.g. 1 for downward, 2 for upward, 1.5 for horizontal):
Cproduction = Σ (Wconversion × Cunitconst) Wconversion = Wreal × K
Cproduction is the cost for production of one block,
Wconversion converted welding length (considering the different difficulty of welding depending on posture),
Cunitconst the cost to weld 1m for each posture, Wreal the actual welding length,
K a coefficient to express the difficulty of the welding work.
Fig.4: Application of bottom-up approach comparing shell-base production (left) and deck-base production approach (right); analysis gave 3% cost advantage for deck-base approach, Sasaki
(2003)
Fig.5: Computer aided process planning system using expert knowledge, Sasaki (2003)
Fig.5 shows a basic operating screen of the process planning system. The left-hand side of the screen is a dialogue-type network editor for the intermediate product, and the right-hand side is a 3-D representation of the intermediate product and its parts, showing shape and factory facility information. This allows to study the assembly procedure, while viewing the shape of the intermediate product. A knowledge-based system enables the automatic definition of the assembly sequence based on production practices and engineer’s know-how, Fig.6: First the pre-assembly base plate of hull block is selected, then an assembly tree of the block is defined automatically, using production rules accumulated in the knowledge base. This knowledge base stores knowledge specific to MHI with respect to assembly tree generation, and incorporates current practice obtained from the comments and observations of actual production engineer. Nevertheless, as it is difficult to obtain practical assembly
tree full-automatically for every kind of block, the system has been equipped with an assembly tree editor that helps for the production engineer to modify it efficiently.
Fig.6: Flow Assembly procedure definition function, Sasaki (2003)
Read-in of hull block
Define the base plate of pre-assembly block Automatic definition of smaller assemblies Parts information Plate Stiffener Bracket etc. W eld line
Define the base plate of pre-assembly block Stiffener C
Plate A Plate B
Collar D Weld line data (Plate A & Plate B)
pre-assembly base plate (Its name is “O”)
pre-assembly base plate (Its name is “M”)
Block O
M
Pre-assembly base plate (O) Pre-assembly base plate (M) Other parts
Block Part
Part Part Part
Initial assembly tree Overview of read-in information
Example: Double bottom block
Magnified
Automatic definition of detailed assembly procedures Definition of fabrication information for weld lines
Block O
M
Pre-assembly base plate (O)
Pre-assembly base plate (M ) Parts transported
directly to ship
Parts transported directly to pre-assembly(O) Sub assembly Parts transported directly to pre-assembly(M ) Sub assembly
Parts
3. Simulation: Cost assessment approach of the future?
Discrete event simulation develops rapidly and pilot applications are found also in shipbuilding. Simulation can be used both for long-term and for short-term planning. Once workshops of a shipyard are modeled and the interfaces to the CAD system established, specific applications for ship structures are fast. These simulations serve to determine capacity utilization and assembly times, investigate “what-if” scenarios, but could also be coupled to cost estimates for different build strategies.
Shin et al. (2003) in Korea developed a virtual model of a shipyard forming factory. The workshops
(cutting, roll bending by 400 ton, 1500 ton, and 2200 ton, line heating), buffers, cranes and workers were modeled as 3-d objects working together to fabricate the plate. The model allows thus a realistic simulation of the material flow and virtual reality visualization.
Steinhauer (2003) describes ship production simulation at Flensburger Schiffbau Gesellschaft
shipyard, Fig.7. The product data contains all geometrical and methodical information about the ship while the simulation model includes all parameters describing the production facilities, resources and processes. The simulation tool is not specific to any ship type and the same software is used also to model for example cargo flow in ro-ro ships already in the design stage. Recently, ANAST (Univ. of Liege) started with the Em-Plant software also used by Flensburger to link production simulation and optimization. It was found that the modeling is rather straight-forward and practical simulations can performed within a couple of months. Key issues are the data availability and data scatter.
Fig.7: Simulation model of the pre-production from panel line to section welding at Flensburger
Schiffbau Gesellschaft (2003)
Sasaki (2003) describes also a virtual factory for production stage evaluation employing some virtual
reality techniques and discrete event simulation. Basic motions of shipbuilding-related activities were converted and transferred into the database beforehand. Product and process data are then used for simulation. Fig.8 shows one example where a scenario with one worker is compared to a scenario with two workers. The single worker performs everything from materials transport to tentatively fixing the positions, and welding. For two workers, Worker A transports material up to tentative fixing of the position, while Worker B does the final welding. The simulation gives the achievable speed-up for adding a worker and shows idle times and bottle-necks.
Plate cutting Plate welding Profile erection Outfitting assembly Section assembly and outfitting
Welding of profiles and
outfitting Section
References
CARREYETTE,J.(1977), Preliminary ship cost estimation, Trans. RINA, pp. 235-249
DESCHAMPS, L. C.;TRUMBULE, J.(2004), Cost Estimation (Ch.10), Ship Design and Construction,
SNAME (Ed. T. Lamb)
ENNIS, K.J.; DOUGHERTY, J.J.; LAMB, T.; GREENWELL, C.R.; ZIMMERMANN, R. (1998),
Product-oriented design and construction cost model, J. Ship Production, pp.41-58
KEANE, R.G.;FIREMAN,H.;(1993), Producibility in the naval ship design process: A progress report, J. Ship Production, pp.210-223
MOE, J.; LUND, S.; (1968), Cost and weight minimization of structures with special emphasis on
longitudinal strength members of tankers, RINA, pp.43-70
RIGO, P.; (2001), Least-Cost structural optimization oriented preliminary design, Journal of ship production, pp.202-215
ROSS, J.M.(2004), A practical approach for ship construction cost estimating, 3rd COMPIT, Siguenza
ROSS, J.M.; MCNATT, T. R.; HAZEN, G. S. (2001), The project 21 smart product model - A new paradigm for ship design, Cost estimation and production planning, SNAME Ship Production
Symposium, Ypsilanti
ROSS, J.M.;HAZEN,G.S.;(2002), Forging a real-time link between initial ship design and estimated
costs, ICCAS 2002
SASAKI, Y. ; M.MIURA, M.; TAKANO, G.; FUJITA, K.; FUJIWARA, N.; IIDA, A.;SAGOU, A. (2001),
Research on Total Cost Evaluation System for Shipyard, 7th Int. Symp. Japan Welding Society
SASAKI, Y.; SONDA, M.; ITO, K. (2002), A study on 3-D digital mockup systems for work strategy
planning, ICCAS’02, Malmo
SASAKI, Y.;(2003), Application of factory simulation to the shipyard, COMPIT'03, Hamburg, pp.362-376
SOUTHERN, G.;(1980), Work content estimating from a ship steelwork data base, RINA, pp.339-347 STEINHAUER, D.;(2003), The virtual shipyard - Simulation in production and logistics at Flensburger, COMPIT’03, pp.203-209
WADE, M.;KOENIG,P.C.;KARASZEWSKI,Z.J.;GALLAGHER,J.;DOUGHERTY,J.J.;(1997), Mid-term
sealift technology development program : design-for-production R&D for future sealift ship applications, J. Ship Production, pp.57-73
WINKLE, I. E.;BAIRD, D.; (1986), Towards more effective structural design through synthesis and
optimisation of relative fabrication costs, RINA, pp.313-336
SCHNEEKLUTH, H.; BERTRAM, V. (1998), Ship design for efficiency and economy,
Butterworth+Heinemann, Oxford
SHIN, J.G.; SOHN, S.J. (2000), Simulation-Based evaluation of productivity for the design of an
automated workshop in shipbuilding, J. Ship Production, pp.46-59
SHIN, J.G.; LEE, K.K.; WOO, J.H.; LEE, J.H.; KIM, S.H. (2003), A modeling and simulation of production process at a virtual shipyard, COMPIT’03, Hamburg, pp.534-541