HAL Id: hal-00718347
https://hal.archives-ouvertes.fr/hal-00718347v3
Submitted on 4 Oct 2012
HAL is a multi-disciplinary open access
archive for the deposit and dissemination of
sci-entific research documents, whether they are
pub-lished or not. The documents may come from
teaching and research institutions in France or
abroad, or from public or private research centers.
L’archive ouverte pluridisciplinaire HAL, est
destinée au dépôt et à la diffusion de documents
scientifiques de niveau recherche, publiés ou non,
émanant des établissements d’enseignement et de
recherche français ou étrangers, des laboratoires
publics ou privés.
accuracy as well as duplications, transfers and losses
predictions
Thi-Hau Nguyen, Jean-Philippe Doyon, Stéphanie Pointet, Anne-Muriel
Arigon Chifolleau, Vincent Ranwez, Vincent Berry
To cite this version:
Thi-Hau Nguyen, Jean-Philippe Doyon, Stéphanie Pointet, Anne-Muriel Arigon Chifolleau, Vincent
Ranwez, et al.. Accounting for gene tree uncertainty improves gene tree accuracy as well as
dupli-cations, transfers and losses predictions. 12th International Workshop on Algorithms in
Bioinfor-matics (WABI 2012), Sep 2012, Ljubljana, Slovenia. pp.123-134, �10.1007/978-3-642-33122-0_10�.
�hal-00718347v3�
Gene Trees and Reconciliation Inference
Thi Hau Nguyen1,2, Jean-Philippe Doyon1, St´ephanie Pointet1,Anne-Muriel Arigon Chifolleau1, Vincent Ranwez2, and Vincent Berry1
1 LIRMM, Universit´e Montpellier 2 - CNRS, France 2 Montpellier SupAgro (UMR AGAP)
Abstract. We propose a reconciliation heuristic accounting for gene duplications, losses and horizontal transfers that specifically takes into account the uncertainties in the gene tree. Rearrangements are tried for gene tree edges that are weakly supported, and are accepted whenever they improve the reconciliation cost. We prove useful properties on the dynamic programming matrix used to compute reconciliations, which allows to speed-up the tree space exploration when rearrangements are generated by Nearest Neighbor Interchanges (NNI) edit operations. Ex-perimental results on simulated and real data confirm that running times are greatly reduced when considering the above-mentioned optimization in comparison to the na¨ıve rearrangement procedure. Results also show that gene trees modified by such NNI rearrangements are closer to the correct (simulated) trees and lead to more correct event predictions on average. The program is available at http://www.atgc-montpellier.fr/ Mowgli/
1
Introduction
A phylogenetic tree or phylogeny is a tree depicting evolutionary relationships among biological entities that are believed to have a common ancestor. A gene family is a group of genes descended from a common ancestor that retains simi-lar sequences and often simisimi-lar functions. A species tree depicts the evolutionary history of a group of species, whereas a gene tree depicts the evolutionary his-tory of a gene family. Gene trees and species tree are often inconsistent due to family-specific evolutionary events such as gene duplications, gene losses, hori-zontal gene transfers. By comparing gene trees with a species tree, reconciliation methods try to recover those major evolutionary events. Reconciliation is indeed the process of constructing a mapping between a gene tree and a species tree to explain their differences and similitudes with evolutionary events such as spe-ciation (S), duplication (D), loss (L), and horizontal gene transfer (T) events. Reconciliations are most often inferred on the basis of a parsimony criterion: a cost is given to each event type, the cost of a reconciliation is the sum of the costs of the individual events it uses, and a reconciliation of minimum total cost is sought for. This computational problem is often called Most Parsimo-nious Reconciliation, or MPR in short, and many works have been devoted to it recently [1,2,3,4,5,6,7].
B. Raphael and J. Tang (Eds.): WABI 2012, LNBI 7534, pp. 123–134, 2012. c
The first proposed models focused on reconciliations involving only dupli-cations and losses (the DL model) [8,9,10] or only horizontal transfers and losses [11]. Probabilistic methods have also been developed for the DL model, such as that of Arvestad et al. [12] (see Doyon et al. [13] for a review). Most recent works using a parsimony approach have been devoted to models incorpo-rating duplications, losses and transfers all together (the DTL model) [1,2,4,6], which is necessary to handle prokaryotes. When accounting for transfer events, the history proposed by a reconciliation is consistent if, for any transfer, the donor and receiver species co-exist. Ensuring such a time consistency is diffi-cult and leads to an NP-hard problem in the general case [14,5]. However, in the case divergence dates are available for nodes of the species tree, the prob-lem becomes amenable [15,4]. The difficulty to handle transfers has led to a split within proposed DTL methods, namely those that ensure time-consistency [15,4] and those that don’t [1,5,7]. The fastest algorithm for the later category runs in O(mn log n) where m and n are the sizes of the gene and species trees respec-tively [7], while the fastest time-consistent algorithm runs in O(mn2) [4].
A major problem, when applying reconciliation methods, is that parts of the gene trees can be incorrect. This leads reconciliation methods to overestimate (S), (D), (L) and (T) events [16,17]. Errors within the gene tree can be due to sequence alignment problems or phylogenetic reconstruction artifacts such as long branch attraction. Such errors are well-known in phylogenetics and several support measures, such as bootstrap values or bayesian posterior probabilities, have been proposed to detect unreliable edges in a gene tree. Up to now, very few works have solved the reconciliation problem in the presence of unsupported edges, and most of them consider only the DL model [18,19,16,20,21]. Durand et al. proposed an exponential exact algorithm to find the best rearrangement of a gene tree while preserving its strongly supported edges [16]. Some approaches collapse unsupported edges, leading to the creation of nodes with more than two children, called polytomies [18,19,20]. They then rely on a generalization of the least common ancestor mapping (LCA) to avoid the need for examining all possi-ble binary rearrangements of the polytomies. In this way, Chang et al. [19], resp. Vernot et al. [20], proposed polynomial time algorithms when considering non-binary gene trees, resp. species trees. Berglund et al. proved that when dealing with species and gene tree that are both non-binary, the problem becomes NP-complete [18]. They thus proposed a heuristic approach tackling a variant of the MPR problem where duplications and losses are optimized separately. Durand et al. used Nearest Neighbor Interchange (NNI) edit operations to rearrange the local topology of the gene tree in the regions of low supports but, unlike Berglund et al., they optimized simultaneously duplications and losses. Chaudhary et al. investigated Subtree Prune and Regraft (SPR) and Tree Bisection and recon-nection (TBR) edit operations to search for the gene tree rearrangement that minimizes the number of duplications, regardless of losses and transfers [21].
Due to transfer events, the LCA mapping can not be transposed to the DTL model and it seems hard to have an exact polynomial time algorithm for the MPR problem under this model even when the polytomies are present only in
the gene tree or in the species tree. Following the works of Berglund et al. and Durand et al. for the DL model, we propose a heuristic method relying on NNI edit operations to search for a gene tree rearrangement that minimizes the cost of reconciliation to a fixed binary species tree, but in the context of the more complex DTL model. The resulting dynamic program, called MowgliNNI, is a generalization of Mowgli [4] a program initially developed for fixed binary gene trees. Experiments on simulated data show that MowgliNNI provides betterD, T, L, S prediction while improving gene tree inference, i.e. the modified gene tree is closer to the true evolutionary history of the gene family. Experiments on real data show a significant decrease in number of events and in the number of most parsimonious reconciliations.
2
Preliminaries
Trees considered in this paper are rooted and only labeled at their leaves, each leaf being labeled with the name of a studied species. Given a tree T , its nodes, edges, leaves and root are resp. denoted V (T ), E(T ), L(T ) and r(T ). The label of a leaf u of T is denoted byL(u) and the set of labels of leaves of T is denoted byL (T ). When a node u has two children, they are denoted u1 and u2. Given
two nodes u and v of T , u≤T v (resp. u <T v) if and only if v is on the unique
path from u to r(T ) (resp. and u"= v); if neither u <T v nor v <T u then u and
v are said to be incomparable. As we consider rooted trees T only, we adopt the convention than an edge denoted (u, v) means that v <T u. For a node u of T ,
Tudenotes the subtree of T rooted at u, upthe parent node of u, while (up, u) is
the parent edge of u. A tree T" is a refinement of a tree T if T can be obtained from T" by collapsing some edges in T", i.e. by merging the two extremities of these edges [22].
A species tree is a rooted binary tree depicting the evolutionary relationships of ancestral (internal nodes) species leading to a set of extant (leaf) species. A species tree S is considered here to be dated, that is associated to a time function θ : V (S)→ R+such that y <
Sx implies that θ(y) < θ(x). Such times are usually
estimated on the basis of molecular sequences [23] and fossil records. Note that to ensure the time consistency of inferred transfers, absolute dates are not required, the important information being the ordering of the nodes of S induced by the dating. Given a dated binary species tree S, the reconciliation model we rely on considers a variant of S called a subdivision and denoted S" (as done also
in [24,3,4]). The subdivision S" is constructed from S as follows: for each node
x∈ V (S) \ L(S) and each edge (yp, y)∈ E(S) s.t. θS(yp) > θS(x) > θS(y), an
artificial node w is inserted along the edge (yp, y) in S", with θS"!(w) = θS(x).
A gene tree is a rooted binary tree explaining the evolutionary history of a gene family, that lead to a set of homologous sequences observed in current organisms. Each leaf of a species tree has a unique label, corresponding to a specific extant sequence of the gene. Though, several leaves of a gene tree can be associated to a same species due to duplication and transfert events. We denote by s(u) the species associated to leaf u∈ V (G). Each edge (u, v) of E(G) can be uniquely identified by the subsetL(Tv)⊆ L(G). A gene tree G with supports is
a gene tree whose internal edges have a support value. Let wkt(G)⊆ E(G) be
the set of edges having a support value weaker than threshold t and let strt(G)
be E(G)− wkt(G), that is the edges having a support equal or stronger than t.
Finding the Most Parsimonious Reconciliation. Reconciling a (binary) gene tree G with a species tree S means building a mapping α that associates each gene u ∈ V (G) to a sequence α(u) of nodes in the subdivision S". The
α(u) sequence models the evolution of gene u along S" with the following atomic
events: (C) contemporary gene, (S) speciation, (D) duplication, (T) transfer, (SL) speciation followed by a loss, (TL) transfer followed by a loss for the donor, and (∅) going from an artificial node of S" to its only child. Observe that each loss is coupled with either a speciation (SL) or a transfer (TL). Indeed, any most parsimonious reconciliation only needs to use a loss when it meets a speciation node of S"where G goes into only one descending edge, or when leaving an edge due to a transfer, with no part of G remaining in the donor edge. For more details, we refer the reader to Definition 3 of Doyon et al. [4] that we follow for reconciliation, except that the mapping α considered here concerns nodes instead of branches.
The cost of a reconciliation α is denoted cost(α) = dδ + tτ + lλ, where δ, τ , and λ respectively denote the cost ofD, T, and L events, and d, t, and l denote the number of the corresponding events in α. Moreover, aTL event is atomic and costs (τ + λ) and aSL costs λ. The optimal reconciliation cost is denoted C(G, S") = min{cost(α) : α is a reconciliation between G and S"}.
The optimal cost for mapping a node u of G on a vertex x of S" is defined
according to the minimal cost among the events C, S, D, T, ∅, and SL, to-gether with the cost of aTL event, which are denoted cTL(u, x) and cTL(u, x), respectively (see Definition 1 below). This directly follows from the dynamic programming algorithm that computes the optimal cost C(G, S"), where the computation of the cost for a TL event follows that of the other six atomic events, since aTL event is followed by a C, S, D, T, ∅, or SL event [4].
To ensure time consistency ofT and TL events, the donor x ∈ V (S") and the
receiver y∈ V (S") have to be located at the same time slice h(x) = h(y) of S"
(the term time slice of a vertex refers to its height in S").
These intricated notions are formally detailled in definitions 1 and 2. Though, these definitions depend on one another, there is no circularity as either we progress in the gene tree or we switch from aTL event to a non-TL event. Definition 1 (Reconciliation cost matrix). Consider a gene tree G and the subdivision S" of a species tree S. Let c : V (G)× V (S") → R+ denote
the cost matrix recursively defined as follows for a node u of G and a ver-tex x of S": c
TL(u, x) = min{cE(u, x) : E ∈ {C, S, D, T, ∅, SL}} and c(u, x) =
min{cTL(u, x), cTL(u, x)}, where the costs cE(u, x) forE ∈ {C, S, D, T, ∅, SL, TL} are defined below.
– cC(u, x) = 0, if u∈ L(G), x ∈ L(S") andL(x) = s(u).
– cS(u, x) = min{c(u1, x1) + c(u2, x2), c(u1, x2) + c(u2, x1)}
– cD(u, x) = c(u1, x) + c(u2, x) + δ, if u /∈ L(G).
– cT(u, x) = min{c(u1, x) + c(u2, z), c(u1, y) + c(u2, x)} + τ
if u has two children and where z (resp. y) denotes BRT(u2, x) (resp.
BRT(u1, x)).
– c∅(u, x) = c(u, x1), if x has a single child. event)
– cSL(u, x) = min{c(u, x1), c(u, x2)} + λ, if x has two children.
– cTL(u, x) = cTL(u, y) + τ + λ, where y denotes BRTL(u, x).
If the above constraints for an eventE ∈ {C, S, D, T, ∅, SL, TL} on node u and vertex x are not respected, the corresponding cost cE(u, x) is set to∞.
Definition 2 (Best receiver). Consider a node u of G and a vertex x of S".
Let BRT(u, x) denote a vertex y of S" that minimizes c(u, y) = min{c(u, z) : z∈ Vh(x)(S") and z"= x}. Similarly, let BRTL(u, x) denote a vertex y of S" that
minimizes cTL(u, y) = min{cTL(u, z) : z∈ Vh(x)(S") and z"= x}
The value c(u, x) is the optimal cost when mapping gene node u to node x in S" or on the edge above it. The optimal cost for reconciling G with S", denoted
C(G, S"), is then min
x∈V (S!)(c(r(G), x). The algorithm of Doyon et al.[4], called
Mowgli, fills the dynamic programming cost matrix c : V (G)× V (S")→ R+ by
two embedded loops that visit all slices of S" in backward order and nodes of G in postorder. Due to an optimization in precomputing the best receiver edge for transfer events of nodes u in a given time slice, this algorithm runs in O(|S|2.
|G|) time and space.
The problem considered in this paper is the following:
Most Parsimonious Reconciliation Gene Tree (MPR-GT)
INPUT: a dated species tree S with a time function θS, a gene tree G with supports
on the same set of species, costs δ, τ , resp. λ forD, T, resp. L, and a threshold t. OUTPUT: a tree G! s.t. strt(G)⊆ E(G!) and C(G!, S!) is minimum among all such
trees.
3
Methods
We describe here a heuristic for the MPR-GT problem that relies on a hill-climbing strategy to seek a (rooted) gene tree G of minimum reconciliation cost (see Def. 1) using NNI edit operations [25].
Performing an NNI operation around an internal edge (w, v) means swapping the position of one of the two subtrees connected to v with that of the subtree connected to the sibling of v. Given an initial gene tree G and an edge (w, v) of G, two “alternative” trees can be obtained from G by performing an NNI operation around (w, v) (see Fig. 1 for an example). The hill-climbing proceeds as follows: (1) select a weak edge of G; (2) compute the reconciliation cost for the two alternative gene trees obtained by NNI on that edge; (3) if none of these trees decreases the reconciliation cost, then try another weak edge; if none of the weak edges allows to progress, then G is a local minimum and the hill climbing stops; (4) otherwise one of the alternative gene trees leads to a decrease in reconciliation cost, and the above process continues with the alternative tree of minimum reconciliation cost. MowgliNNI outputs the final binary rearrangement along
with its most parsimonious reconciliation. In the worst cases, MowgliNNI examines all unreliable edges and does not find any better binary rearrangement of the given gene tree G since the topology G is already (locally) optimal. Consider now the time complexity of MowgliNNI . Identifying the weak edges is done in O(|G|) and generating the two alternative gene trees for an NNI operation is done in constant time. Hence, the complexity bottleneck of MowgliNNI is the number of times (denoted N ) the Θ(|S|2
· |G|) Mowgli algorithm is called. Overall, the time complexity of MowgliNNI is Θ(|S|2
· |G| · N). The next section describes how we can avoid recomputing large parts of the cost matrix, and hence greatly reduce the running time of MowgliNNI .
Fig. 1. A gene tree G with a weak edge (w, v) selected for an NNI. v is connected to two subtrees Gcand Gd, while w is connected to v and to the subtree Gb. Performing
an NNI operation around (w, v) means exchanging subtree Gb with either Gc or Gd,
leading to trees G! and G” respectively.
Combinatorial Optimization.We now present results that take advantage of the way the dynamic programming matrix is computed (Def. 1) to avoid recomputing from scratch the cost matrix associated to a gene tree G!obtained by an NNI edit operation from a gene tree G. Consider the gene tree G of Figure 1, the NNI operation applied on edge (w, v) that swaps the two subtrees Gband Gc, and the resulting gene tree denoted
G!. We can observe that despite the global architecture of G and G! differs, the local
architectures of subtrees Gb, Gc, Gd, Ga0, . . . Gak remain unchanged. Hence, any cost
that differs between the matrices c : V (G)× V (S!)→ R+and c!: V (G!)× V (S!)→ R+
(see Definition 1) is located in a column (i.e. node of the gene tree) associated to an ancestor of v (including v itself). For each of those nodes, there is two cases: (i) the node belongs to the NNI edge and its two children have subtree that have been modified (e.g. nodes w and v); (ii) the node is a strict ancestor of the NNI edge (w, v) and has exactly one child with a subtree that has been modified (e.g. gk, . . . , g0). Lemma 1
below indicates which columns of the cost matrix don’t need to be recomputed. Lemma 1. Consider a gene tree G, the subdivision S! of a species tree S, an edge
(w, v) of G, and G! obtained from G by an NNI operation on (w, v). For each node z of G that is incomparable to v and for each vertex x of S!, c(z, x) = c!(z, x) holds.
Unfortunately, there is no extension of Lemma 1 to ensure that when an edge has already been unsuccessful tried for an NNI it is useless to reconsider it later, even if it is a descendant in G of the edge leading to the last successful NNI.
Algorithm 1. M owgliN N I(G, c): seek a gene tree G"of minimum reconciliation
cost, starting from a gene tree G and the precomputed matrix reconciliation cost c : V (G)× V (S")→ R+, where S" is the subdivided species tree.
1: for all edges (w, v)∈ wkt(G) do
2: For each node s of G that is not an ancestor of v, set the column c!(s,·) to c(s, ·). 3: For each vertex x of S!, recompute the cost c!(v, x) according to Def. 1. 4: for all strict ancestors s of v according to a bottom-up traversal of G do 5: For each vertex x of S!, recompute the cost c!(s, x) according to Def. 1. 6: If c(s, x)≤ c!(s, x) holds for each vertex x of S!, then examine the next edge
of loop at line 1{the NNI rearrangement tree G! is refused}.
7: end for
8: Return M owgliN N I(G!, c!){The rearranged tree G! is accepted}.
9: end for
10: Return G{No successful rearrangement of G}
Theorem 1. Consider a gene tree G, the subdivision S! of a species tree S, an edge
(w, v) of G, a gene tree G! obtained by an NNI operation on (w, v), and any strict ancestor u of w in G where the unique child of u that is an ancestor of w is u1 w.l.o.g.
(i.e. w≤ u1 in both G and G’). If c(u1, x)≤ c!(u1, x) holds for all x∈ V (S!), then (1)
c(u, x)≤ c!(u, x) holds for all x∈ V (S!); and (2) C(G, S!)≤ C(G!, S!).
Computing the cost matrix c! : V (G!) → V (S!) given c : V (G) → V (S!) is then
achieved in worst-case time O(|S!| · h(G)), where h(G) is the height of G.
Theorem 2. MowgliNNI has worst case running time O(|S|2
· |G| + |S|2
· h(G) · N). Indeed the steps of Algorithm 1 can be described as follows: initializing the reconcilia-tion matrix for the initial gene tree is done in O(|S|2
· |G|) time; updating the matrix for each NNI now only costs O(|S!| · h(G)) = O(|S|2
· h(G)).
In MowgliNNI ’s na¨ıve implementation each rearrangement requires to recompute the cost associated to each and every node of the gene tree. In contrast, in the opti-mized version, an NNI around edge (w, v) is examined after updating only those costs associated to ancestral nodes of w. This has no impact on the worst case complexity (when the gene tree is a caterpillar h(G) is in O(|G|)) but significantly reduces the running times in practice since in most cases the number of nodes in G is much larger than their average height. For some random tree models the average height of a node in an n-leaf tree is indeed proportional to log(n) [26,29].
4
Experimental Evaluation
4.1 Experiments on Simulated Datasets
The phylogeny of 37 proteobacteria proposed by David and Alm [6] was used as a reference species tree. Along this tree, we simulated the evolutionary histories (denoted RT rue) of 985 gene families (GT rue), containing 10 to 100 genes, according to the birth
and death process [27]. The initial gene trees (GM L) were inferred from the simulated
[4] and Ranger-dtl-D [7] were used to infer the most parsimonious evolutionary history (RM L) between the initial gene tree and the reference species tree. Then, MowgliNNI
was used to search for an alternative gene tree topology (GNNI) of lower reconciliation
cost, along with its most parsimonious evolutionary history (RNNI). The cost of each
D, T, L event considered in reconciliations was computed as follows:
CostE=
log(|DRT rue|+|TRT rue|+|LRT rue|
|ERT rue| ) if|ERT rue| &= 0
log(|DRT rue|+|TRT rue0.1 |+|LRT rue|) otherwise
(1)
whereERT rue (withE beeing D, T or L) stands for the true events of this type.
We explored the ability of MowgliNNI to improve the set of GM L trees using six
different bootstrap values as threshold for defining weak edges, i.e. 20, 40, 60, 80, 90, and 95. The GM L trees were inferred from relatively long sequences, they thus
contained a large proportion of high bootstrap values, e.g. more than 65% edges had a bootstrap value≥ 80. Though this left only a moderate number of edges in each gene tree to be considered by MowgliNNI for rearrangement, the method was still able to improve their quality (see below).
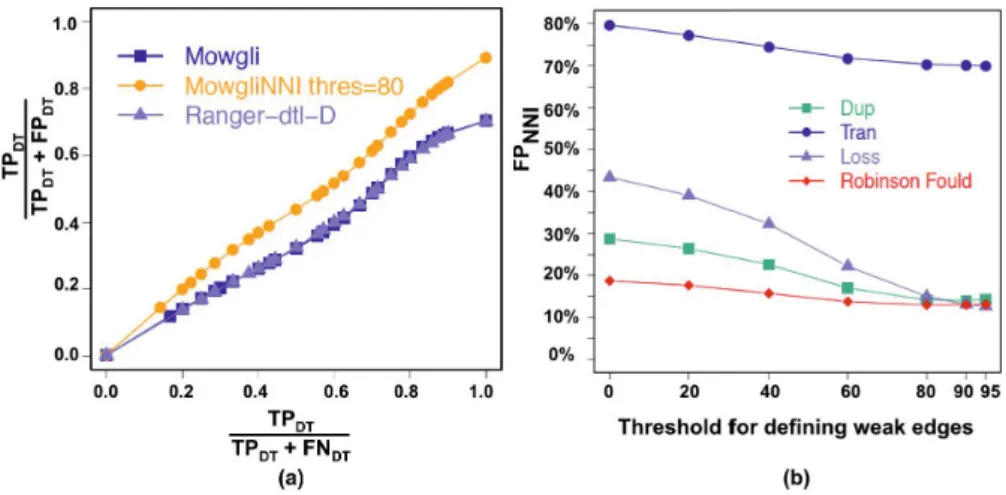
Mowgli and Ranger-dtl-D showed a similar accuracy in inferring duplications and transfers (Fig. 2(a)), though Ranger-dtl-D proposed reconciliations with higher costs in 13% of the cases. As moreover the Ranger-dtl-D software does not provide the mapping of loss events, below we mainly compare the events inferred by MowgliNNI with those inferred by Mowgli and those of RT rue.
Table 1 reports the accuracy of the GM Land GNNI trees. The number of families
considered for improvement logically increases as the threshold for identifying an edge as weak increases (row 2 of Table 1). Even though bootstrap values in the initial gene trees are high on average, a large number of the 985 processed families are still subject to possible improvements, as for threshold 20, already 43% of the families are concerned, and this goes up to 99% of the families at threshold 95. The first conclusion is that
Table 1. Quality of the gene trees and reconciliations inferred by MowgliNNI . For each tested threshold value, the second row indicates the number of gene families containing some weak edges (among the 985 simulated gene families). Third row in-dicates the percentage of these families where MowgliNNI proposes a modified tree of lower reconciliation cost. The last six rows provide the percentage of the for-mer families where MowgliNNI provides modified gene trees (resp. reconciliations) that are closer, equally far or farther from the true gene trees (resp. the true evolu-tions). RF (GT rue, GX) denotes the Robinson Fould distance between GT rue and GX,
ED(RT rue, RX) =|RT rue− RX| + |RX− RT rue|, where X stands for NNI or ML.
Threshold 20 40 60 80 90 95
Number of gene families containing weak edges 422 708 911 965 979 981 % of cases where Cost(S, GNNI) < Cost(S, GM L) 79 81 85 88 88 89
% of cases where RF (GT rue, GNNI) < RF (GT rue, GM L) 38 55 66 71 70 69
% of cases where RF (GT rue, GNNI) = RF (GT rue, GM L) 59 40 28 21 21 21
% of cases where RF (GT rue, GNNI) > RF (GT rue, GM L) 3 5 6 8 9 10
% of cases where ED(RT rue, RNNI) < ED(RT rue, RM L) 59 70 75 79 79 78
% of cases where ED(RT rue, RNNI) = ED(RT rue, RM L) 27 23 19 15 16 15
there is a large number of cases where MowgliNNI can propose a modified gene tree. The percentage of cases where it actually did is provided in row 3 of Table 1, showing e.g. that at threshold 80, MowgliNNI proposed a new gene tree in 88% of the cases (853 cases over 965). Even for the lowest considered threshold of 20, a new gene tree is obtained for 79% of the families having weak edges, representing more than a third of the initial 985 families. These modified gene trees (GNNI) represent an improvement
over the initial trees (GM L) since they are in most cases closer to the true gene trees
(rows 4, 5, 6) and allow to obtain better reconciliations (rows 7, 8, 9). For instance at threshold 80, GNNI is better in 71% of the cases, and worse in only 8%. Similarly,
the reconciliation is better in 79% of the cases, and worse in only 6%. The higher the threshold value, the more edges are considered for NNI moves by MowgliNNI . Up to a certain point, broadening the search space of MowgliNNI allows to improve both the gene trees and the reconciliations. Yet, for threshold greater than 80, MowgliNNI ’s performance starts to decrease due to the fact that the sequence signal is no longer sufficiently taken into account.
MowgliNNI progressively reduced the number of predicted duplications, transfers and losses as the threshold increased. At threshold 0 (where MowgliNNI = Mowgli ), 5403 duplications, 2460 transfers and 12007 losses were predicted on the whole dataset; going to threshold 80, these numbers drop to 4510 duplications, 1160 transfers and 8016 losses, i.e. values that are much closer to the 4443 duplications and 8142 losses contained in the true reconciliations.
The average number of false positive events (FP) of the RNNI reconciliations
de-creases as the threshold inde-creases (Fig. 2(b)). However, as in Doyon et al. [4], the average number of FP transfers is quite high compared to that of duplications and losses. This can be explained by several reasons. First, a transfer is judged incorrect as soon as i) it does not depart or end in the same edges of the species tree as the
Fig. 2. (a) The accuracy of Mowgli , Ranger-dtl-D and MowgliNNI (threshold=80) in inferring duplications and transfers, where T PDT (resp. F PDT, F NDT) denotes the
true positive (resp. false positive, false negative) of duplications and transfers predicted. (b) Average false positive (FP) of the NNI trees – note that FP values at threshold 0 correspond to Mowgli results.
corresponding true transfer, or ii) it does not concern the same edge in the gene tree. Overall, there is an additional constraint w.r.t. duplications and loss events, leading on average to more incorrect events. This point is all the more sensitive that several most parsimonious reconciliations (MPR) are obtained in a number of cases, while we just accounted for one of them for each gene family. Hence, event error rates we report are pessimistic (note that this does not affect RF distance results). Last, incorrect gene trees lead to incorrect event inferences, but the latter are very sensitive to only small errors in gene trees. The event FP error grows exponentially when the RF distance between the initial and the true tree increases from 0 to 10% (data not shown).
Inferring GM Ltrees from shorter sequences (400 bp), led to a decrease in their quality
both in terms of RF distance to GT rueand in event distance between inferred and true
reconciliation. Starting from a less accurate gene tree, the accuracy of the NNI trees and of their evolutionary histories is also lowered, though the relative improvement provided by MowgliNNI over Mowgli is higher than with long sequences (data not shown).
In order to measure the dependance of MowgliNNI on the precise costs used for each kind of event, we ran the method on GM L trees with costs varying up to 10%, 20%,
then 50% w.r.t. those computed from Formula (1). The paired t-test for RF distances shows that the GNNI trees obtained with the new costs are not significantly different
from those obtained with the former costs (p-value=0.296, 0.2723, 0.2028 respectively). The accuracy of inferred events also does not change much. Transfers have the highest variation with 3.6% (resp. 3%) increase in FP (resp. FN) when the event costs vary up to 50%. Thus, MowgliNNI is quite robust to changes in the event costs.
In summary, MowgliNNI successfully uses the reconciliation cost as additional in-formation to resolve the uncertain parts of gene trees inferred from sequences only. Though the gene tree resolutions are partly guided by reconciliations with the species tree, they are not attracted away from the true gene trees, but are closer to them than the initial gene trees. As a result, MowgliNNI infers gene events more accurately, which is of prior importance to distinguish orthologs from paralogs and xenologs [13].
4.2 Experiments on Real Data
We constructed a dataset of≈ 30000 homologous gene families (3 to 312 taxa) on Bac-teria from the HOGENOM database (release 04) [30] and ran Mowgli and MowgliNNI on this dataset with fixed parameters (τ = 3, δ = 3.5, λ = 1).
MowgliNNI allows to change the gene tree, hence to lower the reconciliation cost, in 24% of the≈ 30000 families. This gain is non-negligible and is uttermost important as changing the gene tree topology has an important impact on the inferred events (as shown on the simulated data sets and below) that are used in turn to predict the function of genes on the basis of ortholog and paralog relationships. When allowing rearrangements on weak edges under the DL model, Berglund-Sonnhammer et al. re-ported that 10% of their families were improved [18], while Chaudhary el al. improved all their gene trees in a pure D model when rearranging gene trees with Subtree Prune and Regraft (SPR) operations [21]. However, it is hard to know whether the datasets are comparable.
For all gene families, we counted the number of events of each kind (D, T, L) inferred by Mowgli and MowgliNNI . As a rule, MowgliNNI led to a decrease in the number of events in inferred evolutionary histories, the reduction being considerable for trans-fers and losses (88.3% and 59.9% resp.) but quite small for duplications (5.2%). These results obtained in the DTL model are consistent with those of Durand et al. report-ing that in the DL model gene tree rearrangements substantially reduce the number
of events needed to explain the data [16]. The differences in reductions we observed depending on the kind of events can be explained by the fact that given the costs we used for the events (τ = 3, δ = 3.5, λ = 1), it is usually more parsimonious to explain the conflicts between gene and species tree by a combination ofT and L rather than a combination ofD, and L. Thus, when MowgliNNI infers a gene tree closer to the species tree, it mostly removes the need for artificial transfers (and losses to a lesser extent), while not altering that much the number of duplications.
In addition to reductions in errors and number of events, the new gene tree proposed by MowgliNNI usually reduced the number of alternative MPRs, i.e. histories. On a random sample of two dozens new gene trees, the number of MPRs is reduced in 63% of the cases (by a factor of 18 in the best case), and increased in 21% (by a factor 3 at worst). This echoes similar findings of Durand et al. in a DL model [16].
We measured the running time of Mowgli and of both the non-optimized and opti-mized versions of MowgliNNI (see Methods) on a random sample of 100 families having from 10 to 80 taxa. The results show that the optimized version of MowgliNNI is 20 (resp. 50 and 80) times faster than the non-optimized one, when facing 1-20 (resp. 20-40 and 40-60) weak edges. The increase in accuracy due to MowgliNNI is obtained at the price of a small computation time overcost.
Acknowledgement. We thank Gergely J. Sz¨oll˝osi for his help in determining the event costs of the real dataset and the referees that helped strengthen the experimen-tal validation. This work was funded by the Languedoc-Roussillon Chercheur d’Avenir program and by the french Agence Nationale de la Recherche, programmes Domaines Emergents (ANR-08-EMER-011 Phylariane ), 6`eme Extinction (ANR-09-PEXT-000 PhyloSpace) and Investissements d’avenir / Bioinformatique (ANR-10-BINF-01-02, Ancestrome).
References
1. Hallett, M., Lagergren, J., Tofigh, A.: Simultaneous identification of duplications and lateral transfers. In: RECOMB 2004, pp. 347–356. ACM, New York (2004) 2. G´orecki, P.: Reconciliation problems for duplication, loss and horizontal gene
trans-fer. In: Bourne, P.E., Gusfield, D. (eds.) RECOMB, pp. 316–325. ACM (2004) 3. Conow, C., Fielder, D., Ovadia, Y., Libeskind-Hadas, R.: Jane: a new tool for the
cophylogeny reconstruction problem. Algorithms Mol. Biol. 5, 16 (2010)
4. Doyon, J.-P., Scornavacca, C., Gorbunov, K.Y., Sz¨oll˝osi, G.J., Ranwez, V., Berry, V.: An Efficient Algorithm for Gene/Species Trees Parsimonious Reconciliation with Losses, Duplications and Transfers. In: Tannier, E. (ed.) RECOMB-CG 2010. LNCS, vol. 6398, pp. 93–108. Springer, Heidelberg (2010)
5. Tofigh, A., Hallett, M., Lagergren, J.: Simultaneous identification of duplications and lateral gene transfers. IEEE/ACM TCBB 8(2), 517–535 (2011)
6. David, L.A., Alm, E.J.: Rapid evolutionary innovation during an archaean genetic expansion. Nature 469(7328), 93–96 (2011)
7. Bansal, M.S., Alm, E.J., Kellis, M.: Efficient algorithms for the reconciliation prob-lem with gene duplication, horizontal transfer, and loss. In: Proceeding ISBM 2012 (2012)
8. Goodman, M., Czelusniak, J., Moore, G.W., Herrera, R.A., Matsuda, G.: Fitting the gene lineage into its species lineage, a parsimony strategy illustrated by clado-grams constructed from globin sequences. Syst. Zool. 28, 132–163 (1979)
9. Page, R.D.: Extracting species trees from complex gene trees: reconciled trees and vertebrate phylogeny. Mol. Phylogenet. Evol. 14, 89–106 (2000)
10. Ma, B., Li, M., Zhang, L.: From gene trees to species trees. SIAM Journal on Computing 30(3), 729–752 (2001)
11. Nakhleh, L., Warnow, T., Linder, C.R.: Reconstructing reticulate evolution in species: theory and practice. In: Proceedings of the Eighth Annual International Conference on Research in Computational Molecular Biology, RECOMB 2004, pp. 337–346. ACM, New York (2004)
12. Arvestad, L., Lagergren, J., Sennblad, B.: The gene evolution model and computing its associated probabilities. J. ACM 56(2) (2009)
13. Doyon, J.-P., Ranwez, V., Daubin, V., Berry, V.: Models, algorithms and programs for phylogeny reconciliation. Brief Bioinform. 12(5), 392–400 (2011)
14. Ovadia, Y., Fielder, D., Conow, C., Libeskind-Hadas, R.: The co phylogeny recon-struction problem is NP-complete. J. Comput. Biol. 18(1), 59–65 (2011)
15. Libeskind-Hadas, R., Charleston, M.A.: On the computational complexity of the reticulate cophylogeny reconstruction problem. JCB 16(1), 105–117 (2009) 16. Durand, D., Halldorsson, B.V., Vernot, B.: A hybrid micro-macroevolutionary
ap-proach to gene tree reconstruction. J. Comput. Biol. 13(2), 320–335 (2006) 17. Hahn, M.W.: Bias in phylogenetic tree reconciliation methods: implications for
vertebrate genome evolution. Genome Biology 8(R141) (2007)
18. Berglund-Sonnhammer, A.C., Steffansson, P., Betts, M.J., Liberles, D.A.: Optimal gene trees from sequences and species trees using a soft interpretation of parsimony. J. Mol. Evol. 63(2), 240–250 (2006)
19. Chang, W.-C., Eulenstein, O.: Reconciling Gene Trees with Apparent Polytomies. In: Chen, D.Z., Lee, D.T. (eds.) COCOON 2006. LNCS, vol. 4112, pp. 235–244. Springer, Heidelberg (2006)
20. Vernot, B., Stolzer, M., Goldman, A., Durand, D.: Reconciliation with non-binary species trees. J. Comput. Biol. 15, 981–1006 (2008)
21. Chaudhary, R., Burleigh, J.G., Eulenstein, O.: Algorithms for Rapid Error Cor-rection for the Gene Duplication Problem. In: Chen, J., Wang, J., Zelikovsky, A. (eds.) ISBRA 2011. LNCS, vol. 6674, pp. 227–239. Springer, Heidelberg (2011) 22. Semple, C., Steel, M.A.: Phylogenetics. Oxford Lecture Series in Mathematics and
its Applications, vol. 24. Oxford University Press (2003)
23. Sanderson, M.J.: Inferring absolute rates of evolution and divergence times in the absence of a molecular clock. Bioinformatics 19, 301–302 (2003)
24. Tofigh, A.: Using Trees to Capture Reticulate Evolution, Lateral Gene Transfers and Cancer Progression. PhD thesis, KTH Royal Institute of Technology, Sweden (2009)
25. Felsenstein, J.: Inferring phylogenies. Sinauer Associates, Inc. (2004)
26. Knuth, D.E.: The Art of Computer Programmingm, Sorting and Searching, vol. 3. Addison-Wesley (1973)
27. Kendall, D.G.: On the generalized birth-and-death process. Ann. Math. Stat. 19, 1–15 (1948)
28. Stamatakis, A.: Raxml-vi-hpc: maximum likelihood-based phylogenetic analyses with thousands of taxa and mixed models. Bioinformatics 22(21), 2688–2690 (2006) 29. Robinson, D.F., Foulds, L.R.: Comparison of phylogenetic trees. Mathematical
Biosciences 53, 131–147 (1981)
30. Penel, S., Arigon, A.M., Dufayard, J.F., Sertier, A.S., Daubin, V., Duret, L., Gouy, M., Perriere, G.: Databases of homologous gene families for comparative genomics. BMC Bioinformatics 10(suppl. 6), 3 (2009)