HAL Id: insu-03111998
https://hal-insu.archives-ouvertes.fr/insu-03111998
Submitted on 16 Jan 2021
HAL is a multi-disciplinary open access
archive for the deposit and dissemination of
sci-entific research documents, whether they are
pub-lished or not. The documents may come from
teaching and research institutions in France or
abroad, or from public or private research centers.
L’archive ouverte pluridisciplinaire HAL, est
destinée au dépôt et à la diffusion de documents
scientifiques de niveau recherche, publiés ou non,
émanant des établissements d’enseignement et de
recherche français ou étrangers, des laboratoires
publics ou privés.
Density and temperature profiles obtained by lidar
between 35 and 70 km
Alain Hauchecorne, Marie-Lise Chanin
To cite this version:
Alain Hauchecorne, Marie-Lise Chanin. Density and temperature profiles obtained by lidar between
35 and 70 km. Geophysical Research Letters, American Geophysical Union, 1980, 7 (8), pp.565-568.
�10.1029/GL007i008p00565�. �insu-03111998�
GEOPHYSICAL RESEARCH LETTERS, VOL. 7, NO. 8, PAGES 565-568, AUGUST 1980
DENSITY AND TEMPERATURE PROFILES OBTAINED BY LIDAR BETWEEN 35 AND 70 KM Alain Hauchecorne and Marie-Lise Chanin
Service d'A•ronomie du CNRS, 91370, Verri•res-le-Buisson, France
Abstract. A lidar system based at the Haute-
Provence O---•servatory
(44øN, 6øE) has been used
to obtain night-time density and temperature profiles in the altitude range 35-70 km. If the
lidar results are normalized to an in-situ
rocket sounding from 35 to 40 kin, the lidar and rocket profiles are in quite good agreement up to about 50 km. Differences are sometimes noted
around 55 km, and these could possibly be caused by an aerosol layer.
Introduction
Light scattered from a laser beam has been observed up to IOO km for quite a number of years (Mc Cormick et al., 1967 ; Sandford,
1967 ; Kent and Wright, 1970) with the purpose of measuring atmospheric densities. An extensive
study of mesospheric density was carried out
between 70 and IOO km and indicated the exis-
tence of tidal modes (Kent and Keenliside, 1975).
This paper describes the dens{ty and tempera-
ture results obtained from a ground based lidar between 35 and 70 km and presents a comparison with in-situ rocket sounding measurements. The good agreement between both .types of results shows promise that ground lidar technique can provide these types of data with high resolution
and accuracy.
Method
The light of a laser pulse sent vertically
into the atmosphere is backscattered by the air
molecules and by the aerosols. The altitude range of the measurements is divided by the
height range of the collection gate into n layers of thickness Az. The measured signal backscattered in the i th altitude layer
(z i - Az/2, z i + Az/2) is then given by the
lidar equation :
N(zi) =
NoAK
T2(zo, zi)
,
4• (z i - Zo) 2
Inr(zi)Sr + nm(Zi)•n[aZ(])
where No is the number of emitted photons,
nr(Zi) and nm(zi) the air molecules and aerosols concentrations, 8r and Bm the Rayleigh and Mie backscattering cross-sections, Zo the altitude of the lidar site, A the telescope area,
T2(zo,Zi) the atmospheric
transmission, K the
optical efficiency of the lidar system. The scat- tering ratio defined as :
nr(zi) 8r + nm(zi) 8m
R(zi) ...
(2)
nr(Zi) 8r
is used to estimate the contribution of the Mie
diffusion in the backscattered signal N(zi).
Copyright
1980
by the American
Geophysical
Union.
Paper number 80L0580.0094-8276/80/0080L-0380501.00
565
Earlier lidar measurements at k = 694.3 nm
(Mc Cormick et al., 1978 ; Russel and Hake, 1977) have shown that the scattering ratio tends to-
wards unity at 35 km. The wavelengths used in
this study (k = 590 nm, % -- 670 nm), chosen for
the detection of sodium and lithium atoms above 80 km, lead to somewhat smaller values of the
scattering ratio. We will initially assume that the scattering ratio is unity from 35 to 80 kin, and later discuss the possible existence of an aerosol layer in this altitude range.
The atmospheric transmission term T2(zo,zi),
taking into account ozone absorption and mole- cular extinction, is assumed to be constant bet- ween 35 and 80 km with an accuracy of 0.4%. But uncertainties on the atmospheric transmission from the ground to 35 km, the laser flux and the optical efficiency of the lidar system prevent the measurement of the absolute density. Normali- zation of the density data have to be made either using a model, or other experimental data. The density profiles are normalized from 35 to 40 km using an absolute profile obtained either from a model (CIRA, 1972) or experimentally. The rela- tive uncertainty on the density profile is assumed to be equal to the statistical standard
error :
dp(z
i) / p(z i) --IN(zi) + Nml / N(z i)
(3)
where p(zi) and dp(zi) are respectively the at-
mospheric density and its standard deviation in
the i th altitude layer and N
m the background
noise.
The temperature profile is computed from the density profile assuming that the atmosphere obeys the perfect gas law and is in hydrostatic equilibrium. This second assumption •mplies that
atmospheric turbulence does not affect the mean
air density, which is the case considering the temporal and spatial resolutions of the lidar data. The constant mixing ratio of the major at- mospheric constituents (N2, 02 and At) and the
negligible value of the H20 mixing ratio justify the choice of a constant value M for the air mean molecular weight. The air pressure P(z),
density (z) and temperature T(z) are then
related by :
P(z) = RP(Z) T(z)
M(4)
dP(z) =- p(z) g(z) dz
(5)
where R is the universal gas constant and g(z) the acceleration of gravity. The combination of
Eq. 4 and Eq. 5 leads to : dP(z) M g(z)
P(Z)' = - R T(z)
dz = d(Log
P(z))
(6)If the acceleration of gravity and the tempe-
rature are assumed
to be constant in the i th
layer, the pressure at the bottom and top of the566 Hauchecorne and Chanin' Profiles Obtained by Lidar
TABLE I. Characteristics of the lidar system
Emitter :
Measured alkali Sodium Lithium Energy per pulse 1 J 0.8 J Wavelength 590 nm 670 nm
Linewidth 8 pm 6 pm
Beam
divergence
1.10
-3 rad
1.10
-3 rad
Divergence after 1.10 -4 rad 1.10 -4 rad
collimation Pulse duration 4 Us 3.5 Us Repetition rate 0.5 Hz 1 Hz Receiver :
Telescope area
0.5 m
2
Beamwidth 5.10 -4 rad Linewidth 0.5 nmlayer are related by :
P(z i - Az/2)
M g(z i)
P(zi + Az/2) = exp R T(z i)
Az (7)and the temperature is expressed as : M g(z i) Az
•(zi) =
,
(8)
R Log I P(zi- Az/2) / P(zi + Az/2) I
The density profile is measured
up to the n th
layer (about 80 km). The pressure at the top of this layer is fitted with the pressure of the CIRA 1972 model Pm(zn + Az/2) for the corres- ponding month and latitude. The top and bottom
pressures of the ith layer are then :
(9)
P(zi + Az/2) = Z
n
0(zj)g(zj)Az + Pm(zn+Az/2)
j=i+l
P(z i - Az/2) = P(z i + Az/2) + 0(z i) g(z i) Az (10)
Let X be :
O(zi) g(z i) Az
X =-p-(z
i + Az/2)
(11)The temperature is then : M g(z i) Az
T(zi) = R Log
(1 + X)
(12)
The statistical standard error on the tempe- rature is :
aT (zi) • Log I1 + X I
T (z i)
Log I1 + X I
•X (1 + X) Log (1 + X) (13) with •X 2 •0(zi) 0(zi) 2•P(z i + Az/2)
P(z i + Az/2) (14)•P(zi + Az/2)
2 = Z
n Ig(zj) •O(zj) Azl
2
j=i+l
+
m (Zn + Az/2)I
2
(15)The contribution of the extrapolated pressure
at 80 km Pm(Zm
+ Az/2) on the local pressure
below decreases rapidly with altitude, and its influence on the temperature determination is small below 65 km. Then the term X represents a ratio of experimental density values from
which absolute temperature can be deduced even
though the density measurements
are only
relative.
Lidar system description
The data reported here were obtained with the
lidar system set up at the Haute Provence
Observatory (43ø56'N, 5ø43'E)- This system was
developed for measurements
of atmospheric
alka-
lis (sodium and lithium) (M•gie and Blamont,1977 ; M•gie et al., 1978 ; J•gou and Chanin,
1980). The emitter part consists of two flash-pumped
dye lasers ; the light is sent vertically
through a collimator into the atmosphere.
The
receiver includes a 80 cm diameter telescope and
an analogic and photoelectron counting detection
system. Table 1 summarizes
the present charac-
teristics of the lidar system. The data are now
still limited to night-time (solar elevation < - 10ø). A rotating disk protects the photoca-
thode from overloading during the first 200
As a consequence
the backscattered signal is
only measured above 30 km.
Results
Data collected for 27 nights during the period extending from october 1978 to september
1979 have been studied. We only present in this paper the data collected during the three nights
for which in-situ temperature measurements were
available during the preceding or the following day. These were obtained by probes carried by
ARCAS type rockets launched from the Centre
d'Essai des Landes (44ø20'N, 1ø15'W). The data were recorded during the descent of the probe under a parachute. The temperature is measured with a tungsten wire and the density and pressure are inferred from this measurements
(Villain and Loiti•re, 1974). The temperature error is given as 1øC at 55 km and 2øC at 65 km.
The rocket soundings are made during daytime
and the lidar sites are 560 km distant but si- tuated at the same latitude. The wind is nearly zonal during all these experiments, and thus the
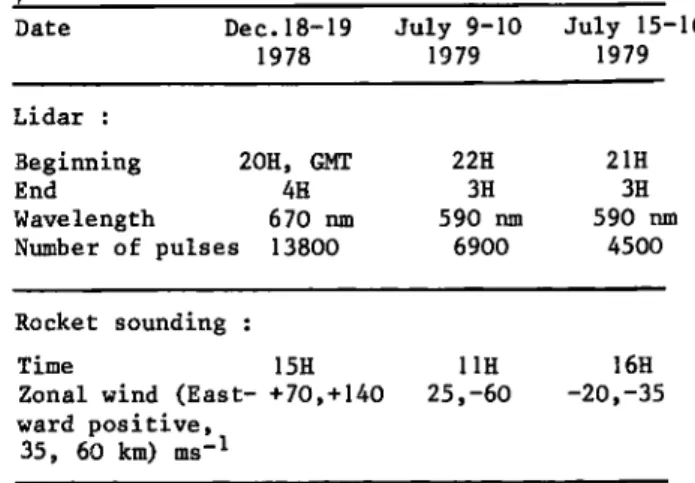
TABLE 2. Presentation of lidar and rocket data
Date Dec. 18-19 July 9-10 July 15-16
1978 1979 1979 Lidar : Beginning 2OH, GMT End 4H Wavelength 670 nm Number of pulses 13800 22H 21H 3H 3H 590 nm 590 nm 6900 4500 Rocket sounding : Time 15H 11H
Zonal wind (East- +70,+140 25,-60 ward positive,
35, 60 km) ms
-1
,
16H
Hauchecorne and Chanin' Profiles Obtained by Lidar 567 65 •o i I ß ß ß
ß
--Rock,•
1"',11.
•
ß
-- Lidor
I ,' :
Dec. 18-19 1978 ! i'
(b)
ul. 9-10 19791.•0
exp/f,
model
i i ! (c) y,Jul, m•15-16
J
,
,1979, m
1.oo 1.o5 q.lo
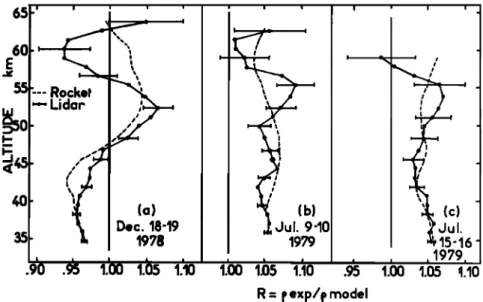
Fig. 1. Ratio of the experimental densities obtained by lidar and rocket
to the CIRA 1972 model
corresponding
to the I st of December
(a) and
the I st of July (b and c) and interpolated to 44øN. Lidar profiles are
normalized to rocket profiles between 35 and 39 kin. Horizontal bars
indicate the standard deviation of lidar results.
same air mass will be over both sites within a
few hours. The characteristics of the data to be
compared are sun•narized in Table 2.
The height resolution of the lidar and rocket
measurements are respectively 1.2 km and 0.5 kin,
and have been reduced to 4.8 km by a running
average in order to decrease the standard
deviation.
The lidar and rocket sounding densities, 0L
and 0•q, are compared
with the density of the
CIRA •972 model 0M selected for the month
of the
measurements and interpolated to 44øN. The ratios of the density measured by both methods
to the model :
RL = PL / PM, RR = PR / PM
(16)are presented on Figure I for the three compari- sons. Lidar density has been normalized to rocket results in the lower part of the profile (35-39 kin). On this figure, the vertical pro-
files of density and temperature are limited to
below the height for which the relative standard
deviation of the lidar results reaches 5%, but
the density results up to 80 km are used for the
temperature determination.
The experimental density profiles obtained by
both techniques are in quite good agreement be- low 50 km in all cases, even when the density is disturbed as in case a. An oscillation around
the model is observed by the two independ nt
technics : vertical wavelength of 20 to 10 km
can be measured in case a and b.
The lidar and rocket measured temperature are now compared with the appropriate CIRA 1972 model. In the case c the experimental difference stays within the standard deviation of the lidar data, and in general the agreement is satisfac-
tory up to 50 km. For the three examples the night-time lidar temperature is 8 to 10•C lower than the day-time rocket data at 52 - 55 kin. This difference, associated with the maxima
•E60
! -- Lidar '----Rochd ... CIRA 1972 / ,,/ /' /' (a) Dec. 18,19.1978'
i I i : i/. i : .•'• ,Jul. 9.10.1979 '•. 92•0 2•0 2•0 2•0 2•0 2•0 2•0 2•0
TEMPERATURE KFig. 2. Experimental temperature from lidar and rocket data compared with the corresponding CIRA 1972 model. Horizontal bars indicate the
568 Hauchecorne and Chanin: Profiles Obtained by Lidar
E 70
u J60 4•0 3O ß -i i o2 i , i , 4Demity accuracy Temperature accuracy
from 0.3 % at 35 km to 5 % at 66 km. The
accuracy of the inferred temperature, indepen- dent of the density normalization, varies from
0.8 ø C at 35 km to 12 ø C at 66 km. Again, these
temperature errors do not include any possible
aerosol effect.
Acknowledsments. We wish to thank C. Fehrenbach, the Director of the Haute
Provence Observatory, for his hospitality. We
are grateful to all the members of the lidar Fig. 3. Density and temperature accuracy of lidar team of the Service d'A•ronomie (CNRS) and profiles. Numbers refer to the night of the mea- particularly to J.P. Jegou, J.P. Schneider and
surement : I ; December 18-19, 1978 ; 2 ; July F. Syda who collected the data used in this 9-10, 1979 ; .3 ; July 15-16, 1979 ; 4 ; September study. The rocket sounding data have been
1-2, 1979. gracefully provided by the M•t•orologie
observed on the density around these altitudes, could also be attributed to an aerosol layer at
that level, which could increase the scattering ratio. Indications of such a layer have been
obtained earlier. (Rgssler, 1968 ; Cunnold et
al., 1973). If one assumes that the scattering ratio is 1.O5 (or 1.10) at 52-55 km and this is ignored in the density analysis, the computed
temperature would be too low by IOøC (20øC) in the aerosol layer and too high by 5øC (IOøC) at
50 km and 2øC (4øC) at 40 km.
Since obtaining the data presented in Figures I and 2, improvements involving the re- duction of the divergence and the field of view have been incorporated at the lidar station to
increase the accuracy. As an example, we present
on Figure 3 the standard error of the density and temperature measurements, for a vertical resolution of 5 km, for the 3 nights of data reported in this paper and for the data obtained on September 1, 1979 with 14 600 laser pulses at 670 nm. During that period of measurements the magnitude of the error bar has been reduced by about 25%. Such improvement in the accuracy
has increased the range of the measurements by
about 4 km : as an example, for a maximum stan- dard error of 5% in density measurement, the altitude range is now up to 66 km.
Conclusion
Lidar vertical soundings of the atmosphere are shown to allow the determination of density
and temperature of the upper stratosphere and
lower mesosphere. The comparison with rocket sounding profiles are quite satisfactory up to 50 km provided that each lidar density profile is normalized to match the corresponding rocket
profile from 35 to 40 km.
Above that level the possible presence of an aerosol layer should be cleared by using a two wavelengths lidar. In two cases, oscillations with vertical wavelengths of IO to 20 km can be observed if the density is compared to the model. These oscillations are also present in the first rocket profile. In order to obtain absolute measurements of density, a good reference is
needed for normalization in the lower part of the profile, as the density at 35 km may differ
by more than 5% from the model. If such a nor- malization is made, and if the aerosol pertur- bation is either negligible or removed, the
present characteristics of the lidar system
allow the determination of the mean density
during one night with an accuracy varying
Nationale (EERM).
This work was supported by the DRET under
contracts N ø 77-280 and 79-442.
References
CIRA 1972, Cospar International Reference Atmosphere 1972, COSPAR Committee for CILIA,
Akademie Verlag, Berlin, 450 pp. 1972.
Cunnold, D.M., C.R. Gray, and D.C. Merritt,
Stratospheric aerosol layer detection,
J. Geoph•s. Res., 78, 920-931, 1973.
Jegou, J.P., and M.L. Chanin, Lidar measurements
of atmospheric lithium, to be submitted to
Planet. Space Sci., 1980.
Kent, G.S., and W. Keenliside, Laser radar obser-
vations of the e3m,
l Diurnal atmospheric
tidal
mode above Kingston, Jamaica. J. Atmos. Sci.,
32, 1663-1666, 1975.
Kent, G.S., and R.W. Wright, A review of laser
radar measurements of atmospheric properties,
J. Atmos. Terr. Phys., 32, 917-943, 1970.
Mc Cormick, P.D., E.C. Silverberg, S.K. Poultney, U. Van Wigh, C.O. Alley, and R.T. Betringer, Optical radar detection of backscattering
from the upper atmosphere, Nature, 215, 1262- 1263, 1967.
Mc Cormick, M.P., T.J. Swiss ler, W.P. Chu, and
W.H. Fuller, Jr., Post-Volcanic aerosol
decay as measured by Lidar, J. Atmos. Sci.,
35, 1296-1303, 1978.
M•gie, G., and J.E. Blamont, Laser sounding of atmospheric sodium ; interpretation in terms of global atmospheric parameters, Planet. ,.
Space Sci., 25, IO93-1109, 1977.
M•gie, G., F. BOS, J.E. Blamont, and M.L. Chanin, Simultaneous night-time measurements of at-
mospheric sodium and potassium, Planet. Space.
Sci., 26, 27-35, 1978.
Rgssler, F., The aerosol layer in the stratos-
phere, Space.
Research
VII_I, North Holland
Publ. Co., 633-636, 1968.
Russell, P.B., and R.D. Hake, Jr., The post-
fuego stratospheric aerosol : lidar measure-
ments with radiative and thermal implications, J. Atmos. Sci., 34, 163-177, 1977.
Sandfo•d, M.C.W., Lasher
scatter measurements
in
the mesosphere and above, J. Atmosph..Terr.Phys., 29, 1657-1662, 1967.
Villain, J., and B. Loiti•re, Mesure du vent et
de la temperature de la haute atmosphSre,
La M•t•orologie, , 31-32, 1-25, 1974. {Received December 12, 1979;