HAL Id: hal-00811825
https://hal.archives-ouvertes.fr/hal-00811825
Submitted on 25 Jan 2021
HAL is a multi-disciplinary open access
archive for the deposit and dissemination of
sci-entific research documents, whether they are
pub-lished or not. The documents may come from
teaching and research institutions in France or
abroad, or from public or private research centers.
L’archive ouverte pluridisciplinaire HAL, est
destinée au dépôt et à la diffusion de documents
scientifiques de niveau recherche, publiés ou non,
émanant des établissements d’enseignement et de
recherche français ou étrangers, des laboratoires
publics ou privés.
Comparison of POLDER cloud phase retrievals to active
remote sensors measurements at the ARM SGP site
Jérôme Riédi, Philippe Goloub, R. T. Marchand
To cite this version:
Jérôme Riédi, Philippe Goloub, R. T. Marchand. Comparison of POLDER cloud phase retrievals to
active remote sensors measurements at the ARM SGP site. Geophysical Research Letters, American
Geophysical Union, 2001, 28 (11), pp.2185-2188. �10.1029/2000GL012758�. �hal-00811825�
GEOPHYSICAL RESEARCH LETTERS, VOL. 28, NO. 11, PAGES 2185-2188, JUNE 1, 2001
Comparison of POLDER
cloud phase retrievals
to active
remote
sensors
measurements
at the ARM
SGP
site.
J. Riedi, P. Goloub,
Laboratoire d'Optique Atmosph6rique, Universit6 des Sciences et Technologies de Lille, France
R. T. Marchand
The Pacific Northwest National Laboratory, Richland WA, USA
Abstract. In our present study, cloud boundaries derived
from a combination of active remote sensors at the ARM
SGP site are compared to POLDER cloud top phase index which is derived from polarimetric measurements using an innovative method. This approach shows the viability of the POLDER phase retrieval algorithm, and also lea•ts to interesting results. In particular, the analysis demonstrates the sensitivity of polarization measurements to ice crystal shape and indicates that occurrence of polycrystalline ice clouds has to be taken into account in order to improve the POLDER phase retrieval algorithm accuracy. Secondly, the results show that a temperature threshold of 240 K could serve for cloud top particle phase classification. Considering the limitations of the analysis, the temperature threshold could be biased high, but not by more than about 5 degrees. Introduction
The POLDER (POLarization and Directionality of the
Earth Reflectances)
instrument proved capable of deriv-
ing key information needed to improve our knowledge of
clouds, ra•tiation and climate interactions. In particular, the potential of polarization measurements of the upward
shortwave raxtiation to derive cloud information has been
clearly demonstrated
by POLDER data analysis IBrdon
and Goloub,
1998],[Chepfer
et al, 1998],[Goloub
et al, 2000].
From November 1996 to' the end of June 1997, the satellite version of POLDER provided polarization measurements on
a global scale. Because of the large POLDER field of view,
the same target on the Earth can be viewed from up to 14
directions during a single ADEOS over-pass. Cloud obser-
vations over a large range of scattering angles make possible
the distinction between liquid and ice phase [Pard et d,
1999],[Goloub
et al, 2000]. The eight months of POLDER
operational data have now been processed and are fully
available to the scientific community and a first analysis of the POLDER phase product, as well as comparison to
ISCCP data [Riedi et al, 2000], have proven the quality of
POLDER retrievals of cloud phase.
Our present approach consists of analyzing a combi-
nation of data from active remote sensors located at the
ARM Southern
Great Plains (SGP) site. For each ADEOS
pass over the ARM SGP site (approximately
every day),
POLDER-derived cloud phase information is compared to cloud top pressure and temperature which are derived from
active remote sensor measurements combined with rawin- sonde data available at the ARM SGP site.
The POLDER method of cloud phase determination is based on the polarization signature of cloud particles in the
near infrared [Goloub
et al, 2000]. Note that this signature
is directly linked to cloud particle shape. This method does not require any assumption about the relationship between cloud temperature, pressure and phase.
Data
Clothiaux et al have produced an extensive dataset of cloud heights from a combination of active remote sensors
at the ARM SGP site (36037
' N, 97030
' W) (further
referred
as the ARSCL dataset). The temporal capabilities
of instru-
ments
such
as the Millimeter-wave
Cloud Ra•lar (MMCR) or
the Micropulse
Lidar (MPL) together with the type of infor-
mation that they can provide, make this dataset particularly well a•tapted for a precise study of the POLDER-derived
cloud phase
product. We refer here to [C7othiaux
et al, 2000]
for a complete description of instruments used to retrieve cloud heights. However, it is worth noting that this dataset is the most robust available during the POLDER operational period to conduct an analysis over a broa•l range of cloudi- ness situation. The operational POLDER phase product is delivered at a spatial resolution of about 60 kmx60 kin. For this study, the level i data set has been processed in order
to get the phase index and cloud top pressure at full res-
olution (6.2 kmx6.2 kin) to enable precise
comparisons
to
250 24O 210 i I i
-- Temperature
(K)
- - Altitude
(kin)
\/(a)•
1700 1•50 1•0 1850 UTC time ß 12.0 T c-•' .... ._ .... .':...::: ?:•:/":'i "" ::.-:'•'•.:•<•,x:':-:;'•(•11.5
36 ' '::'• '•:: ...`.x•....•.`..•:.•...:i:•:i:i:5:!:;:•:i:!:i:i:•:•:!:5:i:!:!:!:i:5:i:::i..:...:.:!:::i55:::::::: ::::::::::::::::::::::::::::::::::::::::::::::::::::::::::::::::::::::::::::::::::::::::::::::::::::::::::..::::::::..•:: 35 ::::::::::::::::::::::::::::::::::::::::::::::::::::::::::::::::::::::::::::::::::::::::::::::::::::::::::::::::::::::::::::::::::::::::::::::::::::::::::::::::::::: 105Copyright 2001 by the American Geophysical Union. Paper number 2000GL012758.
0094-8276/01/2000GL012758505.00
Figure 1. (a) Cloud top altitude and temperature profiles
derived from ARM-SGP ground measurements. (b) Cloud top Rayleigh pressure (hPa) derived from POLDER data on same
day - SGP-ARM site location is marked by the cross.
2186 RIEDI ET AL.- COMPARISON OF POLDER PHASE DATA TO ARM SGP MEASUREMENTS
Rayleigh Pressure
-':...::.:•i•:::.:!:ii•::!::!:!i!• .•i:•:' :::½::::::::::::' --'-'::• "•'"':'• •:•'..::'::!::!:;:;•i!;:::1 .. •.:- .... :::::::::::::::::::::::::::: .... . ... .:...:::?.. -..--..::. •...•, ..•!..-:•!
•,,..-:j, ..-".':::':':!,".:,•!•::!i•i!i•!•i•"'::.:-'.:•-.!!?::•' --"..'.-'-'•:iys•:":;i.' ...
I , I • I • I • I • I
Cloud top Phase
liquid ice multilayer
Temperature profile
t ... ' ... (c
2'70 •0 240 220210
I
200• , , , •, ,• , , , 16h00 17h00 18h00 Time (UTC)Figure 2. Cloud top l•yleigh pressure (a) and phase (b) derived from POLDEI• data for a case of cirrus overlaying low liquid
clouds (1997-02-13). Associated cloud top temperature profile (c) derived from ARM-SGP ground measurements. Spatial extent of
presented area is •370kmx370km and the box centered on the ARM-SGP site is •31kmx31km large.
ARSCL data. The cloud boundaries used in this paper are determined from a combination of radar, lidar and ceilome-
ter data as described
by Clothiaux et al. [2000]. The cloud
top (especially
of the highest
cloud layer) is usually obtained
from the radar data alone. Despite the very sensitive nature
of the ARM cloud radar •, the radar is not sensitive
to very
small cirrus cloud particles. Hence the radar derived cloud boundary may be less than the actual cloud top. However,
Clothiaux et al. [2000] show that most of the time the un-
derestimate of the radar cloud top to the lidar cloud top
(when the two can be compared)
is less
than 1 kin. So while
it is true that our estimate of the cloud top height is likely
to be biased low (i.e., temperature
to be biased high), we
believe this bias will be less than 1 km, or equivalently, less than about 5 degrees.
Temporal resolution
of the ARSCL dataset (10s), enables
one to match the time of the POLDER observations very precisely. The cloud boundary profiles have been used to derive continuous cloud top temperature and pressure time
series. Cloud top temperature/pressure is derived from raw- insonde measurements at the same altitude as radar/lidar
detected cloud top. Temporal variability of the cloud cover is evaluated by considering data acquired half an hour before and after each ADEOS over-pass. We have analyzed in de-
tail the subset of 7 months of observations (from December
for which Rayleigh pressure is known to overestimate cloud top pressure. Finally, the zone located in the south-east is covered by a mixture of cirrus clouds and clear sky, which ex- plains the large Rayleigh pressure variability in that region. Although Rayleigh pressure can give useful information on the spatial variabihty of cloud cover, the pressure and alti- tude of cloud top derived from radar data are thought to be more reliable. Cloud top altitude and temperature for 16:30-18:30 UTC December 27, 1996 are presented in fig- ure la. Note that these are consistent with the ice phase
retrieved by POLDER over the ARM SGP site (cross on
figure lb).
Analysis
Cloud top phase retrieval accur.acy
In order to assess the accuracy of the cloud top phase retrieval algorithm, we compared retrievals of cloud phase derived from POLDER data with cloud top temperature inferred from ground-based measurements. In most cases, liquid and ice clouds were well separated by a temperature threshoM of about 240 K. However, there were three excep- tions to this general result and we now describe them in
more detail.
1996
to June
1997)
when
both
ARSCL
and POLDER
data - case
1 - Some
ice phase
cases
were
associated
with temper-
are available. A total of 201 days of matching observations were identified for the SGP site for this period. An example of data available for one particular day is presented in fig- ure 1. The spatial area presented in figure lb is much larger than what is useful for comparison to radar measurements,
but it illustrates
how the Rayleigh
pressure
2 [Parol
et al,
1999] information can be used in our analysis. The darker
region in figure lb corresponds to high thick clouds associ-
ated with low pressure of about 200 hPa. The increase of cloud top pressure from 400hPa up to 700hPa corresponds to
a zone covered
by thin cirrus (optical depth smaller than 2)
•The MMCI• is a zenith-pointing radar that operates at a
frequency of 35 GHz and its main purpose is to determine cloud
particle locations and the first three Doppler moments of detected
cloud particles [Moran et al, 19981, [Clothiaux et al, 2000].
2The so-called Rayleigh pressure is derived from a differential
technic using polarized information in the 443 nm and 865 nm
channels.
atures greater than 260 K. They have been identified as low cloud edges. Polarization is not saturated for small cloud
optical thickness
[Coloub et al, 2000] so that polarization
features, on which the phase retrieval relies, are not always well defined for cloud edges and very thin clouds. This is not really a problem when polarization signatures are inte-
grated over groups of 3x3, or 9x9, pixels, but liquid water
cloud edges tend to be classified as ice clouds when data are processed at full resolution. This is one reason why fu- ture POLDER phase products should not be delivered at
full resolution.
- case 2 - The second case concerns occurrences of retrieved
liquid phase clouds below temperatures of 240 K. A detailed analysis of each case showed that they correspond to mul-
tilayered clouds. A typical situation is shown in figure' 2 for a case of thin cirrus overlaying low liquid clouds that
occurred on February 13, 1997. On that day, the radar reported two cloud layers and the temperature associated
RIEDI ET AL.' COMPARISON OF POLDER PHASE DATA TO ARM SGP MEASUREMENTS 2187 0.06
0.04
0.02 0.00 402o
,
liO
' I ' I ' I ' I ' ILiquid
(a)
i
!.
Multilaylr
(bi '
! i , i , i , i , iIce (c)
' 160
' 1:•0
' lJ2 ' 1•0
' 1•0
Scattering
Angle
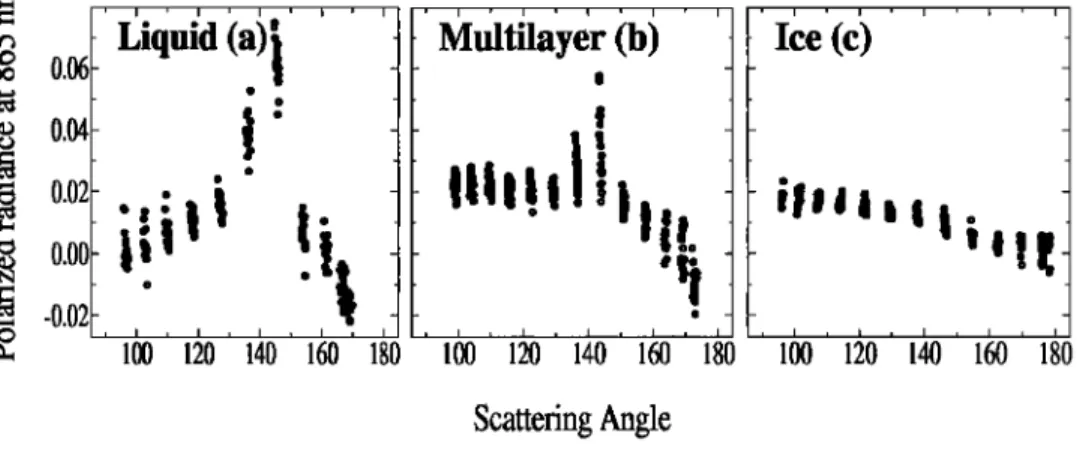
Figure 3. Observed polarized radiance as a function of scattering angle for liquid clouds (a) , thin cirrus overlaying low liquid clouds (b), and thick cirrus (c).
of Rayleigh pressure, illustrated by figure 2a, is character-
istic of a cirrus with varying optical depth (as mentioned in section 2). As figure 3 illustrates, three typical polar-
ization signatures can be observed when a cirrus overlays lower liquid clouds. If cirrus optical depth is greater than 2, polarization is saturated and Rayleigh pressure is correctly
retrieved (250 hPa region in figure 2a). In this case, the
polarization signature presents characteristic features of ice
clouds (figure 3c). As cirrus optical depth decreases, the Rayleigh pressure increases (500 hPa region in figure
and POLDER underestimates the cloud top altitude. At the same time the rainbow at 140 ø , characteristic of spheri- cal liquid phase particles, begins to appear due to underly-
ing liquid clouds (Figure 3b). Finally, as the cirrus optical
depth decreases further, the polarization signature tends to
present only the characteristic features of liquid clouds (Fig- ure 3a). Clearly, POLDER sees the liquid clouds through
the thin cirrus, but the raAar still reports a high and cold cloud layer, leaAing to the apparently surprising result of liquid phase clouds below 240 K.
case 3 - The last and most surprising case was the occur- rence of liquid phase around 210 K. These cases were not actually associated with liquid clouds, but with cirrus clouds composed of particles with particular microphysics. Models of ice clouds composed of monocrystalline hexagonal par-
ticles (plates, columns) have a positive polarization that
decreases
with scattering angle (figure 4b). Note that our
initial phase retrieval algorithm is partly based on this hy-
pothesis. Thus, if a cirrus cloud exhibits a signature with
an increasing
polarization
with scattering
angle (Figure
it could be declared as liquid cloud when no other informa- tion is available. Typically, models of cirrus composed of polycrystMs could produce such a behavior. This problem
can be solved using a simple threshold test, but the fact is
that this has not been investigated to date during the val- idation process of the POLDER phase retrieval algorithm.
This is a clear demonstration of the usefulness of the AR- SCL dataset to conduct such studies and outlines the fact
that these data should be used extensively for the purpose of validation during future POLDER missions.
Temperature dependency of cloud top phase
The mean hourly cloud top altitude derived from the AR-
SCL dataset is now used to assess the POLDER phase index
at the ARM SGP site. We focus on days with a rather stable
and homogeneous cloud cover so that problems due to cloud
edges can be discarded. Also, we reprocessed the POLDER data in order to account for the microphysical findings pre- viously mentioned.
We have selected cases with a cloud cover greater than
90% (according
to the raxlar data) during a time interval
of one hour around the POLDER over-pass. Cloud top
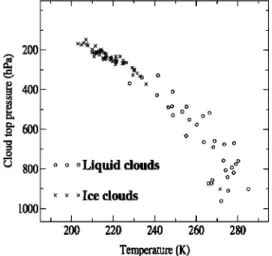
temperature and pressure from the ground-based measure- ments were averaged during the one hour interval and the POLDER cloud phase index was evaluated on a 3x3 level 1 pixel zone centered on the ARM SGP site. All together, 98 cases were analyzed and each case resulted in a POLDER phase index that was a result of either a pure liquid or ice cloud. The results are presented in figure 5 as cloud top pressure versus cloud top temperature plots.
A temperature threshold of 240 K separates most re- trieved ice clouds from retrieved liquid water clouds. Only 3 ambiguous cases remain, with one ice phase case occurring
0.05 0.03 0.02 0.01 70 80 90 100 110 120 130
Scattering
angle
Figure 4. Polarized radiance (corrected from 1Zayleigh contri-
bution) at 865nm observed by POLDE1Z over two different high
thick and cold clouds. One of them (a) present a positive polar-
ization increasing with scattering angle whereas it does usually
decrease for most ice clouds models (b). Viewing geometries as-
sociated to each case are very similar and presented on top polar diagram.
21 $$ RIEDI ET AL.: COMPARISON OF POLDER PHASE DATA TO ARM SGP MEASUREMENTS 200 4O0 6O0 800 [ooo o o oo ø o o o ø o o o o oLiquid clouds x xIce clouds 200 220 240 260 Temperature (K) o o o o o I 280
Figure 5. Temperature dependency of cloud top phase for
clouds located above the SGP-ARM site (36 ø 37•N, 97 ø 30•W).
at 270 K (cloud edge) and two liquid cloud cases
below 240
K (multilayered
cases). These results, limited to the ARM
SGP site, should not be considered representative for all lo- cations. However, the threshold of 240 K already mentioned
in the literature [Hutchison
et al, 1997] seems
to be justified
by these results and comparisons of the POLDER phase
product with ISCCP data [Riedi et al, 2000] tend to confirm
these findings. Also, it should be noted that low and middle
clouds associated with a temperature lower than 260 K are
declared
as ice clouds
in the present
ISCCP dataset [Rossow
eta/, 1996]. Our present results tend to demonstrate
that
this threshold should be revised.
Conclusion
Comparisons of the POLDER phase index to cloud top pressure and temperature data derived from completely in- dependent ground based measurements were performed to validate POLDER phase products.
This analysis allowed us to improve the POLDER phase retrieval algorithm by taking into account particular micro- physical properties of some cirrus clouds. Also, it shows the relevance of POLDER phase products to parameters useful in GCMs. In particular, the temperature threshold at 240
K is remarkable. While the limitation inherent to the use
of radar/lidar measurements
could bias high this value, we
believe this bias will be less than about 5 degrees. Consider- ing this range of error, our analysis is consistent with many results reporting in-situ observation of highly-supercooled
liquid water drops at temperatures
around 240 K [Sossen
and Dodd, 1988], [Heyrnsfeld
and Miloshevich,
1993]. The
question of wether or not supercooled liquid water can occur below 240 K can not be addressed here due to the possible bias of 5 degree and the lack of measurements in the range
235-240 K. However, the use of the ARSCL dataset allow us
to evaluate a wide variety of cloud conditions and this is a
clear advantage of the ARSCL dataset. This analysis com-
plements very well studies where only lidar measurements
were
used
and
th in clouds
sampled
(see
[Chepfer
et al, 2000]
for example).
In the future, a great opportunity to pursue these studies
will be provided by the launch of two new POLDER instru- ments. The first one, on ADEOS II, will be launched mid
2002, and the second
one on PARASOL (end of 2003) will be
launched
in conjunction
with EOS-PM and Picasso/Cena.
At that time, data provided by instruments operating at the
ARM sites (SGP, North Slope of Alaska and the Tropical
Western Pacific) will be of great interest.
Acknowledgments. The authors are very grateful to
NASDA and CNES who provided the POLDER data. Thanks also to the ARM program for providing the ground measurements
and to Eugene
Clothiaux
(Penn State) and Jay Mace (University
of Utah) who processed the data. Finally, the authors wish to
acknowledge the two anonymous referees for their very valuable help and numerous helpful comments on this paper.
References
Brdon, F.M., and P. Goloub, Cloud droplet effective radius from spaceborne polarization measurements, Geophys. Res. Left.,
25, 1879-1882, 1998.
Chepfer, H., G. Brogniez, and Y. Fouquart, Cirrus clouds micro- physical properties deduced from POLDER observations, J. of
Quant. Spectr. and Rad. Transfer, 30, 375-390, 1998. Chepfer, H., P. Goloub, J. Spinhirne, P. H. Flareant, M. Lavorato,
L. Sauvage, G. Brogniez and J. Pe]on, Cirrus cloud properties
derived from POLDER-1/ADEOS polarized radiances: First
validation using a ground-based LIDAR network, J. Applied
Meteor., 39, 154-168, 2000.
Clothiaux, E. E., T. P. Ackerman, G. G. Mace, Kenneth P. Moran, R. T. Marchand, M. A. Miller and B. E. Martneri, Objective Determination of Cloud Heights and RaAar Refiec- tivities Using a Combination of Active Remote Sensors at the AlUM CART, J. Applied Meteor., 39, 645-665, 2000.
Goloub, P., M. Herman, H. Chepfer, J. Ri&ti, G. Brogniez, P. Couvert, G. S•ze, Cloud thermodynamic phase classification from the POLDER spaceborn instrument, J. Geophys. Res.,
105, 14747-14759, 2000.
Heymsfield, A.J. and L.M. Miloshevich, Homogeneous ice nucle- ation and supercooled liquid water in orographic wave clouds, J. Atmos. Sci., 50, 2335-2353, 1993.
Hutchison, K. D., B. J. Etherton, P. C. Topping, and H. L. Huang, Cloud top phase determination from the fusion of signatures in daytime AVHRP• imagery and HIRS data, Int. J. Remote
Sensing, 18, 3245-3262, 1997.
Moran, K. P., B. E. Marther, M. J. Post, R. A. Kropfii, D. C. Welsh, and K. B. Widener, An unattended cloud-profiling radar for use in climate research, Bull. Am. Meteorol. Soc., 79,
443-455, 1998.
Parol, F., J. C. Buriez, C. Vanbauce, P. Couvert, G. S•ze,
P. Goloub, and S. Cheinet, First results of the POLDER "Earth R•iation Budget and Clouds" operational algorithm.
IEEE/Tran. Geosc. Rein. Sens., 1999.
Pd•cli, J., M. Doutriaux-Boucher, P. Goloub and P. Couvert,
Global distribution of cloud top phase from POLDER/ADEOS
I. Geophys. Res. Left., 27, 1707-1710, 2000.
Rossow W. B., A. W. Walker, D. E. Beuschel and M.D. Roiter,
International Satellite Cloud Climatology Project (ISCCP),
Documentation of new cloud datasets, World Climate Research
Program (ICSU and WMO), Tech. Doc. WMO/TD 737, 115
pp., 1996.
Sassen, K., and G.C. Dodd, Homogeneous nucleation rate for highly supercooled cirrus cloud droplets, J. Atmos. Sci., d5,
1357-1369, 1988.
P. Goloub, and J. Riedi, Laboratoire d'Optique Atmo- sph6rique, Universit6 des Sciences et Technologies de Lille, 59655
Villeneuve d'Ascq Cedex. France, Phone: (33) 3 20 33 61 85, Fax: (33) 3 20 43 43 42, (e-mail : riedi•loaser.univ-lillel.fr;
go lou b• loaser. univ- lille 1. fr)
R. T. Marchand, The Pacific Northwest National Laboratory,
Richland WA (e-mail: roj•pnl.gov )
(Received December 13, 2000; revised March 9, 2001;