HAL Id: hal-01261321
https://hal.archives-ouvertes.fr/hal-01261321
Submitted on 25 Jan 2016
HAL is a multi-disciplinary open access
archive for the deposit and dissemination of
sci-entific research documents, whether they are
pub-lished or not. The documents may come from
teaching and research institutions in France or
abroad, or from public or private research centers.
L’archive ouverte pluridisciplinaire HAL, est
destinée au dépôt et à la diffusion de documents
scientifiques de niveau recherche, publiés ou non,
émanant des établissements d’enseignement et de
recherche français ou étrangers, des laboratoires
publics ou privés.
Yves Garrabos, Carole Lecoutre-Chabot, John Hegseth, Vadim Nikolayev,
Daniel Beysens, J.-P Delville
To cite this version:
Yves Garrabos, Carole Lecoutre-Chabot, John Hegseth, Vadim Nikolayev, Daniel Beysens, et al.. Gas
spreading on a heated wall wetted by liquid. Physical Review E : Statistical, Nonlinear, and Soft Matter
Physics, American Physical Society, 2001, 64 (5), 051602 (10 p.). �10.1103/PhysRevE.64.051602�.
�hal-01261321�
V. S. Nikolayev∗ and D. Beysens
ESEME, Service des Basses Temp´eratures, CEA-Grenoble, France†
J.-P. Delville
Centre de Physique Mol´eculaire, Optique et Hertzienne,
CNRS, Universit´e de Bordeaux I, Cours de la Lib´eration, 33405 Talence Cedex, France (Dated: January 26, 2016)
This study deals with a simple pure fluid whose temperature is slightly below its critical temper-ature and its density is nearly critical, so that the gas and liquid phases co-exist. Under equilibrium conditions, such a liquid completely wets the container wall and the gas phase is always separated from the solid by a wetting film. We report a striking change in the shape of the gas-liquid interface influenced by heating under weightlessness where the gas phase spreads over a hot solid surface showing an apparent contact angle larger than 90◦. We show that the two-phase fluid is very
sen-sitive to the differential vapor recoil force and give an explanation that uses this non-equilibrium effect. We also show how these experiments help to understand the boiling crisis, an important technological problem in high-power boiling heat exchange.
I. INTRODUCTION
Singular properties of a simple fluid [1, 2] appear when
it is near its critical temperature, Tc, and its critical
den-sity, ρc. When the fluid’s temperature, T , is slightly lower
than Tcand the average fluid density ρ is close to ρc the
fluid exhibits perfect wetting (i.e., zero contact angle) of practically any solid by the liquid phase in equilibrium. In this article we study a system that is slightly out of equilibrium. Our experiments, performed in weightless-ness [3–7] showed that when the system’s temperature
T is being increased to Tc, the apparent contact angle
(see Fig. 7 below for definition) becomes very large (up
to 110◦), and the gas appears to spread over the solid
surface. In section II we describe our experimental setup that allows the spreading gas to be observed. The gas-liquid interface shape at equilibrium, which is considered in section III, plays a crucial role as an initial condition for the gas spreading phenomenon. The sections IV and V deal with the observations of the spreading gas. A the-oretical model that allows this unusual phenomenon to be explained is proposed in section VI. In the section VII, we discuss the boiling crisis, a phenomenon that plays an important role in industrial applications, and how it is relevant to the spreading gas.
∗email:[email protected]
†Mailing address:CEA-ESEME, Institut de Chimie de la Mati`ere Condens´ee de Bordeaux, 87, Avenue du Dr. Schweitzer, 33608 Pessac Cedex, France
II. EXPERIMENTAL SETUP
We report results that were obtained and repeated
using several samples of SF6 (Tc = 318.717 K, ρc =
742 kg/m3). These samples were heated at various rates
in cylindrical cells of various aspect ratios on several French/Russian and French/American missions on the Mir space station using the Alice-II instrument [8]. This instrument is specially designed to obtain high precision temperature control (stability of ≈ 15 µK over 50 hours, repeatability of ≈ 50 µK over 7 days). To place the sam-ples near the critical point, constant mass cells are pre-pared with a high precision density, to 0.02%, by observ-ing the volume fraction change of the cells as a function of temperature on the ground [9].
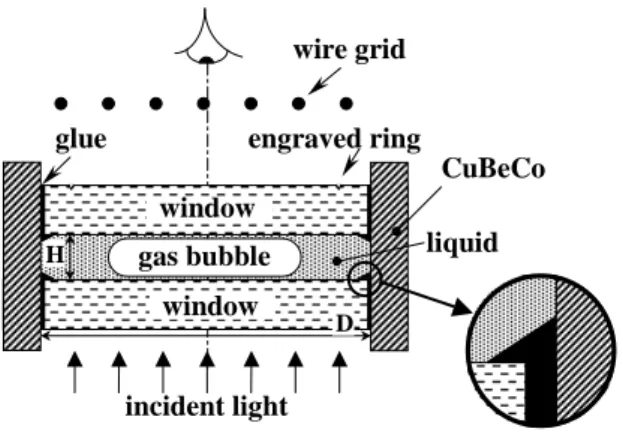
A fluid layer was sandwiched between two parallel sap-phire windows and surrounded by a copper alloy housing in the cylindrical optical cell, the axial section of which is shown in Figure 1. We consider here three cells of the same diameter D = 12 mm, the other parameters of which are shown in Table I. The liquid-gas interface was visualized through light transmission normal to the win-dows. Since the windows were glued to the copper alloy wall, some of the glue is squeezed inside the cell as shown in Fig. 1. This glue forms a ring that blocks the light transmission in a thin layer of the fluid adjacent to the copper wall making it inaccessible for observations. Be-cause of this glue layer, the windows may also be slightly tilted with respect to each other as discussed in sec. III. A 10 mm diameter ring was engraved on one of the windows of each cell in order to calibrate the size of the visible area of the cell images as can be seen in each
im-CuBeCo engraved ring incident light window window H wire grid glue D
gas bubble liquid
FIG. 1: Sketch of a cross-section of the cylindrical sample cell (with parallel windows). The fluid volume is contained between two sapphire windows that are glued to a CuBeCo alloy ring. The dimensions H (see Table I) and D(=12 mm) of the cell are indicated. Some glue is squeezed into the cell. The thickness of the glue layer is exaggerated for illustration purposes. In weightlessness, the gas bubble should be located in the middle of such an ’ideal’ cell, see sec. III for the discus-sion.
Cell number Cell thickness H (mm) (ρ − ρc)/ρc(%)
8 3.016 0.85
10 1.664 0.25
11 4.340 0.87
TABLE I: Physical parameters of the experimental cells. Cell 11 has a movable piston to change the cell volume. However, the volume was kept constant during these experiments.
age. An out-of-focus wire grid, designed to visualize [10] fluid inhomogeneities and/or a fluid flow through light re-fraction, was also used. The grid was occasionally moved out of the light path, so that it is not always present in all images.
The sample cell is placed inside of a copper Sample Cell Unit (SCU) that, in turn, is placed inside of a thermostat. Heat is pumped into and out of the SCU using Peltier elements and heaters. The temperature is sampled every second and is resolved to 1µK.
Similar ground based experiments were done before these experiments using a copy of the same instrument. The gravity forces push the denser liquid phase to the bottom of the cell and completely different behavior is seen, see [11].
III. BUBBLE POSITION AT EQUILIBRIUM UNDER WEIGHTLESSNESS
The gas volume fraction φ (volume of the gas divided by the total cell volume) is defined by ρ and the densities of gas and liquid for the given temperature. In our exper-iments, φ ≈ 0.5 and the gas bubble is flattened between
the windows (Fig. 1) due to the large aspect ratio D/H of the cell.
Let us first consider an ideally cylindrical cell as op-posed to the real cell. At equilibrium, the windows and the copper wall are wetted by the liquid phase. Because the van der Waals forces from the walls act to make the wetting film as thick as possible, the weightless bubble should be located in the cell’s center. Because the bubble is flattened and occupies one-half of the available volume, the distance of such a centered bubble to the copper wall is large (Fig. 1). The lateral centering forces are then much weaker than the centering forces in the direction of the cell axis. Any small external influences in the real cell can displace the bubble laterally from the cell’s cen-ter. This displacement is illustrated in Fig. 2 that shows cell 10 at room temperature. We note that there are two kinds of external influences that are easily identified: residual accelerations in the spacecraft and cell asymme-try.
Bubble images for cells 8 and 10 were recorded in four Mir missions between 1996 and 2000. Several images are reported in [3] (Cassiopeia mission, 1996) and in Fig. 6 below (GMSF2 mission, 1999) for cell 10. It is extremely likely that the space station changed its position with re-spect to the residual gravity vector between these runs. The bubble position with respect to the cell, however, al-ways remained the same. The bubble location also varies from cell to cell without any dependence on the station’s orientation. Therefore, we have no reason to attribute the off-center position of the bubble to the residual grav-ity.
Although the cells were manufactured with high pre-cision, the cell windows could not be exactly parallel be-cause of the glue layer as shown in Fig. 3. In the rest of this section we will discuss the influence of the windows’ tilt on the position and on the shape of the bubble.
When the bubble’s surface is curved, there is a con-stant excess pressure ∆p inside the bubble defined by the Laplace formula
∆p = σK, (1)
where σ is a surface tension and K is the surface curva-ture. This excess pressure acts on all parts of the bubble
interface. In particular, it acts on the part Asg(where the
index s stands for “sapphire” and g for “gas”) of the flat window surface that contacts the gas directly (or, more accurately, through a wetting film that we assume to be of homogeneous thickness). This pressure creates
reac-tions forces ~Fs(1) and ~Fs(2) at each window, that act on
the bubble. Each of these forces is perpendicular to the
corresponding window. The absolute values of ~Fs(1) and
~
Fs(2) are equal to Asg∆p. When the windows are exactly
parallel, ~Fs(1)+ ~Fs(2) = 0 and the bubble remains at the
cell’s center. When the windows are tilted with respect
to each other, the non-zero force ~Fs(1)+ ~Fs(2) pushes the
bubble in the direction of the increasing cell thickness. This motion continues until the bubble touches (through
a b
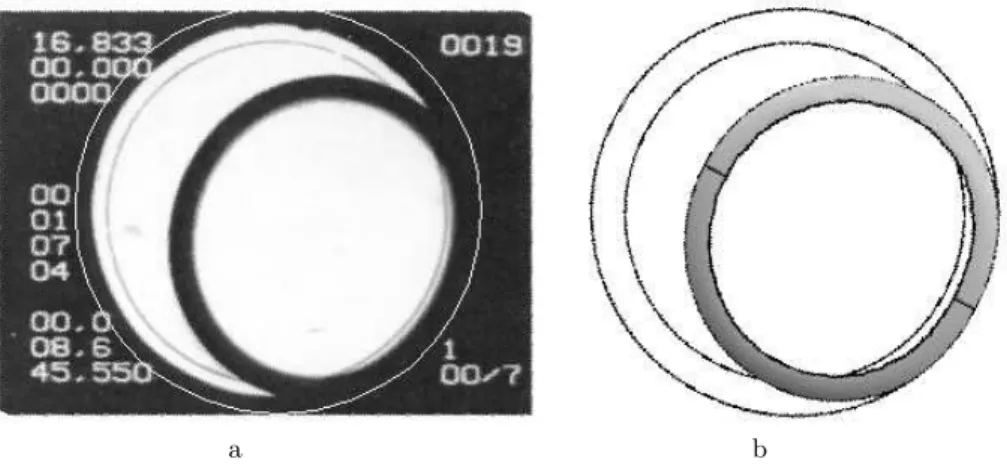
FIG. 2: The experimental image of cell 10 at room temperature (a) and the equilibrium bubble shape simulated for the tilt angle of 0.46◦ (b). When superposed, the images (a) and (b) give almost perfect match. The outer white circle in (a) (black
in (b)) shows the actual location of the cell wall. The inner black circles in (a) and (b) correspond to the engraved ring that allows the superposition to be made. The dark space between two these circles in the image (a) is made by the ring of glue as shown in Fig. 1. The image (b) is a frontal projection of the bubble shown in Fig. 4.
tilt angle
gas bubble
A
sgA
cgF
s(1) →F
s(2) →F
c →glue
FIG. 3: Sketch of a cross-section of the sample cell with the tilted windows at equilibrium in weightlessness. The wetting film is not shown. The window tilt is possible due to the ex-istence of a space between the window’s edge and the copper wall, which is filled by glue. This space and the tilt are exag-gerated for illustration purposes. Based on the manufacturing process a maximum tilt angle of ≈ 1◦ is possible. The glue
squeezed into the cell is not shown. The reaction forces that act on the gas bubble are shown with arrows. The contact areas of the gas bubble with the solid are indicated.
a wetting film) the copper wall of the cell, thus forming
a contact spot of the area Acg, where the index c stands
for “copper”. This direct contact with the solid results in
another reaction force ~Fcwith the absolute value Acg∆p,
such that
~
Fs(1)+ ~Fs(2)+ ~Fc= 0 (2)
in equilibrium, see Fig. 3.
There are two equivalent ways to find the bubble shape at equilibrium. One can solve Eq. (1) that reduces to K =const, where the constant is obtained from the con-dition of the given bubble volume. The bubble volume is
defined by the known gas volume fraction and the cell vol-ume. One can also minimize the gas-liquid interface area with a bubble volume constraint. In both cases bound-ary conditions must be satisfied (zero contact angle in our case). The resulting bubble shape obviously depends on the cell geometry. It is also nearly independent of tem-perature as can be seen from Eq. (2), because all three terms of this equation are proportional to the surface tension σ, so that this force balance remains valid even
near Tc, where σ disappears. There are, however, several
sources of weak temperature dependence of the bubble shape. First, there is weak dependence of the gas volume fraction φ on temperature at constant average density ρ.
This small deviation is smallest at the critical density ρc
and slightly greater in these experiments due to the very
small deviation (see Table I) of ρ from ρc. Second, the
curvature K depends on the thickness of the wetting film
that increases near Tc. The wetting film remains small,
however, in comparison with the cell thickness. Both of these effects are very weak.
The force ~Fc, which is directed horizontally in Fig. 3,
causes a distortion of the bubble. This distortion results in an oval image in Fig. 2 instead of a circle. The degree of distortion increases with the tilt angle because so does
~
Fc. This distortion can thus be used to estimate the tilt
angle.
For these constant volume gas bubbles, the degree of distortion should decrease with increasing cell thickness H for the same window tilt. A larger value of H results in a less compressed (more sphere-like) bubble shape with less area in contact with the wall. This smaller bubble curvature results in a smaller value for ∆p according to
Eq. (1). Consequently, the force ~Fc, the area Acg of the
contact with the copper wall, and the bubble distortion are smaller. This window tilt hypothesis is consistent with observations: we were not able to detect any
distor-tion of the gas bubble in cell 8 (see Fig. 10a below that corresponds to the nearly equilibrium shape) that is ap-proximately twice as thick (Table I) as cell 10 shown in Fig. 2. There is, however, some tilt in cell 8 because the bubble touches the wall. We expect that the tilt angles in all of the cells are of the same order of magnitude because they were all manufactured using the same method.
To verify the window tilt hypothesis, we performed a 3D numerical simulation of the bubble surface by us-ing the Surface Evolver finite element software [12]. The result of this calculation is shown in Fig. 4 for cell
10. The experimentally observed bubble deformation
FIG. 4: The result of a 3D finite element calculation of the equilibrium gas-liquid interface for cell 10 with a window tilt angle of 0.46◦. The vertices of the polygonal lines indicate the
location of the cylindrical copper wall and they are shown to guide the eye. A shape of the circular cylinder was input to the simulation. The contact angle is zero. A part of the image marked by the square is enlarged to show the contact area Acg of the gas with the copper wall (a small white
rect-angle crossed by two symmetry lines). The contact areas Asg
with the windows have the oval shape. The projection of this bubble shape to the cell window is shown in Fig. 2b.
matches the calculation performed for a tilt angle of
0.46◦, see Fig. 2. The simulation resulted in the interface
curvature K = 1.389 mm−1 and in A
cg = 0.150 mm2
calculated for the bubble volume V φ = 26.675 mm3.
From this data, it is easy to calculate the effective
ac-celeration gef f that would create the equivalent
buoy-ancy force Fc = (ρL− ρV)V φ gef f = Kσ Acg. It turns
out that gef f = 1.55 · 10−3g for T = 290 K, where g is
the gravity acceleration on Earth. This gef f acceleration
is much larger than the residual steady accelerations in
the Mir space station (∼ 10−6g) and this shows that the
observed bubble deformation is not caused by residual accelerations. We conclude that the window tilt hypoth-esis about the origin of the bubble deformation and its off-center position is correct.
A similar off-center bubble position was observed un-der weightlessness in a cell similar to ours by Ikier et.
al. [13] and was attributed to a residual acceleration.
However, they report only one run in a single cell mak-ing the actual cause of the bubble off-centered position
impossible to verify.
IV. CONTINUOUS HEATING EXPERIMENTS
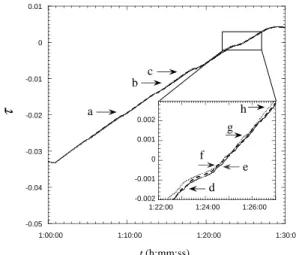
In the continuous heating experiments, the cells 8, 10 and 11 were heated nearly linearly in time t. The evo-lution of the non-dimensional temperature τ for each of these experiments is shown in Fig. 5. The parameter τ is
-0.05 -0.04 -0.03 -0.02 -0.01 0 0.01 1:00:00 1:10:00 1:20:00 1:30:00 τ t (h:mm:ss) c b a -0.002 -0.001 0 0.001 0.002 1:22:00 1:24:00 1:26:00 g d f e h
FIG. 5: Reduced temperature evolution for the image se-quences shown in Fig. 6 (solid line), Fig. 8 (dotted line), and Fig. 9 (dashed line). The temperature values that correspond to each of the images (a-h) shown in these figures are indi-cated by arrows and the corresponding letters. The definition of τ is discussed in the text. The temperature is measured in the body of the SCU. The vicinity of the critical point is enlarged in the insert.
defined as (T − Tcoex)/Tc, where Tcoexis the temperature
of the coexistence curve that corresponds to the fluid’s
average density shown in Table I. Note that Tcoexdiffers
from Tc only by 1 − 50 µK because the density is very
close to ρc for all cells. A 40 min temperature
equili-bration at τ ≈ −0.033 preceded the heating. The mean
value of dT /dt at Tc was ≈ 7.2 mK/s.
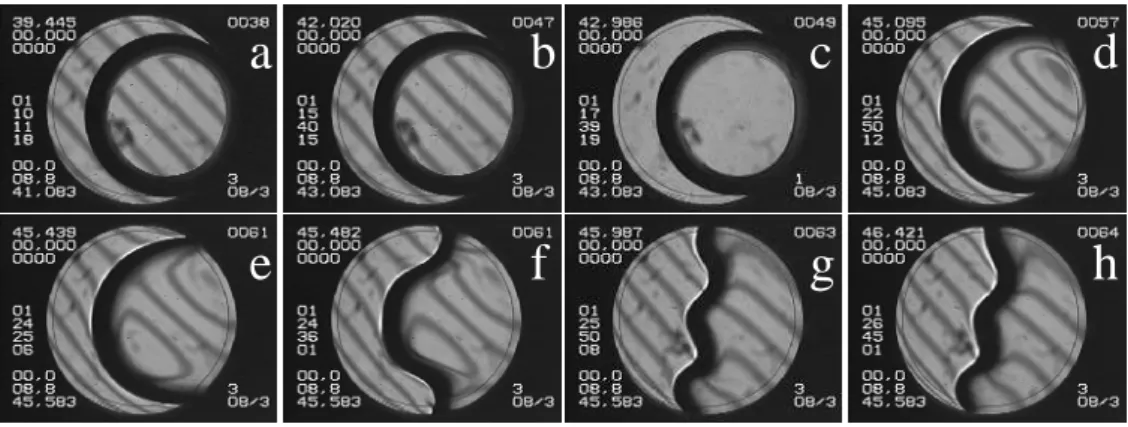
Figure 6 shows the time sequence of the images of
the cell 10. The interface appears dark because the
liquid-gas meniscus refracts the normally incident light away from the cell axis. After the temperature ramp was started but still far from the critical temperature, the
bubble shape changed. The contact area Acg of the gas
with the copper wall appears to increase. In other sys-tems the wetting film under a growing vapor bubble is observed to evaporate [14]. In near-critical fluids, how-ever, the heat transfer processes are more complex [15]. In this system we believe that there may be a similar drying process, i.e., at some time the thin wetting film that separates the gas from the copper wall evaporates. In fact, we have observed low contrast lines that appear
within the Asg area when the heating begins. An
h
g
f
e
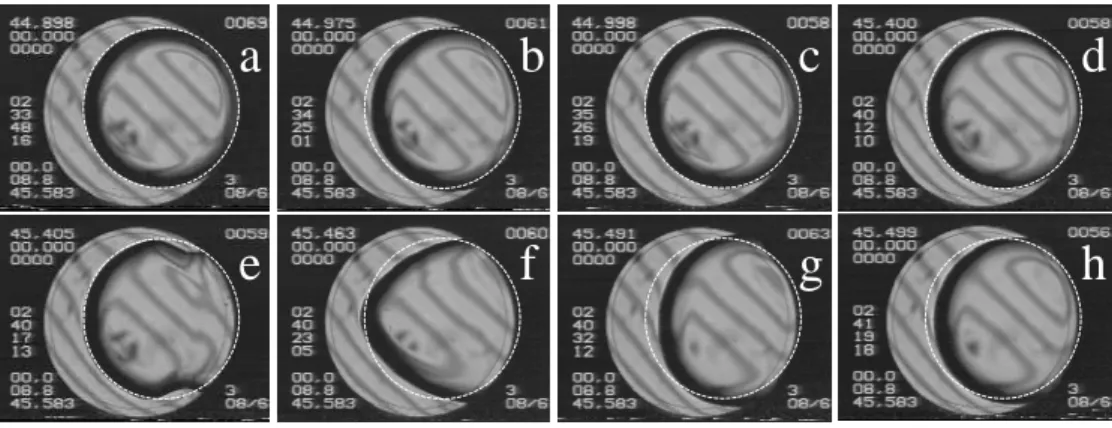
FIG. 6: Time sequence of images of the cell 10 during the continuous heating through the critical point. The temperature values that correspond to each of the images (a-h) shown in these Figures are indicated in Fig. 5 by arrows and the corresponding letters. This run is a repeat of the run shown in Fig. 2 of [3]. The gradual increase of the apparent contact angle as the gas spreads with increasing temperature is clearly seen. The time corresponding to each image is shown to the left of the cell in the middle. The magnified upper regions close to the contact line from the images (e-g) are shown in Fig. 7.
6e
8h
8g
6g
8f
8e
6f
glue
boundary
liquid-gas
meniscus
FIG. 7: The magnified upper regions close to the contact line from the images Fig. 6(e-g) and from the images Fig. 8(e-h). The apparent contact angle can be “measured” as the angle between the tangents to the black glue boundary and the liquid-gas meniscus. The latter corresponds to the boundary between the wide dark and narrow bright stripes on the images. The liquid domain is to the left from the meniscus. One can see that this apparent contact angle exceeds 90◦ in the images 6g and 8f.
arrows. The out-of-focus grid shows that these lines cor-respond to a sharp change in the wetting film thickness. These lines are most likely triple contact lines and we have actually seen them pinned by an imperfection on the windows as they advance and retreat in other exper-iments. Since the heat conductivity of copper is larger than that of sapphire, the heat is supplied to the cell mainly through the hotter copper wall. Therefore the film should evaporate on the copper wall even earlier than on the sapphire. A more refined analysis of the contact line motion will be discussed elsewhere.
The increase of the Acg area is accompanied by an
evi-dent increase in the apparent contact angle, see Fig. 6d–f and the corresponding magnified images in Fig. 7. Near the critical temperature the apparent contact angle
be-comes larger than 90◦! We will analyze these effects
the-oretically in section VI.
While crossing the critical point, the vapor bubble is
rapidly evolving. At T ≈ Tc, the surface tension vanishes,
the bubble’s relaxation from surface tension is negligible, so that the interface shape is defined by the variation of the local evaporation rate along the interface. The evap-oration is stronger at the parts of the interface closest to the copper heating wall. This effect leads to the waved interface shape shown in Fig. 6g. Diffusion causes the
disappearance of the interface at T > Tc as shown in
Fig. 6h.
Figure 8 shows the time sequence of the images of the cell 8, which is approximately twice as thick as cell 10. The images in Fig. 8 were taken exactly for the same values of the non-dimensional temperature τ (shown in Fig. 5) as the corresponding images in Fig. 6. The force
~
Fc pushes the bubble against the cell wall as in the case
of cell 10. As discussed above, this force is weaker than for the cell 10 because the bubble appears almost circular at equilibrium (see Fig. 6a and Fig. 8a). By comparing
a
b
c
d
h
g
f
e
FIG. 8: Time sequence of the images from cell 8 during continuous heating through the critical point. Images (a-h) were taken exactly for the same values of temperature (shown in Fig. 5) as corresponding images in Fig. 6. The magnified upper regions close to the contact line from the images (e-h) are shown in Fig. 7.
images (e) of both sequences, we can also see that the va-por spreads slower in cell 8. The increase of the apparent contact angle is also slower. The waved shape interface
appears earlier in Fig. 8f, i.e. farther from Tc than for
the cell 10. The interface is still quite sharp in Fig. 8h, while it has already diffused in the case of the thinner cell (Fig. 6h). This difference can be explained by the differ-ence in the liquid-gas interface area, which is roughly proportional to the cell thickness. The surface tension force that tends to maintain the convex shape is not as strong for the thicker cell where a larger fluid volume has to be moved during the same time. The diffusion time is larger for cell 8 because the size of the inhomogeneity (i.e. interface) is larger.
Figure 9 shows the time sequence of the images from cell 11, which is thicker than both the cells 8 and 10. The
a
d
i
f
FIG. 9: Time sequence of images of the cell 11 during the con-tinuous heating through the critical point. No bubble spread-ing is seen. The bubble does not touch the copper wall. The images (a, d, f) were taken exactly for the same values of tem-perature (shown in Fig. 5) as corresponding images in Fig. 6 and Fig. 8. The cell 11 contains three thermistors shown in image (i) by arrows. This image was taken after the temper-ature equilibration above Tc.
images (a), (d) and (f) were taken for the same values of non-dimensional temperature as corresponding images in Figs. 6 and 8. This cell contained three wetted thermis-tors (Fig. 9i) that constrain the bubble surface (Fig. 9a). The bubble is only slightly squeezed by the windows so that the reaction forces that act on the bubble at equi-librium are weak. As a result, the bubble does not touch the copper heating wall at all. Although this is not clear in the image (a), because of the glue near the copper wall, it is clear in image (f) where small newly formed bubbles separate the initial bubble from the wall. These bubbles form from the local overheating of the fluid between the large bubble and the copper wall. There is enough fluid between the large bubble and the wall so that a small bubble may grow in it. These small bubbles push the large bubble away from the wall before any coalescence can take place.
The comparison of these three experiments clearly shows that in order to obtain the bubble spreading, the bubble needs to have a direct contact with the heating wall, i.e. to be pushed to the heating wall by some force. Note that none of the images show any evidence of steady fluid motion that would be necessary to maintain the dis-torted bubble shapes in Figs. 6 and 8. We conclude that this distortion of the bubble equilibrium shape cannot be caused by fluid motion.
Similar continuous heating experiments are reported by Ikier et. al. in [13]. However, a smaller heating rate (1.7 mK/s) and erratic accelerations of the cell did not allow gas spreading to be observed.
V. QUENCHING EXPERIMENTS
Figure 10 shows the time sequence of the images of cell 8 when it was heated by 100 mK quenches as shown in Fig. 11. While the heating rate is quite large during each quench, the time average of the heating rate 1.4 mK/s is smaller than that during the continuous heating due
h
g
f
e
FIG. 10: Time sequence of images of cell 8 during two 100 mK quenches. The gas spreads during each quench that lasts about 12 s. The equilibrium position of the vapor bubble with respect to the cell is shown by the white circle in each image for comparison.
a
-0.0025 -0.002 -0.0015 -0.001 -0.0005 0 2:30:00 2:35:00 2:40:00 2:45:00τ
t (h:mm:ss)
g
h
d
c
b
e
f
FIG. 11: Temperature evolution during the series of quenches. The points that correspond to each of the images in Fig. 10(a-h) are indicated by arrows and corresponding letters. The temperature is measured in the body of the SCU.
to the waiting time of ≈ 60 s after each quench. Dur-ing this waitDur-ing time a partial equilibration takes place. The images (a–c) show a slight bubble spreading that appears during a quench that is farther from the criti-cal point than the quench shown in images (d-h). After each quench as soon as the heating stops, the bubble in-terface begins to return to its initial form (Fig. 10c,d). This shows that the spreading vapor is caused by a non-equilibrium effect. The second quench that precedes the crossing of the critical point (Fig. 10d–h) shows very rapid interface motion accompanied by fluid flows.
While the interface returns to its initial state during the waiting time of the first quench (Fig. 10c), it does not return in the second quench (Fig. 10h). This occurs because the characteristic equilibration time grows
dra-matically near Tc.
The same phenomenon of spreading gas was also
ob-served during the heating of CO2 cells in other
experi-ments (Pegasus BV4705, Post-Perseus F14) carried out by our group in the Mir station. However, these experi-ments were not designed to study the spreading gas and we do not discuss them here.
VI. INTERFACE EVOLUTION DURING THE HEATING
The above experimental data showed that the spread-ing gas and the associated interface deformation are caused by an out-of-equilibrium phenomenon. This is especially demonstrated by the analysis of the interface shape at equilibrium (sec. III) and by the return to the equilibrium shape after each quench in sec. V. In this section we analyze possible causes of the spreading gas. Two causes are considered: Marangoni convection due to
the temperature change δTialong the gas-liquid interface
and the differential vapor recoil.
A. Marangoni convection
If a temperature change δTi exists, it will create a
sur-face tension change δσ = (dσ/dT )δTi that will drive a
thermo-capillary (Marangoni) flow in the bulk of both fluids [16–18]. The images obtained in our experiment are capable of visualizing convective flows from the shadow-graph effect. We have not seen any evidence of the steady convection that is required to create and maintain the ob-served bubble shape continuously during the heating. We conclude that the Marangoni convection is absent.
This conclusion is an apparent contradiction with many works that study the Marangoni effect caused by evaporation (see e.g. [19]). The main difference between these works and ours is in the conditions of evaporation. These works consider the evaporation into an open space where the vapor pressure is very small. The interface
temperature thus follows the temperature in the bulk of the liquid and a very large evaporation rate is possible, limited only by the average velocity of the fluid molecules. In our case, the gas phase is almost at saturation pres-sure. This means that the total evaporation (over the whole gas liquid interface) is small and limited by the amount of the supplied heat consumed by the latent heat.
Therefore, any variation δTiis rapidly dampened by the
corresponding change in the evaporation rate, stabilizing the interface against Marangoni convection, see [15] for an extended discussion. This conclusion is confirmed by the experiments [20], in which Marangoni convection was carefully studied in a closed cell with very clean water in contact with its vapor. No surface-tension-driven convec-tion was registered in spite of a large Marangoni number that was much greater than its critical value obtained in the classical Marangoni-Benard experiments with non-volatile liquids [16]. It was argued in [16] that the vection was absent due to a hypothetical interface con-tamination present in spite of many careful preventive
measures. According to our reasoning, a variation δTi
would have been strongly dampened in [16] because of the saturation conditions in the sealed cell. We also note that even in evaporative driven Marangoni convection far from saturation, the convection cells may also tend to stabilize the interface resulting in intermittent cellular formation as was observed in [17]. It was also observed in [17] that the velocity of convection and frequency of intermittent cell formation decreases as the external gas becomes more saturated.
B. Differential vapor recoil
We now analyze another possible source of bubble de-forming stress that does not require a temperature gradi-ent along the interface. The bubble may be deformed by the normal stress exerted on the interface by the recoil from departing vapor [19]. Let n(~x) be the evaporating mass per unit time per unit interface area at the point ~x on the interface. The evaporating gas moves normally to the interface, and exerts a force per unit area (a “thrust”) on the liquid of
Pr(~x) = n2(~x)(1/ρG− 1/ρL), (3)
where ρ denotes mass density and the subscripts L and G refer to liquid and gas respectively.
The interface shape can be obtained from a quasi-static argument when the experimentally observed interface
ve-locity viis smaller than the characteristic hydrodynamic
velocity σ/η, where η is the shear viscosity. A numerical estimate shows that the quasi-static approximation holds for the images (a-f) in Fig. 6, in which the spreading is observed. The quasi-static approximation does not ap-pear to hold for the quench experiments (Fig. 10), where the interface moves rapidly.
According to the quasi-static argument [23], the inter-face shape can be determined from the modified Laplace equation
σK = ∆p + Pr(~x). (4)
The 3D curvature K is equal to the sum of the 2D cur-vature c in the image plane and the 2D curcur-vature in the perpendicular plane shown in Fig. 1. For the small cell thickness H, this latter curvature can be accurately ap-proximated by the constant value 2/H. This is possible because the relatively small heat flow through the less
conductive sapphire windows implies a small Prnear the
contact line on the windows, as compared to the large value of ∆p at this small H. The interface shape can thus be obtained from the 2D equation
σc = ∆p′+ P
r(l), (5)
where ∆p′is a constant to be determined from the known
bubble volume and l is a coordinate that varies along the bubble contour in the image plane.
In order to find the distribution n(~x) at the interface it is necessary to solve the entire heat transfer problem. This problem is complicated by several important factors. First, we deal with a problem that contains a free bound-ary (gas-liquid interface) the position of which should be determined. Second, this interface contains lines of singularities (gas-liquid-solid contact lines) where vari-ous divergences are possible. Third, the adiabatic heat transfer [15, 21, 22] (“the piston effect”) should be taken into account for near-critical fluids. The first two com-plications were addressed in [23–25] for plane geometry, i.e. for the gas bubble growing on a plane. We have shown that n(~x) can exhibit a divergence at the contact line and that it decreases exponentially far away from it. Because the bulk temperature varies sharply in the boundary layer adjacent to the walls of the cell [21] and the interface temperature is constant, the largest portion of mass transfer across the interface takes place near the triple contact line. Thus n(~x) is large in the vicinity of the contact line. In this work, we present first the scaling arguments and then an approximate calculation of the bubble shape to illustrate our explanation of the spreading gas in the cylindrical geometry.
We assume that n(~x) has the following form:
n(~x) = g(~x)(Tc− T )a (6)
as T → Tc, i.e., it has the same local behavior with
re-spect to temperature as the critical temperature is ap-proached. The integral rate of change of mass M of the gas bubble is defined as
dM/dt = Z
n(~x)d~x ∼ (Tc− T )a, (7)
where the integration is performed over the total gas-liquid interface area. On the other hand,
recoil scales as
Pr/σ ∼ (Tc− T )3β−2−2ν, (9)
where Eq. (3) and the scaling relationship σ ∼ (Tc− T )2ν
(ν = 0.63) were employed. Because this critical exponent (3β − 2 − 2ν ≈ −2.3) is very large, it should manifest itself even far from the critical point in agreement with
the experiments. In summary, as T → Tc, the vapor
mass growth follows the growth of its density (the vapor volume remains constant), so that the diverging vapor production near the critical point drives a diverging recoil force.
This curvature change has a striking effect on the bubble shape because it is not homogeneously dis-tributed along the bubble interface. Since the evapora-tion is strongest near the copper heating wall where the
strongest temperature gradients form, both Pr and c
in-crease strongly near this wall, i.e. near the triple contact line. Note that c is proportional to the second derivative of the bubble shape function, i.e. to the first derivative of the bubble slope. If c is large, then the slope of the bubble contour changes sharply when moving along the bubble contour towards the contact line, see [5, 23, 24] for more details. Because the interface slope changes so abruptly near the contact line, the apparent contact an-gle should be much larger than its actual value.
Because c is proportional to the second derivative of the bubble shape function, Eq. (5) is a differential equa-tion with the boundary condiequa-tion given by the actual contact angle [23]. This actual contact angle defines the first derivative (the slope) of the bubble shape function at the solid wall. It is also specified by the interfacial tension balance and must be zero near the critical point. This condition of the zero contact angle gives a boundary condition for Eq. (5). In order to illustrate a possible so-lution of Eq. (5), we solved it using the same expression
for Pr(l) as in [23]
Pr(l) ∝ −N log(l/L) exp{(−[l/(0.1 L)]2}, (10)
where l ∈ [0, L], L being a length of the bubble half-contour with l = 0 at the solid wall. We use a non-dimensional parameter N to measure the influence of the vapor recoil force relative to the surface tension. It is defined as N = 1 σ L Z 0 Pr(l) dl. (11)
where the integration is performed over the drop contour in the image plane. The numerical coefficient (see [23]) in
and a rapid decay away from it. It is shown in [25] that the rigorous numerical solutions obtained far from the critical point follow this behavior.
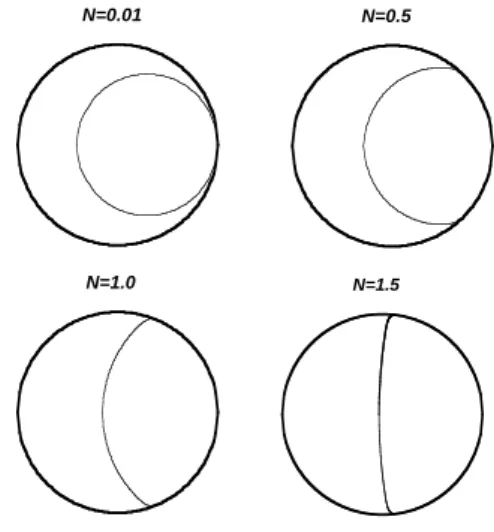
The result of this calculation is shown in Fig. 12. Since
N=1.5
N=0.01
¹¹¹` ` ‰˚ fiÛ´` ` ` ` ¿L_` ,˜ ` ` ` ` ` ` ,` (` Û+&` ` ` ^•T` z•T` à•T` ¹¹ñ•T` ¹¹¹¹¹¹¹¹` ` ` ` ` ` ` ` ` ` (` »` Û´òj_` ¿L_` ` ` ` ` Wˆ ˜ ` ¿` ` ` ` ` ` ` ` `` ` ` `` ` ` ˚ ` ´ ` ˚ ` ` ` ` ` l•T` ` ` ` ` Ł` ` ` ` ` ` ` ` ` ` ` ` ` ` ` ` ` ` ` ` ` ` ` ` ` ` ` ` ` ` ` ` ` ` ` X` h` Û´òj_` ¿L_` ` ` ` ` ` ` ` ` ` ` ` ` −` L` Û´òj_` ¿L_` ` ` ` ` ` ` ` ` ` ` ` ` Ÿ` –` −` Û+Ł` ` ` ` ` ` ` ` ` ` ` ` ` ` ` ` `
N=0.5
N=1.0
FIG. 12: Calculated bubble shape for different values of the non-dimensional strength of vapor recoil N that goes to infinity at the critical point. Note that the actual contact angle is zero for all the curves.
Eq. (9) implies
N ∼ (Tc− T )−2.3→ ∞ (12)
as T → Tc, the N increase mimics the approach to
the critical point and qualitatively explains the observed shape of the vapor bubble (see Fig. 6). The increase of the apparent contact angle and of the gas-solid contact
area Acg can be seen in Fig. 12. Note that such a
cal-culation is not able to predict the wavy interface shapes like those in Fig. 6g or Fig. 8f-h, because these images
correspond either to T > Tc (images g and h of the both
figures) or to the close vicinity of Tc where σ < viη, see
the discussion of the validity of the quasi-static approxi-mation earlier in this section.
VII. SPREADING GAS AND THE BOILING CRISIS
A very similar bubble spreading was observed far from
Tc during boiling at large heat flux [26, 27]. When the
heating to a surface is increased past a Critical Heat Flux (CHF) there is a sudden transition to “film” boil-ing, where the heater becomes covered with gas and may burnout [14]. This “boiling crisis” is an important prac-tical problem in many industries where large heat fluxes
are frequently used. We interpret [23, 25] the boiling cri-sis to be similar to the gas spreading shown here. The main difference is that the large value of N is made by a large vapor production that can be achieved during strong overheating rather than by the critical effects.
It is well-documented from experiments [14] that the CHF decreases rapidly when the fluid pressure p
ap-proaches the critical pressure pc, i.e., when T → Tc in
our constant volume system. Previously, this tendency has not been well understood. The divergence of the fac-tor N , discussed above, helps to understand it. We first note that the evaporation rate n scales as the applied
heat flux q and N ∼ q2, where Eqs. (3) and (11) are
used. By assuming that the boiling crisis (q = qCHF)
begins when N attains its critical value NCHF ∼ 1 (see
[23]), one finds that
qCHF ∼ (Tc− T )1+ν−3β/2∼ (Tc− T )1.1 (13)
from Eq. (12). The same exponent is also valid for the pressure scaling,
qCHF ∼ (pc− p)1.1. (14)
Eq. (14) explains the observed tendency qCHF → 0 as
p → pc.
Although the strict requirements on temperature sta-bility and the necessity of weightlessness lead to experi-mental difficulties to study the boiling crisis in the near-critical region, they also present some important
advan-tages. Only a very small heating rate (heat flux) is
needed to reach the boiling crisis because qCHF is very
small. At such low heat fluxes, the bubble growth is tremely slow due to the critical slowing-down. In our ex-periments we were able to observe the spreading gas (i.e. the dry-out that leads to the boiling crisis, see Fig. 6) during 45 min! Such experiments not only permit an ex-cellent time resolution, but also allow the complicating effects of rapid fluid motion to be avoided.
VIII. CONCLUSIONS
In our experiments we observed a gas bubble
spread-ing over a solid wall and a large value (> 90◦) of the
apparent contact angle that appeared despite the zero actual contact angle with the solid. The spreading gas is a phenomenon that can occur in a sealed heated fluid cell only when the bubble is pressed against the heating wall. The 3D numerical calculation of the equilibrium bubble shape showed that the slightly tilted windows of the experimental cell pressed the bubble against the cop-per side-wall. Weightless conditions are needed in the near-critical region in order to observe this phenomenon when the surface tension is small and a bubble-like shape persists. The same phenomenon can be observed far from the critical point during boiling at high heat fluxes where it is known as the “boiling crisis”. While the gas spreads very quickly during the boiling crisis far from the critical point, the near-critical region allows a very slow spread-ing gas to be observed in great detail.
We explain this phenomenon as induced by the vapor recoil force that changes the shape of the vapor-liquid interface near the triple contact line. Our preliminary calculations of the gas-liquid interface shape are quali-tatively consistent with the experimental images. The scaling analysis gives the critical exponent for the criti-cal heat flux decrease near the criticriti-cal point and explains the increase of the vapor recoil effect near the critical point. We believe that there is much to be learned about the boiling crisis in the near-critical region and hope that these experiments inspire more investigations.
Acknowledgments
This work was supported by CNES and NASA Grant NAG3-1906. A part of this work was made during the stay of V. N. at the UNO and he would like to thank the Department of Physics of the UNO for their hospitality. We thank all of the Alice II team and everyone involved in the Mir missions. We especially thank J. F. Zwilling, and the french cosmonauts Claudie Andr´e-Deshays, L´eopold Eyharts, and Jean-Pierre Haigner´e. We thank Kenneth Brakke for creating the Surface Evolver software and for making it available for the scientific community.
[1] M. Schick, in: Liquids at Interfaces, Eds. J. Charvolin, J.-F. Joanny & J. Zinn-Justin, Elsevier, p.415 (1989); D. Beysens , ibid, p. 499.
[2] R.F. Kayser, J.W. Schmidt, & M.R. Moldover, Phys. Rev. Lett. 54, 707 (1985).
[3] Y. Garrabos, C. Chabot, R. Wunenburger, J.-P. Delville, & D. Beysens, J. Chimie Physique 96, 1066 (1999). [4] J. Hegseth, Y. Garrabos, V. S. Nikolayev, C.
Lecoutre-Chabot, R. Wunenburger, D. Beysens, Proc. 14th Symposium on Thermophysical prop-erties, Boulder, CO (USA) June 25–30, 2000,
http://symp14.nist.gov/PDF/WET05HEG.PDF, Int. J. Thermophysics, to be published (2001).
[5] V. S. Nikolayev, D. A. Beysens, J. Hegseth, Proc. 14th Symposium on Thermophysical prop-erties, Boulder, CO (USA) June 25–30, 2000, http://symp14.nist.gov/PDF/WET10NIK.PDF, Int. J. Thermophysics, to be published (2001).
[6] Y. Garrabos, R. Wunenburger, C. Lecoutre, V. Niko-layev, D. Beysens, J. Hegseth, Proc. 1st Int. Symp. on Microgravity Research & Applications in Physical Sci-ences and Biotechnology Sorrento, Italy, Sept. 10-15,
[9] C. Morteau, M. Salzman, Y. Garrabos, & D. Beysens, in: Fluids in Space, Proc. 2nd European Symposium on Fluids in Space , Ed. A. Viviani, Jean-Gilder Congressi srl, Rome, p.327 (1997).
[10] V. Gurfein, D. Beysens, Y. Garrabos, & B. Le Neindre, Opt. Comm. 85, 147 (1991).
[11] J. P. Delville, M. Salzman, Y. Garrabos, & D. Beysens, in: Fluids in Space, Proc. 2nd European Symposium on Fluids in Space , Ed. A. Viviani, Jean-Gilder Congressi srl, Rome, p. 312 (1997).
[12] http://www.geom.umn.edu/software/evolver/
[13] C. Ikier, H. Klein, and D. Woermann, J. Colloid Interface Sci. 178, 368 (1996).
[14] L. S. Tong, Boiling Heat Transfer and Two-Phase Flow, Taylor & Francis, New York (1997), 2nd ed.
[15] J. Straub, L. Eicher, & A. Haupt, Phys. Rev. E 51, 5556 (1995).
[16] J. R. A. Pearson, J. Fluid Mech. 4, 489 (1958).
Fr¨ohlich, P. Carl`es, & B. Zappoli, Phys. Rev. E 57, 5665 (1998) and refs. therein.
[22] R. Wunenburger, Y. Garrabos, C. Lecoutre-Chabot, D. Beysens, & J. Hegseth, Phys. Rev. Lett 84, 4100 (2000). [23] V. S. Nikolayev & D. A. Beysens, Europhys. Lett. 47,
345 (1999).
[24] V. S. Nikolayev, D. A. Beysens, Y. Garrabos & J. Hegseth, Proc. 4th International Conf. on Multiphase Flow, New Orleans, May 27 – June 1, 2001, Int. J. Mul-tiphase flow, to be published (2001).
[25] V. S. Nikolayev, D. A. Beysens, G.-L. Lagier & J. Hegseth, Int. J. Heat Mass Transfer 44, 3499 (2001). [26] H. J. van Ouwerkerk, Int. J. Heat Mass Transfer 15, 25–
34 (1972).
[27] K. Torikai, K. Suzuki & M. Yamaguchi, JSME Int. J. Series II 34, 195 (1991).